Excluding Japan, the area formerly known as the Asian Tiger countries has never been more important. These countries are blessed with excellent demographics and natural resources. Some are industrial powers like Singapore, Taiwan and South Korea while others also offer good commodity plays, like Malaysia, Philippines and Indonesia.
But, as with most investing schemes from our view, timing is everything.
Japan certainly is in decline. Its debt burdens combined with poor demographics suggest a country that has more long term problems than the eurozone currently. For them these issues are becoming better known throughout the investment world. Clearly most know the markets there have been in a bear market since the 1990 peak with the exception of a few impressive bear market rallies. Nevertheless, large and even small Japanese companies have become multinational in scope and highly dependent on exports. Most are diversified and may do well given their global exposure away from domestic bear markets or conditions.
The former Asian Tiger markets have more volatility (beta) compared with other more established markets. When markets and global economies are stronger, these markets generally will outperform; and, conversely when global economies are weak they will underperform. The Philippines, Indonesia, Malaysia and Vietnam are blessed with both good demographics (younger population) and are rich in natural resources. Longer term these economies could decouple from other markets given their own domestic demand and needs.
Lastly these countries particularly benefit from economic growth and demand for resources from China. When China grows so too do these countries and vice versa.
In this sector there really are only 10 ETFs worth evaluating now. But as these economies grow, and no doubt many will, ETF offerings will expand into various subsectors within each country, beginning with small-caps and then moving on to others: consumer, financial, natural resources and so forth.
Simplistically, we recommend longer-term investors stay on the right side of the 12-month simple moving average. When prices are above the moving average, stay long, and when below remain in cash or short. Some more interested in a fundamental approach may not care so much about technical issues, preferring instead to buy when prices are perceived as low and sell for other reasons when high; but, this is not our approach.![]()
VNM follows the Market Vectors Vietnam Index which includes companies either domiciled in the country or earning at least 50% of its revenues from the country. The fund was launched in August 2009. The expense ratio is 0.76%. AUM equal $298M and average daily trading volume is 155K shares. As of July 2012 the annual dividend yield was 0.91% and YTD return 23.02%. The one year return was -7.90%.
Before this fund was launched I had received more interest in this country's future and ETF prospects than any other. But the country's equity market has struggled. It should be noted that inflation and currency devaluation have crippled equity performance. Further the economy and country are still heavily state controlled as a carryover from communist days continues. This doesn't help the free market economy despite much investor interest in the country.
Data as of June 2012
VNM Top Ten Holdings And Weightings
. Baoviet Holdings (BVH): 8.50%
. Vingroup JSC (VIC): 7.14%
. Joint Stock Commercial Bank for Foreign Trade of Vietnam (VCB): 6.95%
. Vietnam Bank for Industry & Trade (CTG): 6.93%
. Saigon Thuong Tin Commercial Joint Stock Bank (STB): 6.30%
. Petrovietnam Fertilizer & Chemicals Corp. (DPM): 5.52%
. Charoen Pokphand Foods PCL DR (CPOUF): 4.73%
. Talisman Energy Inc (TLM): 4.03%
. Premier Oil PLC (PMO): 3.99%
. Oil & Natural Gas Corporation Ltd. (ONGC): 3.89%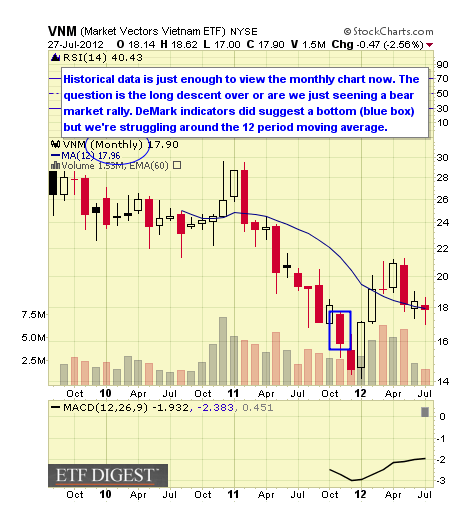
![]()
ITF follows the S&P Tokyo Stock Price Index 150 Index which measures the performance of the 150 most liquid securities from each major market sector listed in Tokyo. The fund was launched in October 2001. The expense ratio is 0.50%. AUM equal $68M and average daily trading volume is 6.4K shares.
As of July 2012 the annual dividend yield was 2.49% and YTD return 1.41%. The one year return was -13.26%.
Data as of June 2012
ITF Top Ten Holdings And Weightings
. Toyota Motor Corp (7203): 6.41%
. Mitsubishi UFJ Financial Group, Inc. (MBFJF): 3.80%
. Honda Motor Co Ltd (7267): 3.10%
. Canon, Inc. (CAJFF): 2.98%
. Sumitomo Mitsui Financial Group Inc (SMFNF): 2.54%
. Mizuho Financial Group Inc (8411): 2.18%
. Nippon Telegraph & Telephone Corp (9432): 2.11%
. Fanuc Corp (6954): 2.10%
. Takeda Pharmaceutical Co., Ltd. (4502): 1.85%
. Mitsubishi Corporation (8058): 1.74%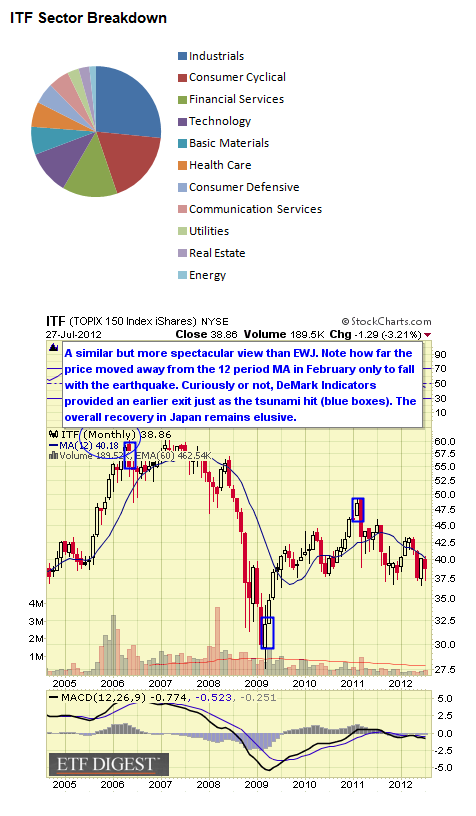
![]()
EWJ follows the MSCI Japan Index which is a proprietary index covering the Japanese equity market. The fund was launched in March 1996. The expense ratio is 0.54%. AUM equal $4.6B and average daily trading volume is 13M shares. As of July 2012 the annual dividend yield was 2.21% and YTD return 0.27%. The one year return was -13.28%.
A competitive issue would be SPDR Russell/Nomura Prime Japan ETF (JPP) with an expense ratio of .50% and AUM of $15 million and average daily trading volume of less than 4K shares.
We rank Japan at the top of the list due to its size and quality of companies within the related index, which for the most part, are multinational companies that are household names.
Also ProShares features leveraged products for hedging and speculating with similar tracking characteristics to EWJ and others.
Data as of June 2012
EWJ Top Ten Holdings And Weightings
. Toyota Motor Corp (7203): 5.33%
. Mitsubishi UFJ Financial Group, Inc. (MBFJF): 2.77%
. Honda Motor Co Ltd (7267): 2.59%
. Canon, Inc. (CAJFF): 2.27%
. Sumitomo Mitsui Financial Group Inc (SMFNF): 1.98%
. Mizuho Financial Group Inc (8411): 1.67%
. Takeda Pharmaceutical Co., Ltd. (4502): 1.65%
. Fanuc Corp (6954): 1.62%
. Mitsubishi Corporation (8058): 1.36%
. SOFTBANK Corp (SFTBF): 1.35%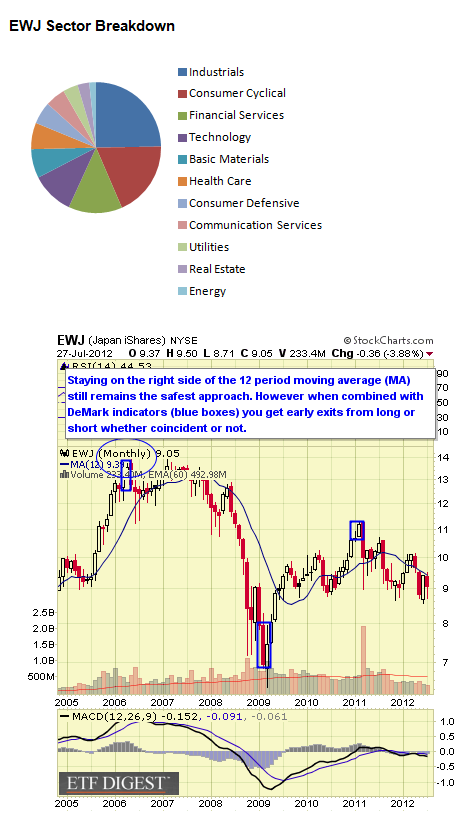
![]()
EPHE follows the MSCI Philippines Investable Market Index which again is a proprietary index covering the broad equity market in the country. The fund was launched in September 2010. The expense ratio is 0.65%. AUM equals $141M and average daily trading volume of 159K shares. As of July 2012 the annual dividend yield was 1.09% and YTD return 27.98%. The one year return was 16.83%.
The Philippines is another resource rich country with mining, agriculture and excellent demographics making the consumer sector more dynamic. Most important, this is the best performing market of the group overall.
Data as of June 2012
EPHE Top Ten Holdings And Weightings
. SM Investments Corp. (SM): 8.61%
. Ayala Land, Inc. (ALI): 6.81%
. Aboitiz Equity Ventures, Inc. (AEV): 6.69%
. Philippine Long Distance Telephone (PHTCF): 6.68%
. SM Prime Holdings, Inc. (SMPH): 5.89%
. Ayala Corp. (AC): 5.10%
. BDO Unibank Inc (BDO): 4.41%
. Aboitiz Power Corp. (AP): 4.33%
. Manila Electric Co. (MER): 4.22%
. International Container Terminal Services Inc (ICT): 3.98%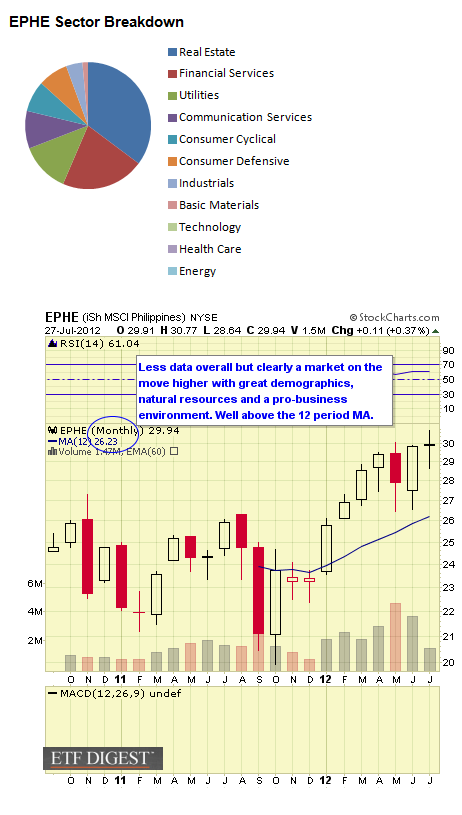
![]()
EWM follows the MSCI Malaysia Index which is a proprietary index follow the equity market of Malaysia. The fund was launched in March 1996. The expense ratio is 0.53%. AUM equal $896M and average daily trading volume is 1.6M shares. As of July 2012 the annual dividend yield was 3.80% and YTD return 8.30%. The one-year return was -0.69%.
Malaysia remains a resource rich country (rubber and palm oil) with excellent demographics indicating a consumer driven economy as well.
Data as of June 2012
EWM Top Ten Holdings And Weightings
. CIMB Group Holdings Bhd. (1023): 9.40%
. Malayan Banking Berhad (1155): 7.76%
. Sime Darby Bhd. (4197): 6.95%
. Genting Bhd (3182): 5.49%
. Tenaga Nasional Berhad (5347): 4.81%
. IOI Corp Bhd (IOIOF): 4.30%
. Petronas Chemicals Group Bhd. (5183): 4.26%
. Public Bank Bhd Foreign Registered (PUBNF): 3.90%
. Maxis Bhd. (6012): 3.74%
. Axiata Group Bhd. (6888): 3.73%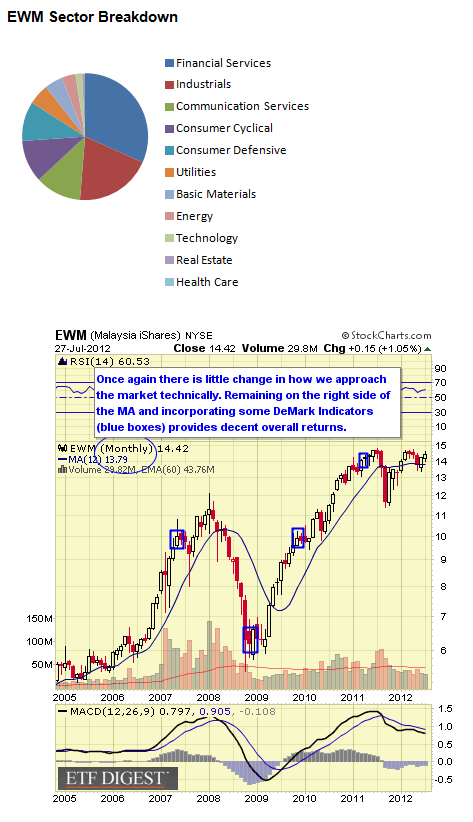
![]()
THD follow the MSCI Thailand Investable Market Index which again is another proprietary index featuring coverage of the overall Thailand equity market. The fund was launched in March 2008. The expense ratio is 0.62%. AUM equal $589M and average daily trading volume is 302K shares. As of July 2012 the annual dividend yield was 2.77% and YTD return 16.46%. The one year return was -0.90%.
Tsunamis and flooding didn't slow the Thai market down much. Once again this is due to excellent demographics and more than an adequate reservoir of natural resources.
Data as of June 2012
THD Top Ten Holdings And Weightings
. Ptt Public Company Limited DR (PUTRF): 9.39%
. Siam Commercial Bank Public Company Limited DR (SMUUF): 7.66%
. PTT Exploration & Production PCL DR (PTTEP-R): 6.38%
. Kasikornbank Public Company, Ltd. (KBANK-F): 6.26%
. Advanced Info Service Public Company Limited (ADVANC-R): 5.53%
. Bangkok Bank PCL (BKKPF): 5.39%
. Cp All Public Company Limited DR (CPALL-R): 5.08%
. Siam Cement Public Company Limited (SCC-F): 4.57%
. Charoen Pokphand Foods PCL DR (CPOUF): 4.00%
. BlackRock Cash Funds Treasury I: 3.60%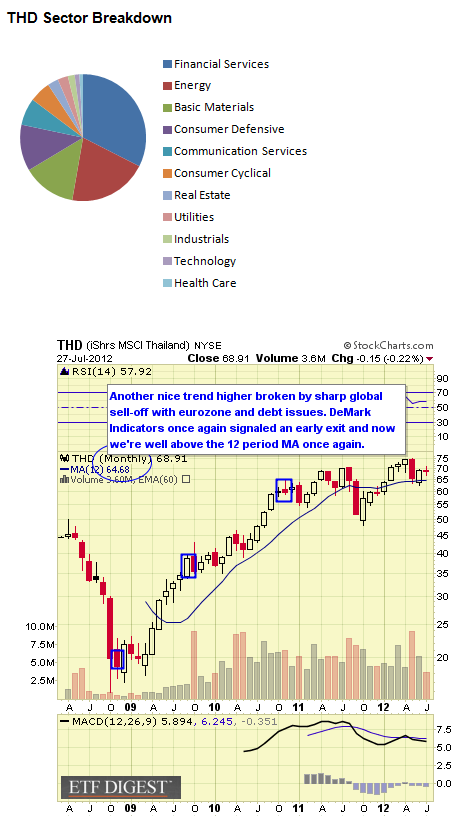
![]()
IDX follows the Market Vectors Indonesia Index which features companies domiciled in Indonesia or earning at least 50% of their revenues from the country. The fund was launched in January 2009. The expense ratio is 0.57%. AUM equal $364M and average daily trading volume is 433K shares. As of July 2012 the annual dividend yield was 1.64% and YTD return 0.18%. The one year return was -14.38%.
Like other countries in the region, Indonesia is rich in natural resources from timber, agriculture mining and energy. The country is also an OPEC member.
Data as of June 2012
IDX Top Ten Holdings And Weightings
. PT Bank Central Asia Tbk (BBCA): 8.23%
. Astra International Tbk (ASII): 8.01%
. P.T. Telekomunikasi Indonesia Tbk. ADR (TLK): 7.44%
. Bank Rakyat Indonesia (Persero) Tbk B (BBRI): 6.90%
. PT Bank Mandiri Persero Tbk (BMRI): 6.70%
. United Tractors Tbk (UNTR): 4.41%
. Perusahaan Gas Negara (Persero) Tbk (PGAS): 3.70%
. Semen Gresik (Persero) Tbk (SMGR): 3.49%
. Golden Agri-Resources Ltd. (E5H): 3.23%
. Indocement Tunggal Prakarsa Tbk (INTP): 3.21%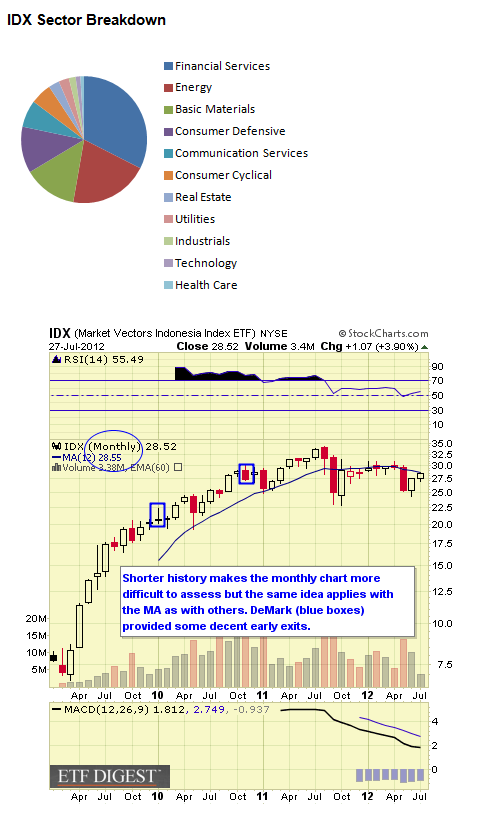
![]()
EWT follows the MSCI Taiwan Index which remains a proprietary index following securities in the general Taiwan equity market. The fund was launched in June 2000. The expense ratio is 0.71%. AUM equal $1.9B and average daily trading volume is 6.2M shares. As of July 2012 the annual dividend yield was 3.52% and YTD return 14.43%. The one year return was -3.94%.
Taiwan markets are considered domestically as a "retail" market making for less institutional activity. One of the primary market drivers is Taiwan Semiconductor and many popular Apple components are made in Taiwan.
Data as of June 2012
EWT Top Ten Holdings And Weightings
. Taiwan Semiconductor Manufacturing (2330): 18.99%
. Hon Hai Precision Ind. Co., Ltd. (2317): 7.19%
. Chunghwa Telecom Co Ltd (2412): 3.09%
. HTC Corporation (2498): 2.85%
. China Steel Corporation (2002): 2.84%
. Formosa Plastics Corporation (1301): 2.78%
. Mediatek Inc. (2454): 2.53%
. Nan Ya Plastics Corporation (1303): 2.22%
. Formosa Chemicals & Fibre Corporation (1326): 2.05%
. Asustek Computer Inc (AKCPF): 1.80%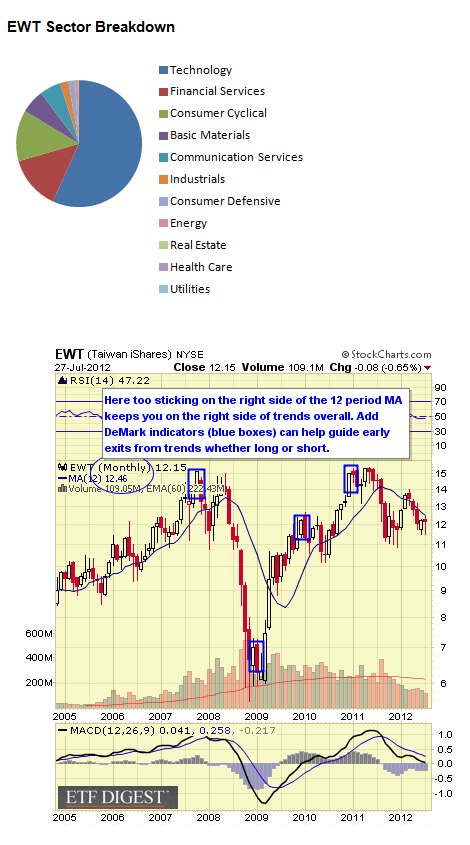
![]()
EWY follows the MSCI South Korea Index which is a proprietary index tracking stocks within the South Korean equity market. The fund was launched in May 2000. The expense ratio is 0.61%. AUM equal $2.4B and average daily trading volume is over 1.9M shares. As of June 2012 the annual dividend yield was 0.72% and YTD return 5.11%. The one year return was -16.11%.
South Korea is no longer really an emerging market in many people's opinion given it's a developing global manufacturing and consumer titan. One reason it's considered still and emerging market is that large ETFs and indexes tied to it would be too disrupted to move it out given nearly a 13% weighting. This situation is a conflict of interest for these funds but EWY is a stand-alone investment. Also note the heavy weightings in Samsung companies which exceed even weightings in Apple in some U.S. tech indexes.
Data as of June 2012
EWY Top Ten Holdings And Weightings
. Samsung Electronics Co Ltd (SSNLF): 21.54%
. Hyundai Motor Co Ltd (005380): 6.47%
. POSCO (005490): 4.07%
. Kia Motors Corp. (000270): 3.41%
. Hyundai Mobis Co., Ltd. (012330): 3.26%
. Shinhan Financial Group Co., Ltd. (055550): 2.92%
. LG Chem Ltd. (051910): 2.35%
. KB Financial Group Inc (105560): 2.30%
. Sk Hynix (000660): 2.28%
. Hyundai Heavy Industries Co., Ltd. (009540): 1.91%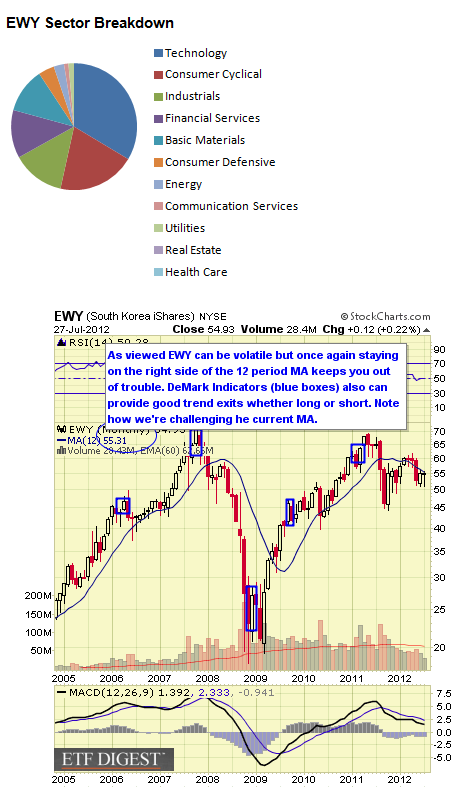
![]()
EWS follows the MSCI Singapore Index which is a proprietary index covering equities in the Singapore equity market. The fund was launched in March 1996. The expense ratio is 0.53%. AUM equal $1.4B and average daily trading volume is 2M shares. As of July 2012 the annual dividend yield was 3.67% and YTD return 23.08%. The one year return was -4.66%.
It's important to remember Singapore is the financial and economic hub for most of Southeast Asia. Its harbor is one of the largest and busiest in the world.
Data as of June 2012
EWS Top Ten Holdings And Weightings
. Singapore Telecommunications Limited (Z74): 11.37%
. DBS Group Holdings Ltd (D05): 10.58%
. United Overseas Bank Ltd. (U11): 10.20%
. Oversea-Chinese Banking Corp Ltd (OVCHF): 9.48%
. Keppel Corp Ltd (KPELF): 6.65%
. Genting Singapore PLC (G13): 4.20%
. Wilmar International Ltd (F34): 3.17%
. CapitaLand Limited (C31): 3.05%
. Jardine Cycle & Carriage Ltd. (C07): 2.81%
. Singapore Airlines Limited (SINGF): 2.77%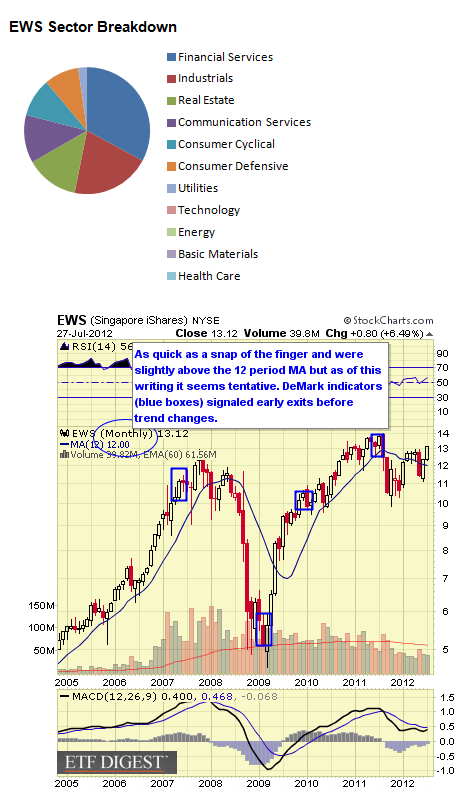
We rank the top 10 ETF by our proprietary stars system as outlined below. However, given that we're sorting these by both short and intermediate issues we have split the rankings as we move from one classification to another.
Strong established linked index
Excellent consistent performance and index tracking
Low fee structure
Strong portfolio suitability
Excellent liquidity
Established linked index even if "enhanced"
Good performance or more volatile if "enhanced" index
Average to higher fee structure
Good portfolio suitability or more active management if "enhanced" index
Decent liquidity
Enhanced or seasoned index
Less consistent performance and more volatile
Fees higher than average
Portfolio suitability would need more active trading
Average to below average liquidity
Index is new
Issue is new and needs seasoning
Fees are high
Portfolio suitability also needs seasoning
Liquidity below average
This area of the world previously known as the Asian Tigers is the most fertile for economic growth and development given youthful populations and high levels of natural resources. Naturally, exports remain a large part of economic activity but down the road internal consumer demand primarily due to excellent demographics can also be expected.
Japan is included within this analysis for convenience. As is well-known Japan has significant debt problems and an aging population. Nevertheless many companies in the country are multinational with manufacturing and divisions in other parts of the world which can offset domestic concerns.
Negative spillover from the eurozone problems and perhaps a contraction in China may slow bullish returns.
Disclosure: The ETF Digest has LONG positions in EWS, IDX AND EWM.
(Source for data is from ETF sponsors and various ETF data providers.)
- English (UK)
- English (India)
- English (Canada)
- English (Australia)
- English (South Africa)
- English (Philippines)
- English (Nigeria)
- Deutsch
- Español (España)
- Español (México)
- Français
- Italiano
- Nederlands
- Português (Portugal)
- Polski
- Português (Brasil)
- Русский
- Türkçe
- العربية
- Ελληνικά
- Svenska
- Suomi
- עברית
- 日本語
- 한국어
- 简体中文
- 繁體中文
- Bahasa Indonesia
- Bahasa Melayu
- ไทย
- Tiếng Việt
- हिंदी
Top 10 Asian Tiger ETFs
3rd party Ad. Not an offer or recommendation by Investing.com. See disclosure here or
remove ads
.
Latest comments
Install Our App
Risk Disclosure: Trading in financial instruments and/or cryptocurrencies involves high risks including the risk of losing some, or all, of your investment amount, and may not be suitable for all investors. Prices of cryptocurrencies are extremely volatile and may be affected by external factors such as financial, regulatory or political events. Trading on margin increases the financial risks.
Before deciding to trade in financial instrument or cryptocurrencies you should be fully informed of the risks and costs associated with trading the financial markets, carefully consider your investment objectives, level of experience, and risk appetite, and seek professional advice where needed.
Fusion Media would like to remind you that the data contained in this website is not necessarily real-time nor accurate. The data and prices on the website are not necessarily provided by any market or exchange, but may be provided by market makers, and so prices may not be accurate and may differ from the actual price at any given market, meaning prices are indicative and not appropriate for trading purposes. Fusion Media and any provider of the data contained in this website will not accept liability for any loss or damage as a result of your trading, or your reliance on the information contained within this website.
It is prohibited to use, store, reproduce, display, modify, transmit or distribute the data contained in this website without the explicit prior written permission of Fusion Media and/or the data provider. All intellectual property rights are reserved by the providers and/or the exchange providing the data contained in this website.
Fusion Media may be compensated by the advertisers that appear on the website, based on your interaction with the advertisements or advertisers.
© 2007-2024 - Fusion Media Limited. All Rights Reserved.
