The Bretton Woods system was intentionally set up to funnel monetary convertibility through official channels. The primary characteristic of any true gold standard is that any person who wishes can change paper claims into hard money. It was as much true in any one country as between those bound by the same legal framework (property). What might differ were the standards for satisfying those claims (“good delivery” wasn’t a uniform idea, which is why gold swaps first arose), but overall people could access gold on an individual basis.
Blaming the people for the Great Depression, economists saw no need to replicate the error (as they saw it). Thus, gold would be maintained as the primary monetary basis worldwide but would be subject to it in a very narrow context. Central banks would do the converting, meaning that if you were a bank in Germany who came into possession of dollars your recourse was Bundesbank rather than Morgan Guarantee.
This unintentionally alleviated the private merchant market for global trade of a great deal of risk. That risk didn’t disappear, it was merely transferred to the public sector where astute and enlightened economists were thought dispassionately equipped to properly handle it. John Maynard Keynes, one of the primary architects of Bretton Woods, was convinced this was the case.
If that was so, the Bretton Woods standard only lasted a little more than a decade before the “cheating” began. The formation of the London Gold Pool in late 1960 was by the standards of gold a default event. Policymakers were simply unprepared for the technological changes of that era which spilled over into evolving monetary arrangements. A modernizing world yearned for the flow of capital, even if the private side were to have to invent it.
After the formation of the London Gold Pool, it became rather common for foreign central banks to circumvent the rules of Bretton Woods in other ways. Many nations in order to keep their currencies pegged were given statutory standards that would trigger convertibility of either sterling (the earlier years) or dollars (especially after 1955).
If private banks in a particular nation, primarily Europe, were to accumulate dollar balances and seek protection (inflation risk) from them, they would convert them into local currency at a fixed rate with their central bank. That central bank now in possession of dollars would, if above that threshold, normally obtain U.S. gold but increasingly went in another direction.
From the FOMC Memorandum of Discussion for their November 1962 policy meeting:
Furthermore, the forward operations of the Treasury and, to a much smaller extent, the System swap arrangements have enabled some countries to convert straight dollar holdings into holdings protected by an exchange value guarantee. During the first nine months of this year, more than $600 million were thus converted by continental European countries. While the eight major continental European countries statistically increased their dollar holdings by $150 million, they actually reduced their uncovered holdings by $450 million. Only Austria, France, and Sweden accumulated any significant amounts of uncovered dollars; and Austria has meanwhile converted its entire accrual into gold or guaranteed dollars, while France continually converts dollars into gold and presumably intends to use the rest of its accruals for further debt prepayments. Only Sweden among all European countries apparently still adheres to the policy of keeping the bulk of its very modest reserves in straight dollars. [emphasis added]
U.S. officials were, by their self-imposed ignorance, painted into a corner. They could either let their central bank counterparties claim more U.S. gold and threaten the nation’s gold stocks that much more, or they could in a swap arrangement take on the currency risk while allowing their foreign central bank counterparty to duplicitously remove their dollar balance from their books (thus satisfying local statutes about holding dollars).
You see, under the swap arrangement the U.S. Federal Reserve or more so the U.S. Treasury did not repossess the dollars; they merely guaranteed a price for them so that the other central bank would continue to hold them. But because that other central bank could not legally do so, alleviated of currency risk it simply disposed of them by another means; the eurodollar market.
If there will forever be a mystery as to where eurodollars came from, there is none as to how during especially the 1960’s it grew so large and systemically important. It was aided at every step by central banks, including the Federal Reserve that was increasingly desperate under Bretton Woods. The eurodollar thus became the noose for the gold system, as each time the swaps were arranged that meant more dollars in offshore places which would then threaten U.S. gold, and so on.
It wasn’t until the late 1960’s, really 1969, that U.S. monetary officials started to take it seriously. Before then it was a quirk of current account math, but one misunderstood contributor among several for Triffin’s so-called Paradox. From the FOMC in February 1969:
Mr. Brimmer asked whether there were any techniques available to the desk to take explicit account of Euro-dollar inflows, or whether the Desk necessarily looked only to the total availability of reserves in its operations. He was concerned that access to the Euro-dollar market might leave a few large banks relatively free of the impact of monetary restraint. Mr. Holmes replied that the Desk had no selective means of influencing the behavior of banks that could draw funds from the Euro-dollar market. However, the Desk recognized that Euro-dollar flows could have an important influence on total bank credit, and they were taken into consideration in connection. [emphasis added]
At that particular moment, the eurodollar market was concentrated largely in either Europe or the Caribbean. Banks in the latter would set up essentially fake offices with nothing but a nameplate and telephone line, usually a direct one straight to whatever bank’s NYC funding desk. There were other eurodollar centers, to be sure, including Montreal and Tokyo, but offshore was a little more literal in those days.
We don’t have a whole lot of statistics that can tell us just how much the eurodollar market was then, and even less how much it was during its “golden” age in the middle 2000’s. What statistics do exist are incomplete or meant for other designs, and therefore create a dilemma for interpretation. We have to be careful in making judgments and drawing conclusions with these stark limitations in mind.
One such data set that is for its own purposes both legitimate and thorough is the Treasury International Capital (TIC) report. Most people know it exclusively for the figures estimating how many U.S. Treasury securities are held by whom outside the United States. TIC is, however, far more detailed and contains an extensive database on cross-border dollar flows drawn from balances provided by U.S. banks – both dollars extended by then and other domestic firms to foreign counterparties as well as those obtained from the foreign sector by U.S. financial agents.
I have referred to these statistics before and they validate a lot our explanation of the principal factor troubling the last decade and what is surely a “dollar shortage.” In this narrower data set, what it shows is that cross-border dollar flow is in both directions severely constrained and stunted; a clean break that goes back to late 2007 and really Bear Stearns in March 2008. We also find a small recovery post-crisis that only survived until May 2011, the total systemic breakdown.
There could be several reasons why cross-border flow might be this way in sharp contrast to before 2008, but the statistics themselves leave little doubt at least as far as who is behind the contraction of dollar flow. It is unequivocally the banking system both here and abroad that is shying away from the dollar business, meaning the creation as well as redistribution of “dollar” resources (I include the quotation marks here as a nod to the full extent of what is going on in eurodollar spaces, meaning that while TIC tracks the more traditional dollar instruments like time deposits and repo collateral it does not, maybe cannot, identify the more esoteric stuff like FX that do hold some relationship on the statistics that are included here).
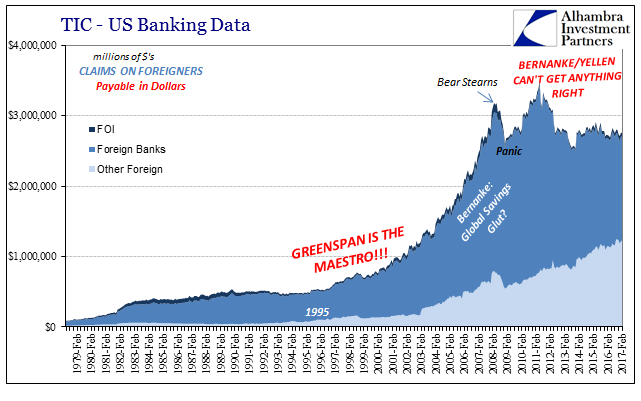
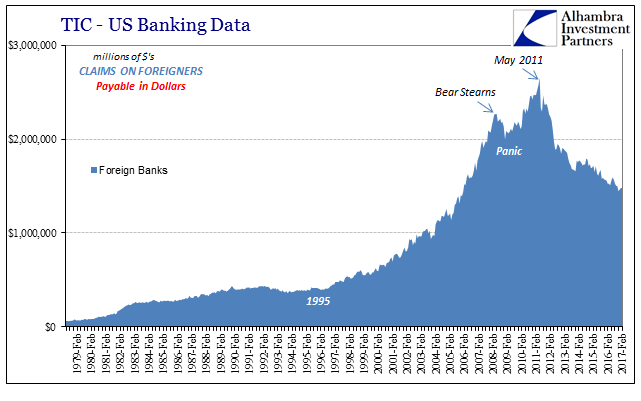
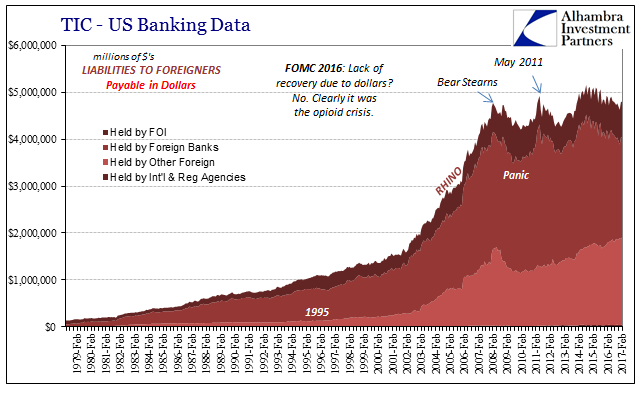
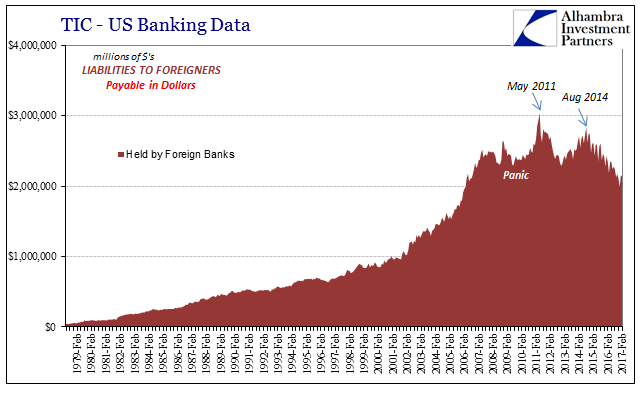
On both sides, inbound dollars as well as those outbound, the decay in flow is almost exclusively due to the banking sector. In the foreign spaces, a very small part of that retreat has been offset by central banks in what is commonly known as selling Treasuries. Overall, however, it is nowhere near the scale of resources that would put the global monetary system back on a sustainable basis.
There are two important parts to understanding the eurdollar system – what and who. The status of banks shown above give us a sense of “what”, meaning bank balance sheet capacity and in those various forms way beyond the traditional definitions of dollars (those things not picked up by TIC but are witnessed in “strange” market fluctuations and prices; CIP, for one). That established, defining “who” adds needed clarity.
The TIC data provides a further breakdown by country, though again with the same caveat over its incomplete reach. These figures only go back to February 2003, but that is sufficient for these purposes, for what we are really after are the post-crisis interpretations. By this count, U.S. financials had by May 2011 accumulated dollar claims on Caribbean institutions totaling just less than $1.2 trillion. What is interesting is not just the size but more so the pattern; there was barely any detectible interruption of offshore flow during the panic. In fact, at the start of 2008 there was a higher than normal season flow to those firms domiciled in warm Atlantic waters. It was only in the middle of 2011 that “something” completely changed:
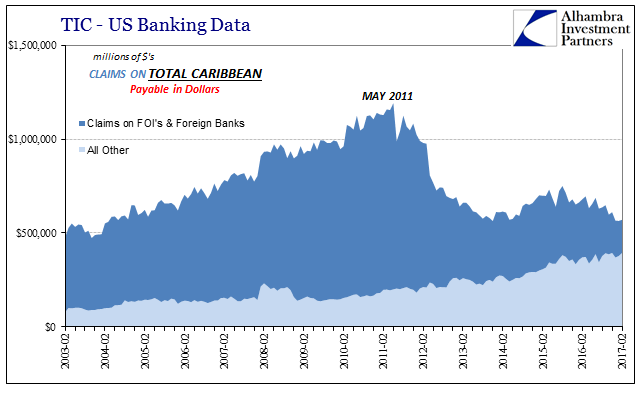
There are those who have suggested that the U.S. government’s crackdown on offshore tax avoidance could be in some good part to blame, but FACTA, for example, took effect on July 1, 2014, and dollar flow to the various Caribbean shelters was at that time rising (and somewhat sharply) yet again. It abruptly halted, importantly, in August 2015 for reasons that neither relate to tax regulation nor need further explanation.
The fact that the 2011 crisis was more European than anything helps us explain why it was so devastating to the “dollar” system rather than solely the euro. European banks had made a particular habit of funding “dollars” from these centers, meaning that Caribbean banks in 2011 operated largely as they had in 1969 – a point of outbound dollar redistribution from the U.S. to the rest of the world, including European banks that had long-established relationships in the islands.
The PIIGS fiasco meant that European banks were by and large the only suspect institutions, further meaning that U.S. dollar holders were increasingly unwilling to lend dollars to them. In official channels, money market funds withdrew heavily from European borrowers and what we find here is a parallel but largely unseen retrenchment in the offshore redistribution centers.
This inflection for 2011 was, obviously, the second such drastically negative re-evaluation. Starting after the main events of 2008, European banks themselves had already begun their systemic “dollar” retreat, as both users of funds (participation in the housing bubble) as well as redistribution activities (like Swiss banks).
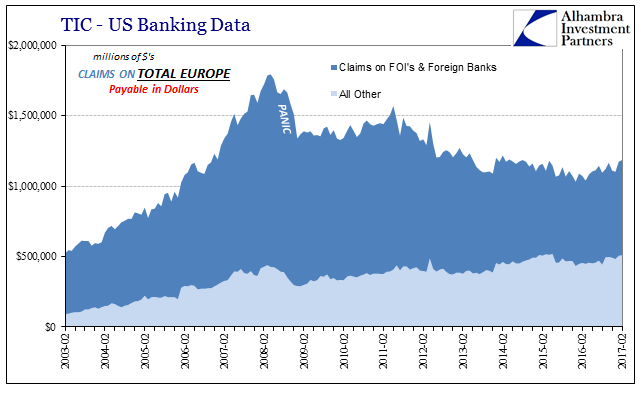
Thus, one of the largest users of “dollar” funding as well as, relatedly, one of the primary points of reallocation were both by May 2011 fully aligned in retreat. It was therefore little wonder why the 2011 event seemed the final straw, because in many ways it was for the bulk of the cross-border flow, and thus by inference the “dollar” system.
But as participants in these areas were moving out, institutions in other places were moving in. Panic or not, there were participants who for their own circumstances saw the opportunity of at least replacing some of the lost capacity. The slack taken up by them was, like foreign central banks, nowhere near enough to offset the loss of resources everywhere else, but certainly enough to make for a more gentle decay than might otherwise have been after 2011. This transformation is also vital to understanding especially the latest leg in the “dollar’s” downward journey.
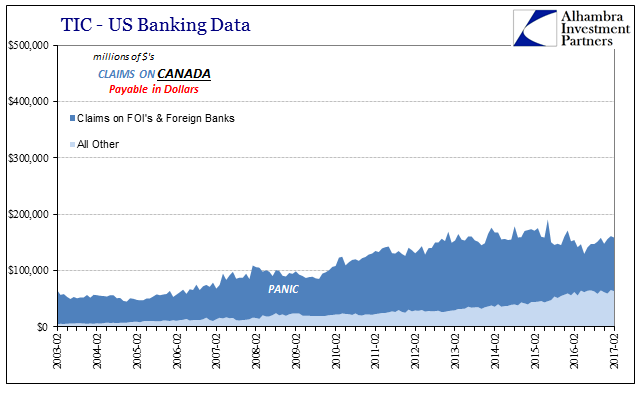
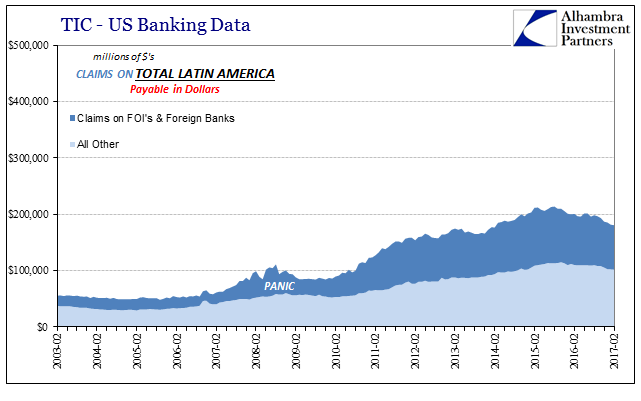
While outbound balances continued to rise (until the “rising dollar”) for places Canada and Latin America, those two regions are of opposite ends of the spectrum. The former as in the 1960’s as a money redistribution center, while the latter, especially Brazil, as a user of funds to participate on global trade rather than financial markets. Thus, the Latin American nations were far more economically susceptible to interruptions of domestics (pictured here) flow as well as foreign on foreign (not pictured, or ever recorded).
Primarily, however, the eurodollar at the margins turned more toward an Asian “dollar.”
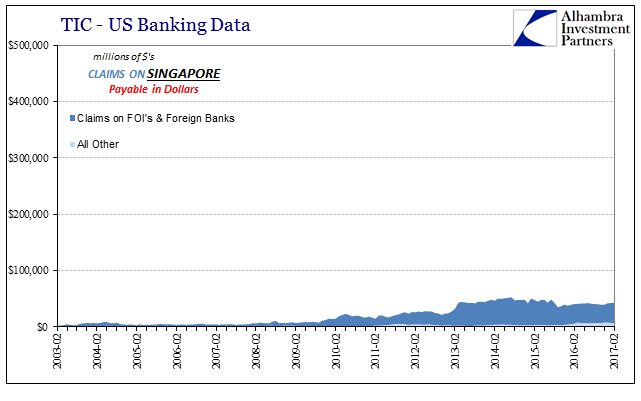
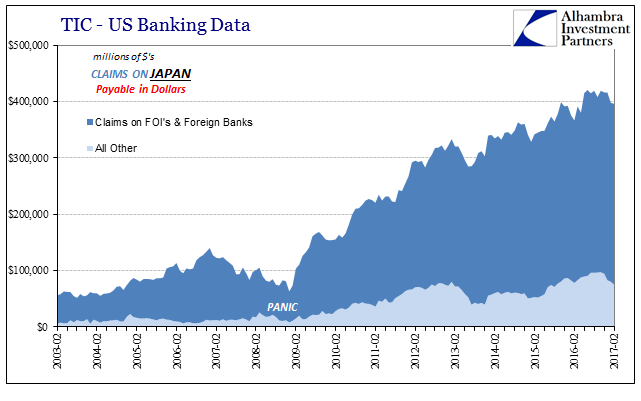
Japan’s role hasn’t changed, either. They are not borrowing dollars post-crisis because that country’s monetary policy success has delivered a roaring economy in desperate need of funding. Quite the contrary, Japan’s indicated dollar presence is as a result of its further QE (and QQE) failure. Unlike American or European banks, Japanese banks though heavily “short” dollars did not require extensive balance sheet de-risking as their global counterparts; they did that starting twenty years ago. Japanese balance sheets were by comparison pristine.
The yen created by the Bank of Japan starting in late 2008 with its QE3 (up to what could be QE12 as the latest, perhaps QE23 by alternate definitions) gave Japanese banks unlimited monetary resources which they could use to plug in to dollar redistribution in place of Europe and then the Caribbean.
Paying at first only a slight premium for these dollars (really “dollars”), the Japanese version would have to be heavier in the FX dimensions in order to accomplish what central banks did in the 1960’s (a basis swap is free of exchange risk, a sort of mutually agreed forward cover). Thus, as the eurodollar system continued to shrink, it also became, especially at the margins, more Asian as well as derivative.
It also pinpoints a little closer the Chinese dollar problem, for China’s banks clearly don’t get their dollars from direct U.S. financing (below; not that this is surprising). As a user of funds, unlike Singapore whose banks are Eastern redistribution points, the trajectory of Asian dollar expansion has been a big problem, especially absent any capacity in the other parts to take up this latest decay.
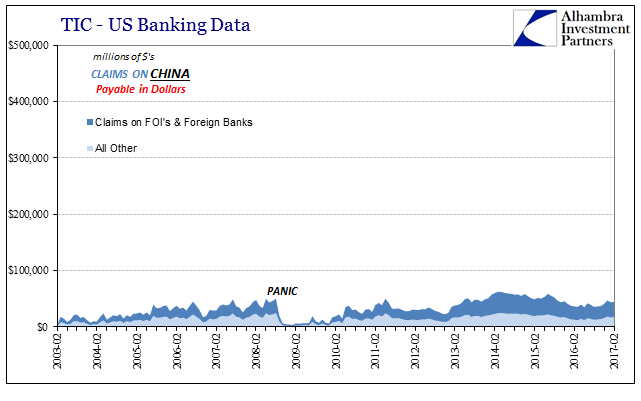
It really means that we can divide the last ten years into three (largely) distinct phases. The first (2007-09) was the eurodollar in Europe; the second, the eurodollar redistributed toward Europe, and then elsewhere, through the Caribbean; the third, marginally far more Asian with Chinese demand at the center of mainly Japanese sourcing. It is why the “rising dollar” hit especially Asia and Latin America very hard relative to the Great “Recession” which was relatively more disruptive here and in Europe (and Japan).
To reiterate, these data points are incomplete and so the TIC figures are not the sole basis for the deductions in the paragraph above but merely as further corroborating other indications and data (and perhaps telling the story more clearly and concisely). It might also propose why the global economy after 2015-16 has failed to rebound even as much as it did following 2012, and nothing like 2009-10. If we think of the eurodollar system under the “who” part as being supported by three pillars at the margins, the first (Europe) was knocked out after 2008, the second (Caribbean) after 2011, and third (EM uses, Japan sources) as a result of the “rising dollar.” These events so far appear to be permanent concession rather than temporary retreat.
Does that mean we are now are pulled to the precipice of total collapse? Not necessarily, for remember that the “what” part of the decay is almost exclusively of the banking sections. The system has shown remarkable ability to muddle through at least in reduced capacity without repeating the worst dynamics of the panic (though I think that more dumb luck than a signal of latent robustness; with all the excess having long ago been purged there isn’t the kind of violent recoil that would precipitate another full-blown, globally condense withdrawal).
Though banking remains the vast majority, there are other ways in which that segment can be partially offset again (the ubiquitous and large “other” category that you often find in these kinds of accounting attempts). My analogy has been to use a noose, which I still believe is appropriate. Every time one of these channels gets knocked out, the noose is pulled that much tighter, which may or may not be so tight as to induce the terminal phase. For those who actually knew what they were talking about with regard to 2a7 (rather than the hysterics that came to populate the mainstream’s sudden and quite temporary infatuation with it), it was a seemingly positive sign that the “other” parts of the dollar system did not lead directly to another Lehman moment.
I still think that is the wrong standard by which to judge the eurodollar system. It is instead indicative of what is surely a worse case, the worst case; because we avoided another 2008 last year is no cause for celebration, as the only benchmark that should matter is a globally thriving economy which the lack of catastrophic collapse actually pushes further into the future through reduced urgency to see the system as in dire need of radical overhaul right now. Very few parts of it are left to support any little growth, let alone a badly needed burst of huge momentum.
It may be the perfect bookend to the eurodollar’s birth and arrival. It came out of nowhere and for more than a decade worked behind the scenes far apart from official understanding in order to propel the global system forward (and into vast inflation, first consumer prices then asset). Now, it withers but with equal obscurity far from public and official view. The effects were then, and are now even if it can’t be fully grasped yet, epic.
