The past few trading sessions have been marked with significant spikes in Agricultural prices that have noticeably rippled through related ETPs, such as the benchmark PowerShares DB Agriculture (NYSE:DBA) (Expense Ratio 0.85%).
At the time of our late May piece on the space, DBA was trading in the high $19’s, and the fund continued to dip all the way below $19, before suddenly shooting up as high as $20.30 in intraday trading just yesterday (before today’s more than 1% sell-off in the space).
A Bloomberg.com article titled “Food Prices Near 2-Year High Thanks to a Record Surge in Butter and Wheat” illustrates what has been occurring in the space rather well and points out Mother Nature’s recent role in rising “Ag” prices. Wheat prices specifically have been driven by drought conditions, and one can see the sudden move higher in Wheat linked ETF Teucrium Wheat (NYSE:WEAT) (Expense 1.00$, $81 million in AUM), which has moved above $8 after trading at $7 just seven trading sessions ago.
DBA presently has its highest weighting in Live Cattle (15.90%) and its second highest weighting is in Wheat (14.30%), so the fund has clearly benefited from what we have spoken about here in terms of rising prices in the group. The Bloomberg article further states “Limited export availability in the dairy market has made products including butter and cheese more expensive.”
The month of June saw net price changes that in some cases were a record, such as the 14% leap in Butter prices in one month. Bloomberg notes that Meat prices spiked 1.8% and up for the sixth straight month, while Grain prices moved more than 4% higher during this time frame.
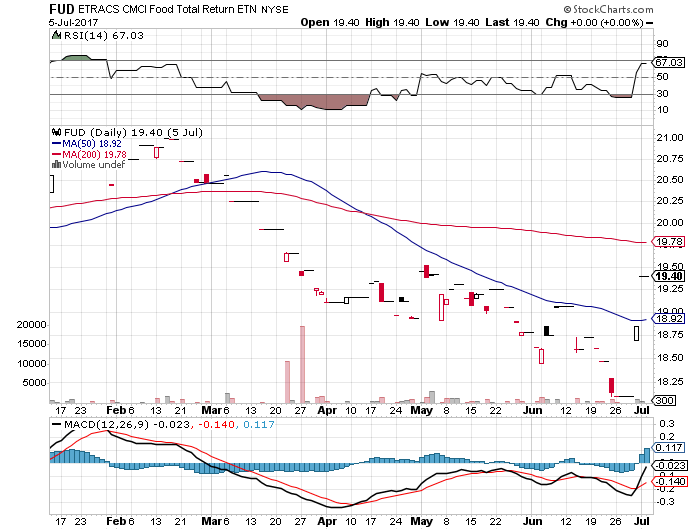
All of this talk about “Food” has us looking at an obscure but useful ETP known as ETRACS CMCI Food Total Return (NYSE:FUD) (Expense Ratio 0.65%, $5.3 million in AUM). FUD only averages about 500-600 shares traded daily and seems to fly unnoticed on most radars. On some days it doesn’t even trade at all, but it is the only “Food” oriented commodity product in the greater Agriculture landscape.
Fund literature states that “The Index measures that collateralized returns from a basket of 11 futures contracts from the agricultural and livestock sectors.” Currently the highest weightings in the fund are as follows: 1) Soybeans (19.62%), 2) Sugar (15.01%), 3) Corn (14.69%), 4) Live Cattle (7.80%) and 5) Soybean Meal (6.63%).

FUD was trading at $19.40 per share on Thursday morning, up $0.55 (+2.92%). Year-to-date, FUD has declined -1.92%, versus a 8.13% rise in the benchmark S&P 500 index during the same period.
FUD currently has an ETF Daily News SMART Grade of C (Neutral), and is ranked #77 of 130 ETFs in the Commodity ETFs category.
