
Tiffany & Co. (NYSE:TIF) posted fourth-quarter fiscal 2019 results. During the quarter, both earnings and sales improved year over year and the bottom line beat the Zacks Consensus Estimate. Notably, sales improved in most regions, apart from Japan. Also, disruptions in Hong Kong weighed on Asia-Pacific sales to an extent, though it was compensated by strength in the Chinese Mainland.
Tiffany’s fiscal 2019 show reflected a positive impact of product introductions. To this end, it remains encouraged with the product additions made to the men’s category. Also, the company is enhancing its Tiffany T collection. These efforts along with a focus on store expansions have been bolstering its performance. However, the COVID-19 outbreak has caused the retailer to undertake store closures or limit hours of operations in some stores. This, in fact, has largely dented the company’s operations in the Chinese Mainland region.
Well, management did not provide any business guidance due to its pending transaction with LVMH Moet Hennessy - Louis Vuitton SE (or LVMH). Shares of this Zacks Rank #4 (Sell) company have lost 5.6% in the past three months compared with the industry’s decline of 17.5%.
Q4 Highlights
The company posted adjusted earnings of $1.80 per share that cruised ahead of the Zacks Consensus Estimate of $1.72. In the year-ago period, the company’s adjusted earnings came in at $1.60 per share. Including costs related to the proposed takeover by LVMH, Tiffany reported fourth-quarter fiscal 2019 earnings of $1.66 per share compared with $1.67 reported in the year-ago period. Lower gross margin, increased SG&A expenses and higher effective tax rate could be accountable for the decline.
Tiffany & Co. Price, Consensus and EPS Surprise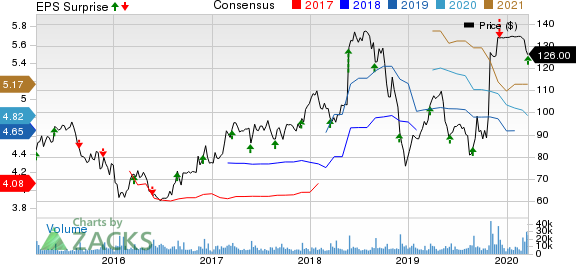
Tiffany & Co. price-consensus-eps-surprise-chart | Tiffany & Co. Quote
Net sales rose 3% to $1,357.8 million compared with the Zacks Consensus Estimate of $1,360 million. Also, the company’s comparable sales (comps) grew 3% year over year. At constant currency, both metrics rose 3% each. Further, excluding the Hong Kong market, worldwide net sales and comps grew 5% each.
Sales improved 6% and 2% for Jewelry collections and Engagement jewelry, respectively, while Designer jewelry sales remained flat year over year.
Let’s Delve Deeper
Geography-wise, sales in the Americas rose 4% to $640 million and comps grew 3%. The company witnessed higher sales across most parts of the region, courtesy of higher spending by loyal customers.
In the Asia-Pacific region, sales grew 8% to $342 million, while comps rose 7%. This was attributable to improved wholesale sales. Further, sales remained sturdy in the Chinese Mainland, partly offset by strong disruptions in Hong Kong. Also, increased spending by local customers was somewhat countered by soft spending by foreign tourists.
In Japan, sales decreased 8% to $180 million and comps declined at the same rate. Sales were hurt by customers’ response to the increase in consumption tax imposed on Oct 1, 2019.
In Europe, sales advanced 4% to $168 million, with comps growing 5%. Sales were boosted by growth across most parts of the region on higher spending by local as well as foreign customers. Other net sales declined 9% to $26 million due to soft wholesale sales of diamonds, while comps rose 11%.
Gross margin contracted 50 basis points to 63.3% in the quarter under review, on account of changes in sales mix toward higher price point jewelry.
SG&A expenses rose 3% to $590.4 million primarily due to increased merger-related costs, greater labor and incentive compensation expenses, and higher store occupancy and depreciation charges, somewhat negated by lower marketing spending. Excluding merger-related costs, SG&A costs dipped 1% in the quarter.
Store Update
During the fiscal, this designer and retailer of fine jewelry opened nine company-operated stores and shuttered four. As of Jan 31, 2020, the company operated 326 stores (124 in the Americas, 91 in Asia-Pacific, 58 in Japan, 48 in Europe and five in the UAE).
Other Financial Details
Tiffany, which shares space with Signet (NYSE:SIG) , ended the quarter with cash, cash equivalents and short-term investments of $897.4 million and total debt of $1 billion, reflecting 31% of stockholders’ equity.
In fiscal 2019, the company repurchased roughly 1.8 million shares for $163.4 million. Tiffany did not make any buybacks in the fourth quarter owing to restrictions described in the merger agreement with LVMH.
2 Stocks You Can’t Miss
Macy’s (NYSE:M) has a long-term earnings growth rate of 12% and a Zacks Rank #1 (Strong Buy). You can see the complete list of today’s Zacks #1 Rank stocks here.
Costco (NASDAQ:COST) has a long-term earnings growth rate of 8.4% and a Zacks Rank #2 (Buy).
Today's Best Stocks from Zacks
Would you like to see the updated picks from our best market-beating strategies? From 2017 through 2019, while the S&P 500 gained and impressive +53.6%, five of our strategies returned +65.8%, +97.1%, +118.0%, +175.7% and even +186.7%.
This outperformance has not just been a recent phenomenon. From 2000 – 2019, while the S&P averaged +6.0% per year, our top strategies averaged up to +54.7% per year.
See their latest picks free >>
Tiffany & Co. (TIF): Free Stock Analysis Report
Costco Wholesale Corporation (COST): Free Stock Analysis Report
Signet Jewelers Limited (SIG): Free Stock Analysis Report
Macy's, Inc. (M): Free Stock Analysis Report
Original post
Zacks Investment Research