The nature-nurture debate may be one of the most popular battles in psychology. In financial markets? One can make the case for an octagon match between “value” and “momentum.”
Value-oriented investors tend to pursue bargains. They look at price-to-earnings (P/E), price-to-book (P/B) and price to-sales (P/S) ratios. They evaluate cash on corporate books after capital investments – a metric known as free cash flow. And when value investors worry about a firm or an industry’s financial well-being, they look at debt levels.
Momentum-minded men and women often keep things simpler. Is a security rising in price at a faster rate than a comparable asset? If so, it may be more likely to continue moving at an accelerated pace for the foreseeable future. And when might a change in price direction occur? It might take place in conjunction with price deceleration and/or trendline breaches – trendlines that are derived from simple moving averages or exponential moving averages.
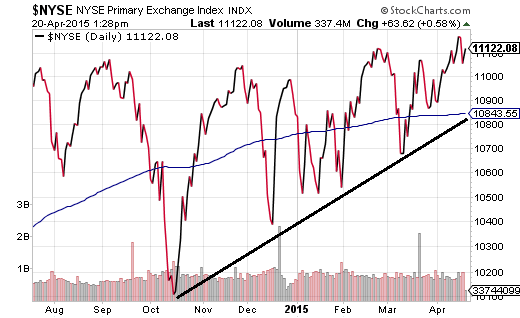
In the current bull market, nearly all valuation metrics suggest that U.S. stocks are extremely expensive. On the other hand, most technical trends emanating from price movement are decidedly favorable for believers in the rally’s “legs.” It follows that, even though the median stock in the NYSE Composite is sporting the highest P/E and P/S ratios ever recorded, the momentum-based community has not been deterred from a pursuit of portfolio gains. Support for momentum-based price movement can be seen in the “higher lows” achieved since October. Additionally, the current price of the index currently resides well above a long-term trendline.

It may be extremely difficult to unearth genuine bargains in the late stage bull for U.S. equities. Nevertheless, foreign and global stock ETFs may be less expensive on a relative basis. What’s more, several of them are demonstrating near-term relative strength when compared to the entire universe of stock ETF possibilities.
Here are three that you might find worthy of additional investigation:
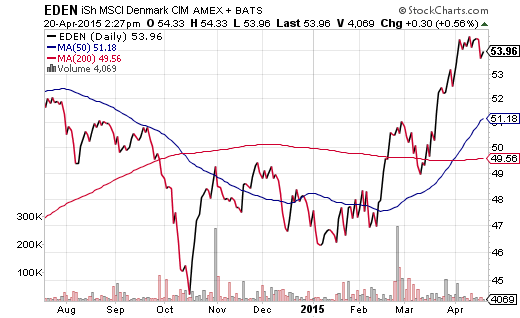
1. iShares MSCI Denmark Capped (NYSE:EDEN). Nothing is rotten or rotting in the state of Denmark at this moment. This exchange-traded tracker pursues the investment results of an index comprised of Danish stocks. The forward P/E at 17 is slightly less expensive than the U.S. forward estimate of 17.6. Granted, relative value for EDEN is not the big reason for its interest; rather, the Danish central bank cut its benchmark rate twice in January alone, placing the overnight lending rate into negative territory ( -0.35%). The ridiculously easy money policy and policy direction has kept the Danish currency (krona) weak like the euro. The chief benefit? The export-dependent nation can remain quite competitive. Indeed, as recently as mid-March, the central bank upgraded Denmark’s GDP full-year growth outlook. (Compare that to lowered expectations for the U.S. and a wide variety of foreign countries that have yet to escape stagnation.)
Technical analysts might also be impressed by the most recent data on fund flows. EDEN had the largest percentage increase in inflows (40%) of any fund during the month of March.

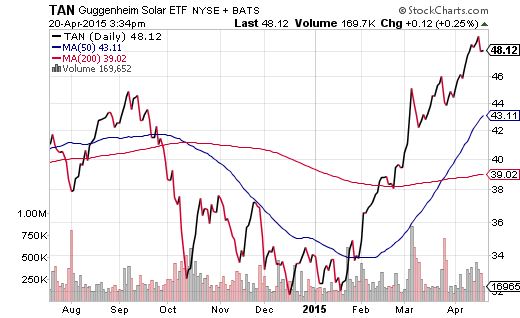
2. Guggenheim Invest Solar (ARCA:TAN). When oil hit its slick spot in 2014, the lower cost for crude decreased the demand for alternatives like solar. With oil prices appearing to have bottomed out in December-January, however, global solar providers bounced back in dramatic fashion. Not only has TAN risen from the ashes at a lightning quick pace, but it boasts a trailing P/E (13.6) and a trailing P/B (1.8) that just may be the envy of broader U.S. benchmarks.
Reasonable valuations? Check. What about relative strength? Three months ago, TAN found itself stuck in the bottom 10% of all assets in the ETF universe. Today, it registers in the top 2%. A 50% meteoric jump off its January bottom has confirmation from a “golden cross” – a bullish signal derived from an asset’s 50-day moving average crossing above its 200-day.

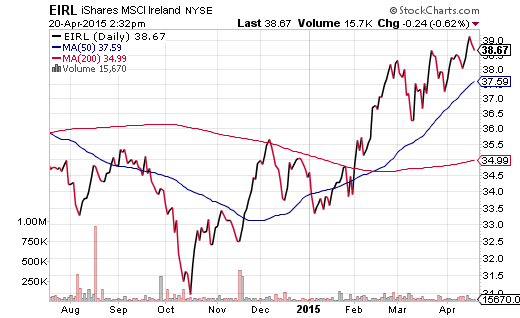
3. iShares MSCI Ireland (NYSE:EIRL). Like Denmark, EIRL is difficult to justify on the basis of investor-friendly valuations. The P/B for EIRL at 2.4 may be 17.5% cheaper than the iShares S&P 500 (IVV). Nevertheless, the real luck of the Irish may be reflected in the country’s upbeat economic outlook. According to euro-zone economists, Ireland will ride its export boom to the top of the growth charts; gross domestic product (GDP) should outperform Germany (1.5%) and Britain (2.4%) in 2015. With the euro exceptionally weak and oil dramatically lower, Ireland’s exporting of pharmaceuticals (e.g., Viagra, Botox, etc.) and organic chemicals give this exchange-traded fund most of its pop.
It is true that a consumer sentiment survey hit a 9-year high in January. That may be attributable to rising property prices, low inflation, recent tax reforms and the “de facto” tax cut associated with cheaper oil. Yet investors who frown upon high unemployment and monstrous government spending – debt-to-GDP in Ireland is 115% – may want to think twice. Others might simply embrace the remarkable relative strength and resilience of EIRL since the October lows.

Disclaimer: Gary Gordon, MS, CFP is the president of Pacific Park Financial, Inc., a Registered Investment Adviser with the SEC. Gary Gordon, Pacific Park Financial, Inc, and/or its clients may hold positions in the ETFs, mutual funds, and/or any investment asset mentioned above. The commentary does not constitute individualized investment advice. The opinions offered herein are not personalized recommendations to buy, sell or hold securities. At times, issuers of exchange-traded products compensate Pacific Park Financial, Inc. or its subsidiaries for advertising at the ETF Expert web site. ETF Expert content is created independently of any advertising relationships.
