After a three-day pummelling of the market leaders that appeared to be triggered by the combination of extreme overbought conditions, excessive speculation, exuberant optimism and some options/vol trades unwinding, traders got a bounce on Wednesday. And while it looked like the bounce had some legs in the early going Thursday, the rally quickly failed and sellers returned. As such, investors went home Thursday more than a little concerned.
The question was: IsThursday's drubbing the end of the selling or a sign that the correction has further to run? Obviously, we can't know the answer in advance. But I have learned over the years that we can look around for clues that could suggest the potential outcome.
In looking at a chart of the S&P 500, there are a couple items to note.
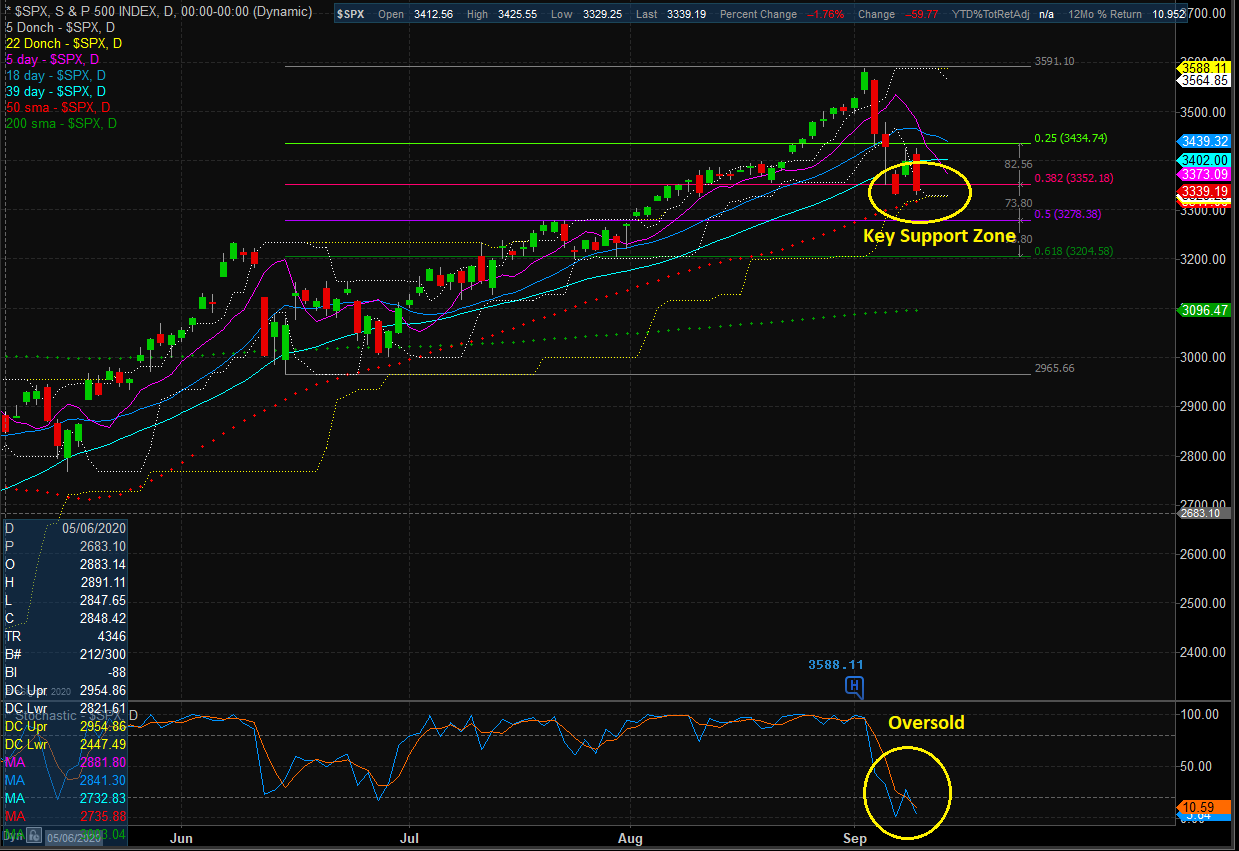
S&P 500 – Daily

First, in the lower clip of the chart, we can see that the index is now oversold. While this doesn't necessarily give the bulls an edge, my view is the oversold condition removes an edge of the bear camp's side of the ledger.
Next up is the question of support on the charts. When stocks advance quickly, they can find themselves far away from any support zone (this was the case early last week). As such, a vacuum of buyers is created once meaningful selling begins. In short, when things get overdone to the upside, professionals know to "stand aside" once the selling begins, and wait for more logical spots to start fighting.
As I've indicated on the chart, I think the 3340 to 3280 zone represents key support for the S&P 500 index. This morning, the bulls were trying to defend their turf. However, should they fail, a test of the 50-day is almost assured. Next, let's recognize that a break would likely accelerate the selling. After that, there is some decent support at 3280 and then again at 3205. For me, these areas represent important battlegrounds and likely turning points – if the bulls can find their mojo again, of course.
Finally, let's remember that the current pullback of around 7% on the S&P 500 qualifies as a "garden variety" correction. And given the froth that was in the market early last week, the move certainly seemed justified to me. The question from here is if the worries over unemployment, the economic recovery, the fall flu-COVID combo, taxes, the calendar and additional stimulus will take root. If so, don't be surprised if we embark on a more protracted correction/consolidation.
As I stated yesterday, my base case is that we are experiencing a well-deserved consolidation within the context of an ongoing cyclical bull market. Things had gotten out of hand and the bulls needed a rest. This is that rest. That's my story and I'm sticking to it (for now, anyway).
The State Of Fundamental Models
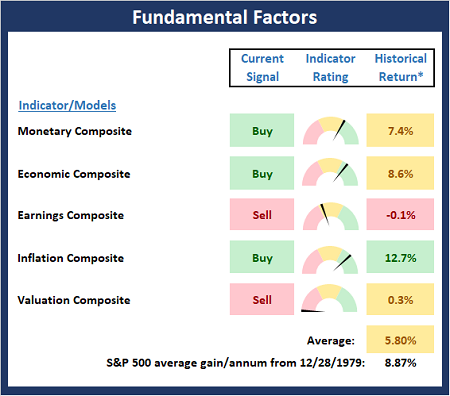
There are no changes to the Fundamental Factors Board this week. Monetary conditions remain positive on balance, our economic composite is holding steady, earnings continue to be a question mark, inflation expectations are on the rise but from very low levels, and valuations remain extremely high. All things considered, I believe the board continues to favor the bulls from a big-picture, intermediate- to long-term standpoint.

* Source: Ned Davis Research (NDR) as of the date of publication. Historical returns are hypothetical average annual performances calculated by NDR. Past performances do not guarantee future results or profitability.
A Word On Valuations
Lots of folks are very nervous about the state of market valuations. However, I believe it is important to remember that valuations tend to surge as recessions end and recoveries begin. The reason is simple; as traders begin to discount better days, the "P" (price) in the P/E ratio rises while the "E" (earnings) continues to lag as a result of the economic slowdown. Since it takes a while for the "E" to recover (earnings are reported quarterly after all), we can expect P/E ratios to stay high for at least a couple quarters. So, from my seat, as long as the economic recovery remains on track, we don't need to fret too much over valuations here, especially given the level of interest rates and the fact that the Fed has pledged to remain friendly for quite some time.
Thought For The Day:
Failure is the opportunity to begin again more intelligently.
-Henry Ford
