Quarter down, three to go
March trading ended with a flurry – it was the best month on the ASX since July 15, adding 4.03%, and was actually a very tidy month for most markets.
The month of March
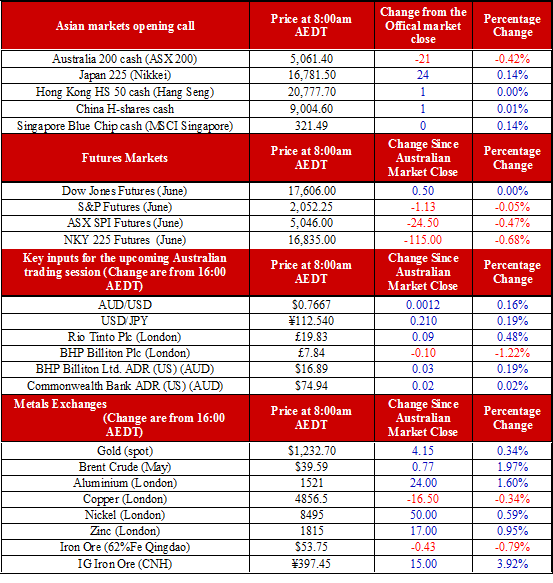
Oil had its best month since April last year, adding 13% from talk of OPEC deals and record low rig counts in the US
SPX had its best month since October 15, up 6.6% as rate hike expectations disappeared
DAX added 4.95%, which was its best month in a year from Draghi’s ‘helicopter funding’, a positive for the largest economy in Europe
USD had its worst month since April 15. losing 3.5% (a good thing for US economics) as Yellen quashed hawkish talk that the Fed may raise rates in June
AUD/USD added 7.3% as the ‘Perfect Storm’ trade fully flows, but this is not good news for Australian economics
The month of April
The S&P has seen nine of the past ten Aprils in positive territory, with an average 2.68% growth which is 0.5% better than any other month
The ASX has seen seven of the past ten Aprils in positive territory, with an average of 1.97% growth which is 0.3% better than any other month
However, the quarterly numbers tell a very different story. January was the worst start to a year on record for the ASX and the worst start to a year on the All Ordinaries in over 30 years.
The extreme pessimism around China, oil and global growth put all markets on the back foot to start 2016, however the recovery difference between global markets has been stark.
First quarter
ASX was down 4.04% on the quarter in local currency terms in USD terms, however it did outperform global peers, adding 1.2%
FTSE lost 1.08% over the quarter in USD terms, losing 3.6% as the GBP got smashed on Brexit fears
DAX lost 7.3% over the quarter, however in USD terms it only lost 2.8%. The EUR jumped in March as the rate cut cycle by the European Central Bank appears over with Mario Draghi mauling even more drastic measures in ‘helicopter funding’
The Dow added 1.5% over the quarter and reached a year-to-date high on 30 March as a ‘two-speed’ US economy and very low inflation sees the Fed backing off rate hikes in 2016 – adding to risk trading. It was the biggest quarterly comeback in the US since 1993
Crude added 3% over the quarter, however the range paints the story of the quarter with a low in the US$27 handle and a high in the US$42 a handle. The extreme swings are unlikely to disappear in Q2
Second quarter
Historically, May is a poor month for the SPX. The old adage of ‘sell in May go away’ is a truism; the average over the past ten year has only been a 0.4% decline. However, June is historically the worse month of the year; the average declines in June have been 1.53% over the past ten years.
It’s the reverse for the ASX, with May averaging a 2.3% decline over the past ten years which is clearly the worst month over the year. June is averaging a 1.77% decline over the past ten years, to be the third worst month of the year behind November.
With today being April fool’s day, history suggests that April could be making a fool of second quarter trading.

