Get 40% Off
🚨 Volatile Markets? Find Hidden Gems for Serious OutperformanceFind Stocks Now

Gold Sector Cycle Up

Published 02/19/2019, 01:57 AM
Updated 07/09/2023, 06:31 AM

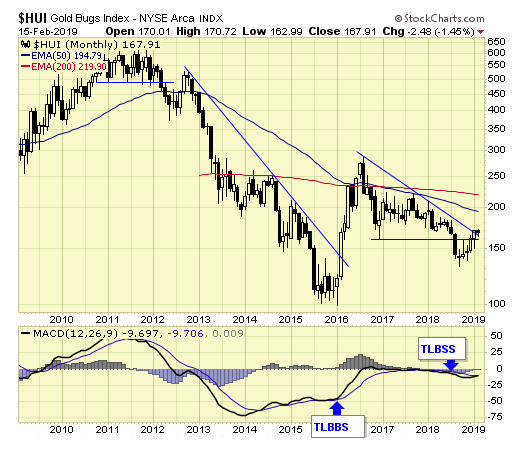
HUI Monthly Chart

The gold sector as represented by HUI is on a long term sell signal.

Long term signals can last for months and are more suitable for investors.
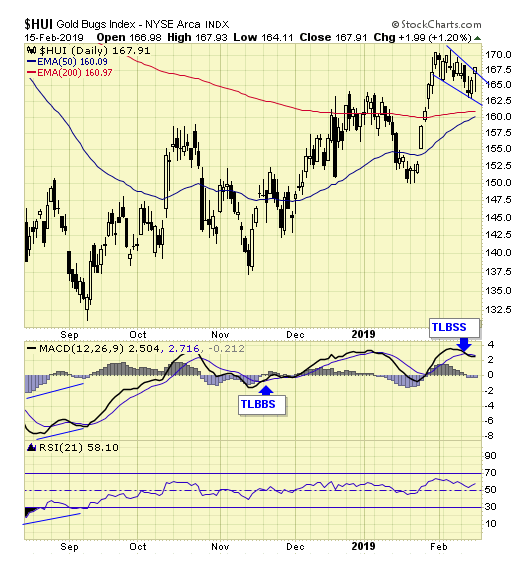
HUI Daily Chart

The gold sector as represented by HUI is on a short term sell signal.

Short term signals can last for weeks and are more suitable for traders.
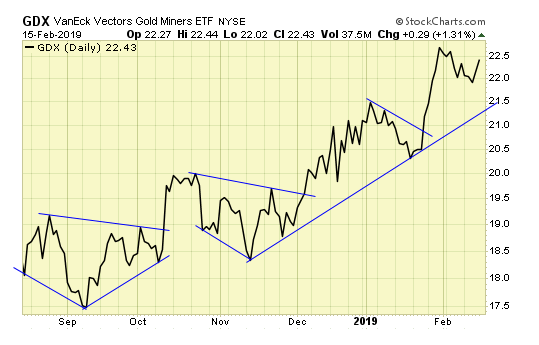
GDX Daily Chart

GDX – our gold stock ETF has confirmed bottoms with breakouts. The trend is up.
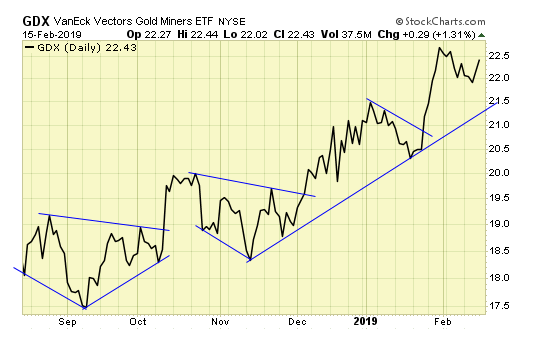
GDX Daily Chart

Our gold ETF has also confirmed bottoms with breakouts.

The trend is up.
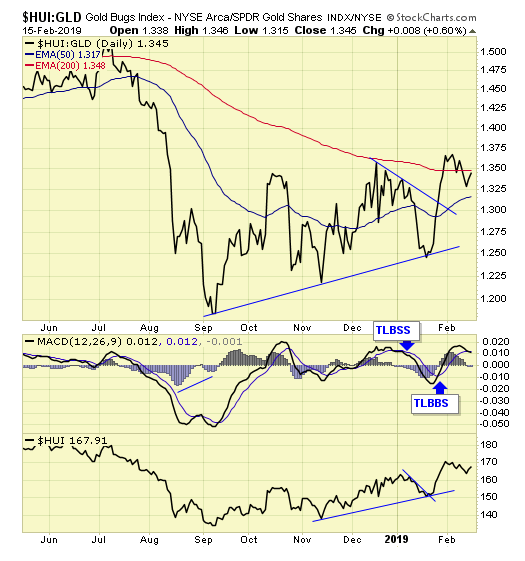
HUI-GLD Daily Chart

Our ratio between gold and gold stocks is on buy signal.

During an up cycle and an uptrend, gold stocks always outperform gold.
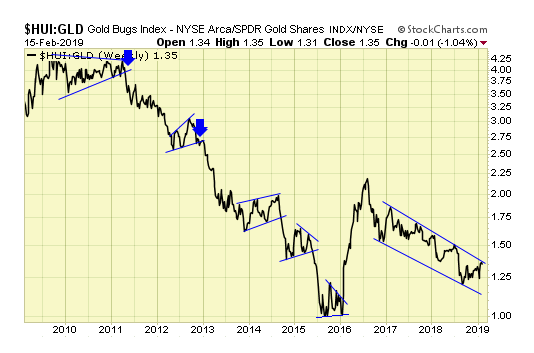
HUI-GLD Weekly Chart

The long term chart of the ratio is now at resistance.

A breakout will confirm that the multi-year correction is over.
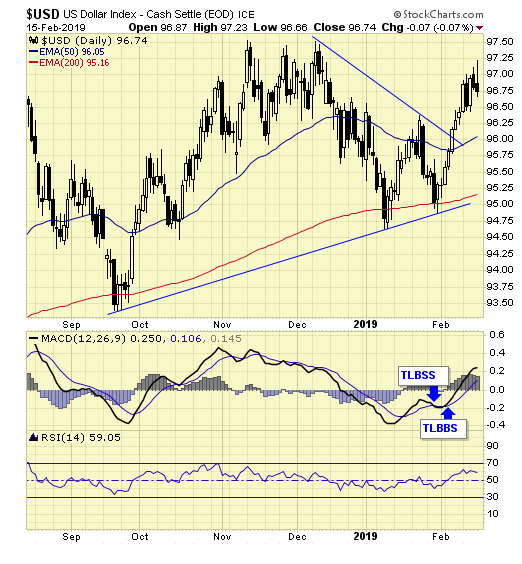
USD Daily Chart

USD – on short term buy signal.

Gold and gold stocks remain firm despite a strong dollar, which is supportive for overall higher prices in the gold sector.

Summary

  • Long term – on sell signal.
  • Short term – on mixed signals.
  • Gold sector cycle is up.
  • We are holding positions and staying the course.

Disclosure

We do not offer predictions or forecasts for the markets. What you see here is our simple trading model which provides us the signals and set ups to be either long, short, or in cash at any given time. Entry points and stops are provided in real time to subscribers, therefore, this update may not reflect our current positions in the markets. Trade at your own discretion.

3rd party Ad. Not an offer or recommendation by Investing.com. See disclosure here or remove ads .

We also provide coverage to the major indexes and oil sector.

Jack Chan is the editor of simply profits at www.simplyprofits.org, established in 2006. Jack bought his first mining stock, Hoko exploration in 1979, and has been active in the markets for the past 42 years. Technical analysis has helped him filtering out the noise and focusing on the when, and leave the why to the fundamental analysts. His proprietary trading models have enabled him to identify the Nasdaq top in 2000, the new gold bull market in 2001, the stock market top in 2007, and the US dollar bottom in 2011.

In his spare time, Jack is an avid golfer and tennis player, and volunteers his time coaching and lecturing at local clubs and universities.

Latest comments

Risk Disclosure: Trading in financial instruments and/or cryptocurrencies involves high risks including the risk of losing some, or all, of your investment amount, and may not be suitable for all investors. Prices of cryptocurrencies are extremely volatile and may be affected by external factors such as financial, regulatory or political events. Trading on margin increases the financial risks.
Before deciding to trade in financial instrument or cryptocurrencies you should be fully informed of the risks and costs associated with trading the financial markets, carefully consider your investment objectives, level of experience, and risk appetite, and seek professional advice where needed.
Fusion Media would like to remind you that the data contained in this website is not necessarily real-time nor accurate. The data and prices on the website are not necessarily provided by any market or exchange, but may be provided by market makers, and so prices may not be accurate and may differ from the actual price at any given market, meaning prices are indicative and not appropriate for trading purposes. Fusion Media and any provider of the data contained in this website will not accept liability for any loss or damage as a result of your trading, or your reliance on the information contained within this website.
It is prohibited to use, store, reproduce, display, modify, transmit or distribute the data contained in this website without the explicit prior written permission of Fusion Media and/or the data provider. All intellectual property rights are reserved by the providers and/or the exchange providing the data contained in this website.
Fusion Media may be compensated by the advertisers that appear on the website, based on your interaction with the advertisements or advertisers.
© 2007-2024 - Fusion Media Limited. All Rights Reserved.