Like many wise money quotes, nobody is quite sure who originally said: “When the facts change, I change my mind. What do you do, sir?”
It’s frequently credited to economist John Maynard Keynes. A popular story goes that Keynes changed his mind on a financial issue, was criticized for his “flip flop” and then delivered the zinger.
QuoteInvestigator.com researched the quip and concluded that Keynes never actually said it. (Keep that bit of market trivia in your back pocket.)
Regardless, the facts have changed on big oil dividends. On September 9, 2015, I warned readers that Big Oil was a “Big Dividend Trap.”
Fast forward to Apr. 2, 2021 and this “BO” is telling readers to go out and buy the “other BO’s” (Big Oil’s) biggest name—Exxon Mobil (NYSE:XOM).
Careful readers asked: “What gives?” A very fair question, and I do appreciate the attention to detail! Put simply, the fundamental facts changed.
I turned bearish on crude oil prices themselves in April 2014, warning that then-$103 per barrel Texas tea was due to tumble. US production was at multi-decade highs, growing at its fastest rate ever. Crude oil stocks were plentiful and, if the supply situation wasn’t bad enough, we had a classic contrarian indicator—hedge fund managers were convinced that oil prices were heading even higher.
Flashback to 2014: US Crude Oil Production Was Popping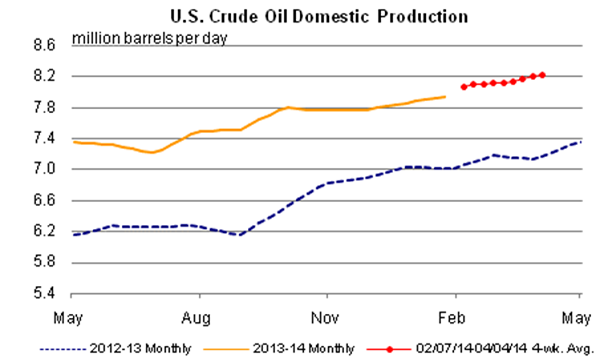
(Source: EIA)
That was indeed the time to sell oil—and step away from the sector for six years. Prices fell, then completely collapsed. They eventually bottomed at negative prices. (Producers were literally paying to give the goo away.)
When oil prices are in a downtrend, we don’t want oil dividends. Period.
Oil Going Down? Avoid Big Oil Yields
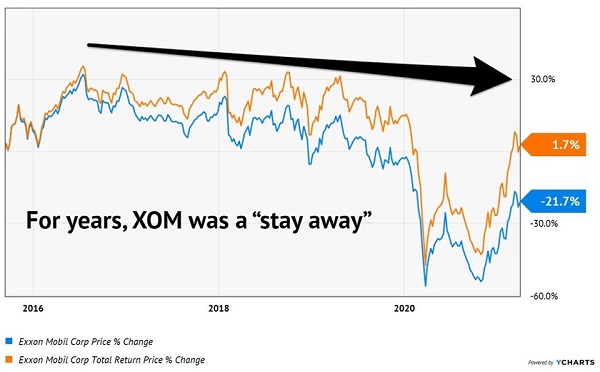
Many income investors were lured into XOM for the security of its payouts. To the company’s credit, its payout was perfectly secure. Heck, many blue-chip firms have fluffy mission statements that wax eloquently about who the firm exists to serve. The community, employees, shareholders and so on.
Exxon’s primary purpose is to maintain and pay its dividend. How do we know this?
In the dark days of 2020, the company suspended its 401(K) matching. Its dividend, meanwhile, was paid on time and in full.
That is stone cold payout prioritization. The hammer had to drop somewhere, and as income-focused investors, we have to respect that it wasn’t laid on the dividend.
The firm now finds itself on the right side of oil’s trend. We’ve talked more about oil since its darkest days last April, thanks to their habit of “crash ‘n rally” patterns. This scenario unfolded from 2008 to 2012, and it just kicked off again:
- First, demand for oil evaporates due to a recession. The price of oil crashes.
- Next, energy producers scramble to cut costs. They cut production aggressively.
- Then, the economy slowly recovers. Energy demand picks up.
- But there’s not enough supply! So, the price of oil climbs and climbs and climbs.
- Energy producers bring supply back online, but it takes time to explore and drill. Supply lags demand for years, and the price of oil climbs and climbs.
In late 2008, oil collapsed along with every other asset on the planet. The black goo traded hands for more than $100 per barrel, dropped below $40 in months, and was back over $100 within in a few years:
Oil’s Last Crash ‘n Rally: 2008 to 2012
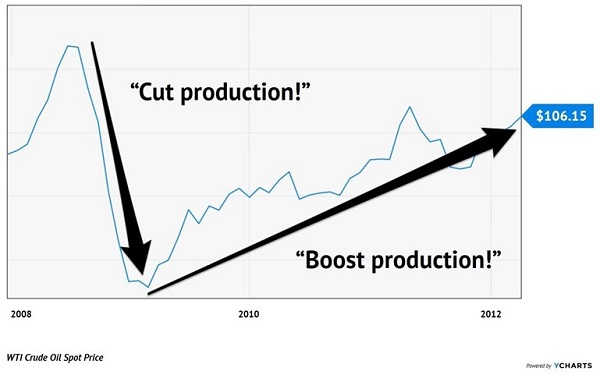
We are not even one year into this latest “crash ‘n rally” pattern. We should assume that oil prices will keep climbing for the next two or three years at least. This supply ramp up is analogous to post-2008. It is going to take time, and oil will climb in the meantime.
Oil’s Current Crash ‘n Rally: 2020 To Present (And Counting)
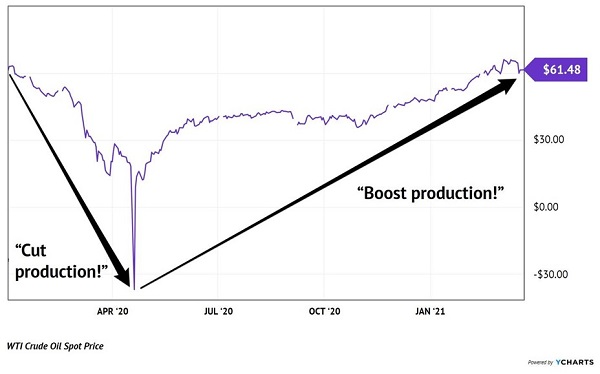
My bet? Oil will clear $100 again before this rally is done.
According to the International Energy Agency (IEA)—the best source of industry information in my book—world oil demand will grow to reach 96.4 million barrels per day.
Global oil supply, meanwhile, is just 93.6 million barrels per day.
Prices are always set at the margins. With a 3 million barrel per day shortfall, the price of oil is going to keep climbing until that imbalance is resolved.
With revenues rebounding, XOM is finally making a bit of extra cash for the first time in years. It’s using the dough to pay down debt, which ballooned recently as the company borrowed money to keep its shareholders whole on the payout front. The reversal of the debt load is another reason why Exxon is a safer play today than it was just nine months ago.
Back In Black
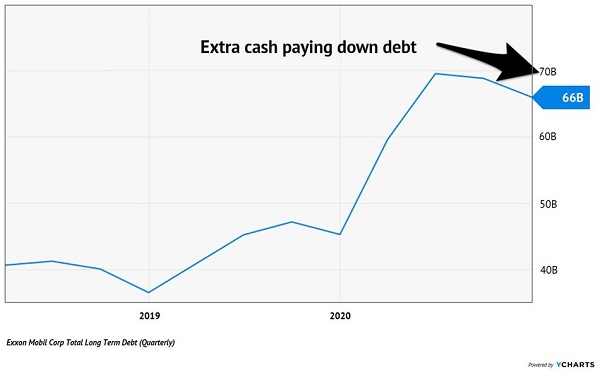
Our projections about oil prices are the lynchpin of our bullish argument. As black gold continues to climb, Exxon will be able to accelerate its debt repayment. This will reduce its interest obligations, which will then give the company even more money to reduce debt, and the virtuous cycle will continue. This is a 6.1% dividend with 61% price upside, or better, as the price of oil rebounds.
Oil income is the type of inflation-protected dividend-paying investment we want to own for the rest of 2021 and beyond. The Federal Reserve is creating an incredible amount of money, and our government is mailing out “newly printed checks” at an unprecedented scale.
Disclosure: Brett Owens and Michael Foster are contrarian income investors who look for undervalued stocks/funds across the U.S. markets. Click here to learn how to profit from their strategies in the latest report, "7 Great Dividend Growth Stocks for a Secure Retirement."
