Are investors cautiously optimistic? Probably. A little bit greedy? Maybe. Yet I would be hard-pressed to describe the current psychology in terms of 'euphoria'. The most apt descriptor is 'complacency'.
No Stopping It?
Keep in mind, geopolitical tensions are rising in the Middle East, Ukraine and off the coastal waters near China. Not surprisingly, gasoline prices have remained stubbornly high with the price of Crude Oil holding well above $100 per barrel. Yet none of these troubles have impeded the historic rally for U.S. stocks.
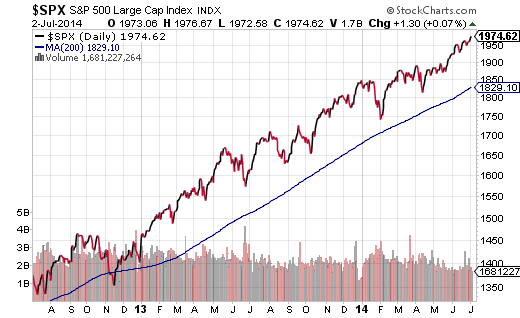
Junk bonds and investment grade bonds have compressed to dangerously narrow spreads. Similarly, the CBOE S&P 500 VIX Volatility Index is pushing single digits (10.5). Both of these circumstances reflect levels last seen in 2007 — levels associated with the previous bear market’s beginning. Meanwhile, the equity put-call ratio as well as adviser sentiment readings illustrate a calmness that is eerily reminiscent of the late 1990s. And perhaps most telling? The S&P 500 has stayed above a 200-day trendline for 400 trading sessions – the longest stretch in the history of benchmark.
Ironically, the fact that the S&P 500’s current price is 8% above its 200-day moving average is not particularly alarming. Even a reversion to this particular mean would constitute corrective activity that many regard as healthy for the uptrend’s longevity. Nevertheless, an 8% pullback in the popular benchmark would likely come with selling activity in risk assets across the equity board. Moreover, the most susceptible stock ETFs might be those that have deviated the most from a respective mean.
Here's an accounting of asset groupings that have traveled the furthest above a 200-day trendline:
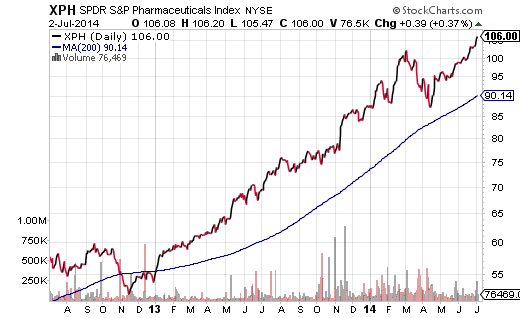
1. Biotech/Pharma. In March of this year, the biotech/pharma boom seemed as if it were pining for an ignominious conclusion. Momentum “faves” like FirstTrust Amex Biotech (NYSE:FBT) and SPDR S&P Pharmaceuticals (NYSE:XPH) gave up 13.3% and 19.7% respectively. Then came the April-May turnaround. Not only did these resilient sub-sectors fend off the bear during the harsh correction, but FBT and XPH are hitting record highs once again.
On the other hand, the dot-com bust in March of 2000 followed a similar pattern. The highest of flyers from JDS Uniphase (NASDAQ:JDSU) to Sun Microsystems rallied back into August of 2000 before the “New Economy” tablecloth had been yanked for good. FBT and XPH are susceptible to dramatic selling pressure with prices more than 15% above the long-term trend.
2. Oil Services. Energy stocks tends to outperform when oil prices remain elevated and when conflicts break out in oil producing regions of the world. From Russia to Iraq to Syria – even recent concerns in Israel – only seem to bolster energy production and exploration stock prices.
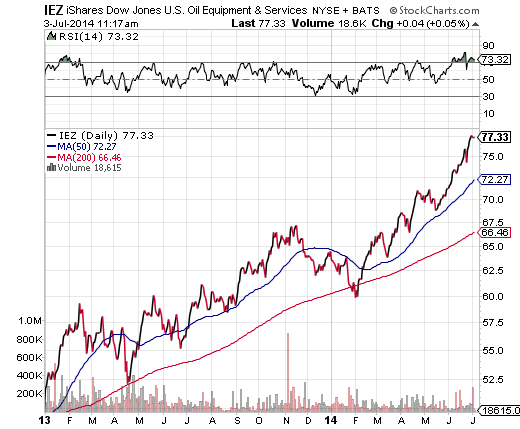
That said, it is the oil-services companies that have been getting the biggest boost lately. The only problem? The last two times that exchange-traded trackers like Market Vectors Oil Services (ARCA:OIH) and iShares DJSU Oil Equipment & Serv. (NYSE:IEZ) rose more than 15% above respective long-term trends – February of 2013 and November of 2014 – each ETF reverted back to its 200-day moving average. Additionally, Relative Strength Index (RSI) readings above 70 advance the case that the sub-sector is decidedly overbought.
3. Semiconductors. Historically speaking, semiconductor stocks tend to lead the way in economic recoveries. Of course, the below-trend GDP expansion over the last five years has not been typical. Many folks believe that the recovery is just now — here in 2014 — just getting ready to fire on all cylinders.
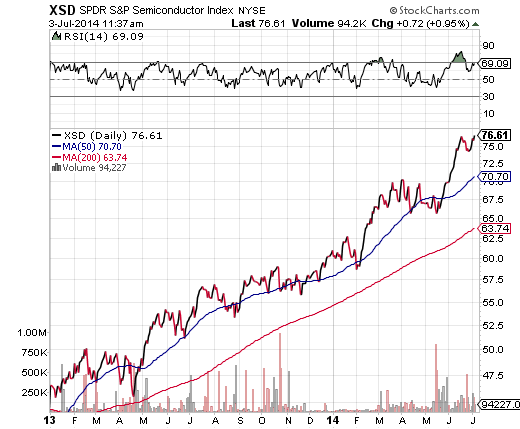
Semiconductor ETF investors seem to think so. Investors in SPDR S&P Semiconductor (NYSE:XSD) have garnered unrealized gains of 25%-plus in the first half of 2014 alone. By the same token, “semis” may be ultra-sensitive to a summertime swoon. Both XSD and Market Vectors Semiconductor (NYSE:SMH)) are more than 15% above their trendlines.


