Introduction
As the stock market continues its relentless advance, attractive valuations are getting harder and harder to find. This is especially true for the highest quality blue-chip dividend growth stocks. Perhaps more importantly, in addition to the market’s relentless advance, there has also been a clear flight to quality - especially with dividend growth stocks. Therefore, the vast majority of the best-of-breed blue-chip dividend paying stocks are currently trading at elevated levels. In other words, finding high quality and value is very rare today in the dividend growth segment.
This presents a conundrum for the prudent dividend growth investor with money available for investment. Prudence suggests that the quality of the companies chosen for their portfolios is extremely important. It only makes sense to try to invest in the highest quality companies you can find. However, the prudent dividend growth investor also needs to ask and answer another important question. At what point does excessive valuation turn quality into high risk investments? After all, the idea behind investing in quality is to lower risk.
Furthermore, being prudent implies being sensible regarding the valuations you should be willing to pay for even the highest-quality company. The intelligent value investor recognizes that you can overpay for even the best company. Moreover, they understand that investing when valuation is too high reduces the opportunity for attractive returns and simultaneously increases risk. Taking on more risk for lower potential returns is the antithesis of prudent value investing.
However, this poses a second important question that the prudent value investor must also ask and answer. How much quality should you be willing to forgo? Asked differently, what is the proper balance between quality and value? In other words, at what point does attractive valuation compensate you for the risk of investing in lesser quality securities? These are difficult questions for the prudent investor to answer. However, I will attempt to provide some insights into correctly answering these questions with this article.
Dividend Growth Stocks on David Fish’s lists of Champions and Contenders
In my previous article titled “These Are The Only Dividend Aristocrats I Would Consider Today” I identified only 7 out of 50 Dividend Aristocrats I would consider investing in currently. This prestigious list of dividend growth stocks covers what is generally considered the crème de la crème of dividend growth stocks. However, author David Fish produces and tracks 3 additional lists of dividend growth stocks with histories of increasing their dividends each year known as the CCC lists.
His Dividend Champions have increased their dividend payout for at least 25 years similar to the Dividend Aristocrats list. However, his list includes 108 Champions versus only 50 Aristocrats. Nevertheless, the majority of companies found in his Dividend Champions are generally high quality dividend growth stocks.
His second list he calls Dividend Contenders, which is comprised of companies that have increased their dividends for 10 to 24 straight years. This list of reliable dividend growth stocks is currently made up of 242 companies. Generally speaking, this is also a list of high-quality dividend growth stocks, but arguably, the quality of the companies on this list would in the general sense not be equal to the Champions or Aristocrats constituents.
Finally, David Fish offers his third list of up-and-coming potential dividend stars known as the Challengers. There are 428 companies currently on this list representing dividend growth stocks that have increased their dividends for 5 to 9 straight years. With this article, I only surveyed the Champions and Contenders looking for attractive valuation. Consistent with what I found when I surveyed the Dividend Aristocrats in my previous article, I only found 6 additional Dividend Champions (excluding any of the duplicate Aristocrats I presented in my previous article) that I considered attractive in today’s elevated market.
On the other hand, my cursory review did identify 32 Dividend Challengers that appear attractively valued today. Consequently, this leads me to conclude that the best values for the dividend growth investor might currently be found in the Dividend Challengers. However, that does not automatically imply that the research candidates on this list are of lower quality. On the other hand, some are of lower quality and some are not. Finding impeccable quality available at attractive valuations is currently challenging, to say the least. Nevertheless, the one common denominator with all these research candidates is that they have all increased their dividends each year for the past decade or more.
Why a 15 P/E Ratio is a Rational Valuation Reference
The P/E ratio of 15 is an extremely important and rational valuation reference if you understand the significance of what this metric really means. First and foremost, the P/E ratio is not just a mere number or statistic. It is actually a mathematical calculation that represents the value that a given company’s earnings are offering you as an investor. In my most recent article, a comment was made suggesting that applying a P/E ratio of 15 to all companies was overly simplistic. With this article I intend to demonstrate why that is not true for most companies.
As rational investors, we are always attempting to earn the highest possible returns we can at the lowest levels of risk we can assume. Therefore, a rational way to look at investing in a stock is to determine what rate of return the company’s earnings power is offering you at a given level of valuation. As I’ve written many times before, the easiest way to determine this is to simply calculate the earnings yield represented by the company’s P/E ratio. This is accomplished by inverting the formula from price to earnings (P/E) to earnings to price (E/P) which gives you the earnings yield. Therefore, a 15 P/E ratio represents an earnings yield of approximately 6.66%. A P/E ratio of 20 represents an earnings yield of 5% and a P/E ratio of 30 represents an earnings yield of 3.33%.
Consequently, when you are evaluating the P/E ratio of a given company, in the back of your mind you should be asking what yield is the company’s current earnings offering me? An earnings yield of 6% to 7% (P/E ratio 15) would be the minimum that a rational investor should expect given the risk associated with investing in common stocks. This is especially pronounced when you consider that as a passive shareholder, you will not be receiving all of the company’s earnings.
For example, if the company’s dividend payout ratio was 50% of earnings, this would imply a current dividend yield of 3.33%. Any return you would expect above that would have to come from capital appreciation potential. Of course, a lower dividend payout ratio would indicate a lower dividend yield -and vice versa. However, the point is that the earnings yield and the dividend yield represents the current returns that the company’s earnings power is affording you at any given valuation.
What I am suggesting here is that when you are seeing a company trading at a certain P/E ratio, you should immediately ask yourself what is the earnings yield, and is it high enough to entice me to invest. Obviously, this also suggests that the lower the P/E ratio you pay to invest in a stock, the higher the earnings yield that valuation represents. With all investing, higher yield is always better than lower yield.
Additionally, and as I also have written many times in the past, the long-term returns from stocks has averaged somewhere between a range 6% to 8%. Therefore, an earnings yield that falls within that range (i.e. a P/E ratio of 15) represents an average return expectation with anything less being unacceptable. Therefore, I am recommending that a P/E ratio of 15 represents a very valid and rational valuation reference and perhaps even limit.
Furthermore, suggesting that a P/E ratio of 15 represents a rational value reference for most companies does not simultaneously suggest that the market will not assign a different P/E ratio valuation. However, there is a big difference between market valuation and intrinsic valuation. Stock prices are volatile and changing every day, and with those price changes P/E ratios change in tandem. In other words, P/E ratios will be routinely moving above and below this fair valuation reference.
The key for the rational investor is to understand the difference between sound valuation and market valuation - and then act accordingly. Nevertheless, if the investor finds a reason to not act accordingly, they should at least be aware of the ramifications of their actions. In other words, when you are investing in a stock at a high P/E ratio, you should recognize that you are taking on more risk than the company’s earnings power is offering. Consequently, you must depend on future market action for your rewards, because fundamental values are not there. Said differently, the only way you can expect attractive returns when paying a higher valuation is to expect the market to continue to value your company at these high valuations long into the future.
Up to this point what I presented might be considered an interesting theory on valuation and the relevance of the P/E ratio of 15 as an important valuation reference. However, the proof is, as they say, in the pudding. Therefore, if there is any credence to the theory, then we should be able to see it at work under real-world occurrences. In other words, how well does the P/E ratio 15 stand up as a valuation reference when examining the long-term record of actual companies in the stock market over time?
If what I have presented has any relevance, then we should see a strong correlation between a company’s stock price and its earnings at a P/E ratio of 15. Furthermore, we should see periods of underperformance when a company’s valuation is higher than a P/E ratio of 15, and periods of better performance when the company’s valuation is lower than the P/E ratio of 15. And more importantly, during periods of time when the market is valuing the company above this valuation reference we should see the price move back into alignment, and when the market is undervaluing the company it should also eventually move back into alignment with the P/E ratio of 15.
Therefore, in order to test this theory, I am going to provide long-term historical earnings and price correlated F.A.S.T. Graphs™ on all of the Dividend Champions and Challengers that I have identified as fairly valued research candidates by surveying those lists of dividend achievers. Frankly, I’m not sure how many of these companies many readers might find attractive or of interest.
To be honest about it, they are only a few that I would personally be willing to consider. However, the purpose of this exercise was to examine the valuations of what many consider the best sources for dividend growth investing. The bottom line result is that attractive valuations on good dividend growth stocks are hard to find today. Hopefully, there are a few on this list that might be of interest to some of you.
Is the 15 P/E Ratio Overly Simplistic or Profoundly Rational?
In all the many articles on value investing I have authored, the validity of my contention that a P/E ratio of 15 is a sound and valid valuation reference has been often challenged. In most of my articles, I presented a few examples that I considered relevant to the thesis of what I was writing about. However, with this article I’m going to take a more aggressive approach. With this article I’m going to include approximately 40 earnings and price correlated F.A.S.T. Graphs™. I apologize in advance for the number of graphs; however, these 40 companies come in virtually every color and flavor imaginable. Therefore, they represent strong evidence supporting my thesis.
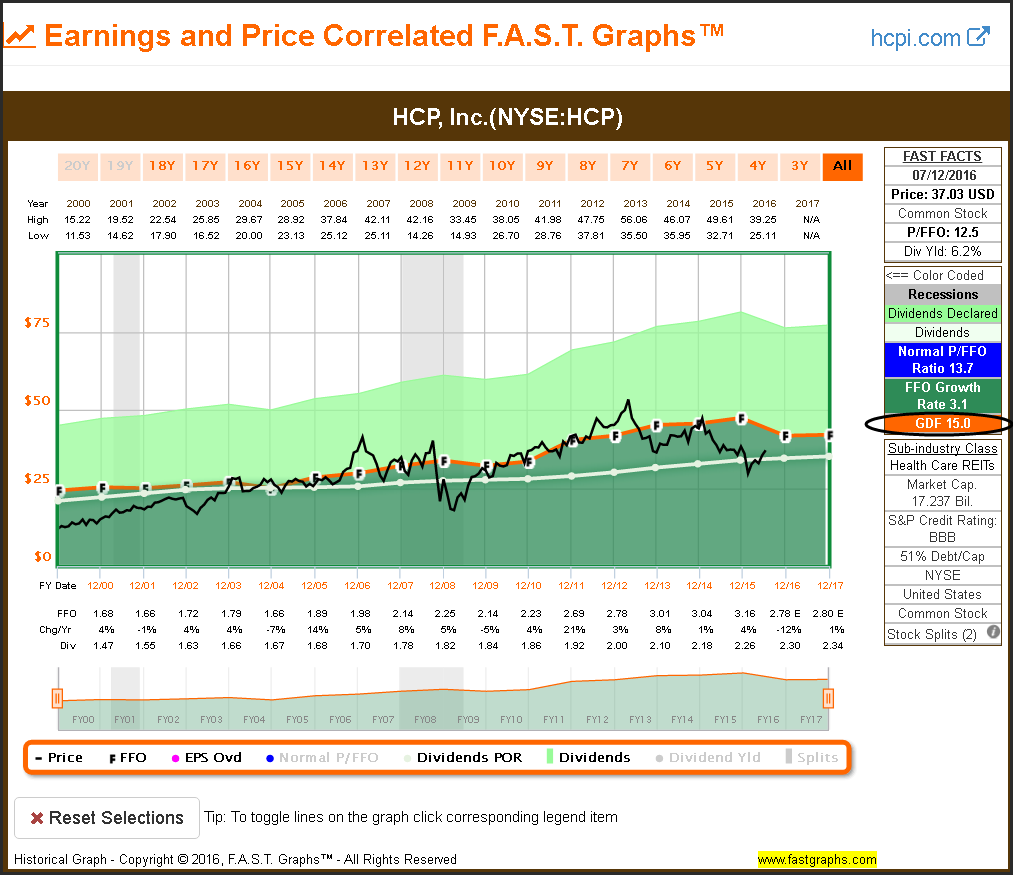
On the majority of these graphs the orange earnings justified valuation reference line will be drawn at a P/E ratio of 15. However, there are a few companies with earnings growth rates above 15% where the orange earnings valuation reference line will be drawn at a higher P/E ratio, and one REIT example where I will be presenting the more appropriate price to funds from operations (FFO).
Moreover, in addition to just presenting fairly valued Dividend Champions and Challengers, my more personal motivation is to illustrate to the reader how the P/E ratio of 15 applies to real companies over long-term timeframes. The P/E ratio of 15 as a fair valuation reference is profoundly relevant when you examine the long-term earnings and price correlations of most companies. I contend that the examples presented in this article provide prima facie evidence of that reality. Theory is fine and even interesting to pontificate about, but true insights come from examining how the theory applies and/or works in the real world.
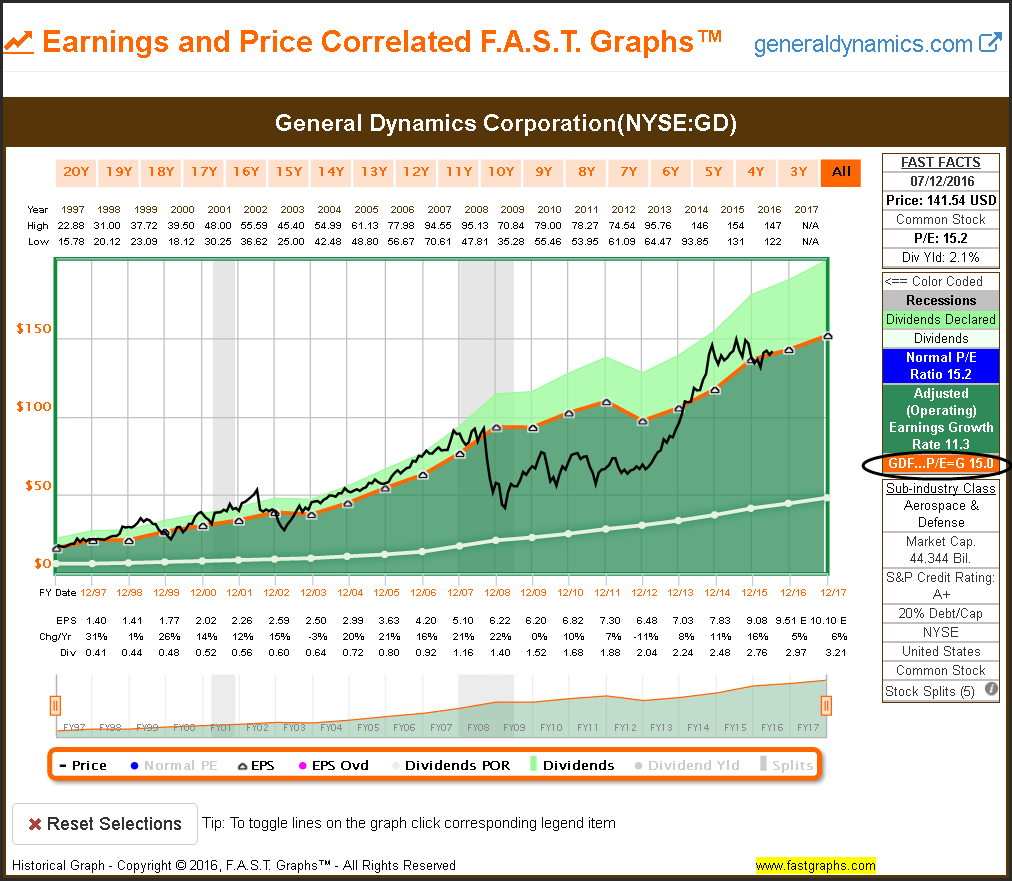
However, in order to truly benefit from this exercise, I would like to focus the reader’s attention on to what is actually being displayed. On each company graph presented, please recognize that the orange lines on each graph are drawn at a P/E ratio of 15. The black lines on the graph are plotting monthly closing stock prices over the timeframes presented.
Therefore, when the black price line is touching the orange line, note that this is a time when the P/E ratio of the company is precisely 15. Further note that when the price is above the orange line, the P/E ratio at that time is higher than 15, and when the price is below the orange line the P/E ratio is lower than 15. Most importantly, note how the stock price tracks the 15 P/E ratio closely over time and how it always and eventually moves back into alignment when it becomes disconnected from the orange line. Once you get the hang of what you’re looking at, it should only take a few seconds to examine each of the numerous graphs presented.
Additionally, be conscious of what happens to performance when the price is above the orange line and what happens to performance when the price is below the orange line. Also, pay attention to how price correlates to the P/E ratio of 15 during times when the company’s earnings are rising as well as when they are falling. I believe that if you spend a little time examining these graphs cognizant of how price reacts in accordance with the P/E ratio of 15, you will gain incredible insight into how important a valuation reference it truly is. At the end of the day, my hope is that it will enhance your investing acumen.
The reader should also note that the honeydew green (white looking) line on the graph plots dividends. The area below this line represents the dividend payout ratio. The light green shaded area above the orange line indicates dividends after they’ve been paid out of earnings.
4 Out of 108 Fairly Valued Dividend Champions
General Dynamics Corporation (NYSE:GD)
The 15 P/E ratio clearly represents sound valuation over time. The best time to have invested in General Dynamics was just after the Great Recession. However, it took patience to reap the ultimate rewards as price eventually moved back to a P/E ratio of 15.
HCP,Inc. (NYSE:HCP)
The price of this REIT has clearly followed a price to FFO of 15 over time. Periods of overvaluation and undervaluation are clearly revealed.
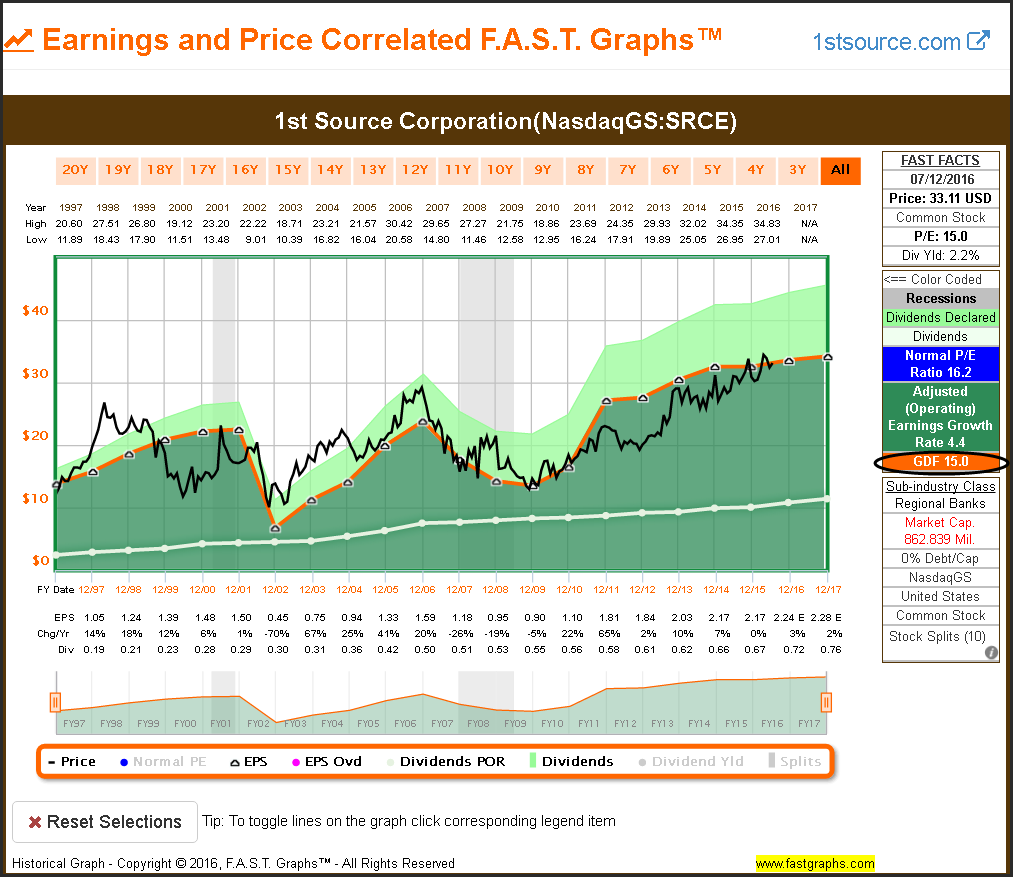
1st Source Corporation (NASDAQ:SRCE)
With this example we see price following the P/E ratio of 15 during periods of rising earnings and falling earnings. Once again, periods of overvaluation and undervaluation are clearly revealed.
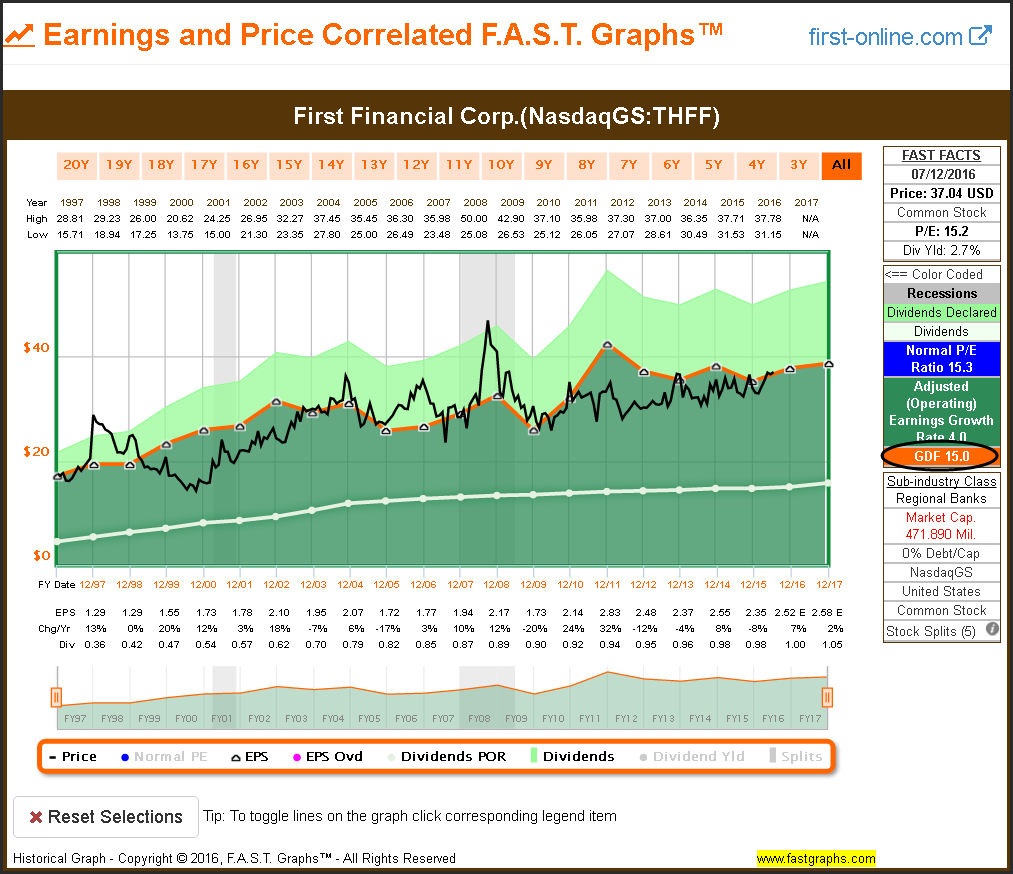
First Financial Corp (NASDAQ:THFF)
There are many times with this example where price deviates from the P/E ratio of 15. However, it inevitably moves back into alignment and clearly tracks the P/E ratio of 15 over the long.
32 Out of 242 Fairly Valued Dividend Contenders
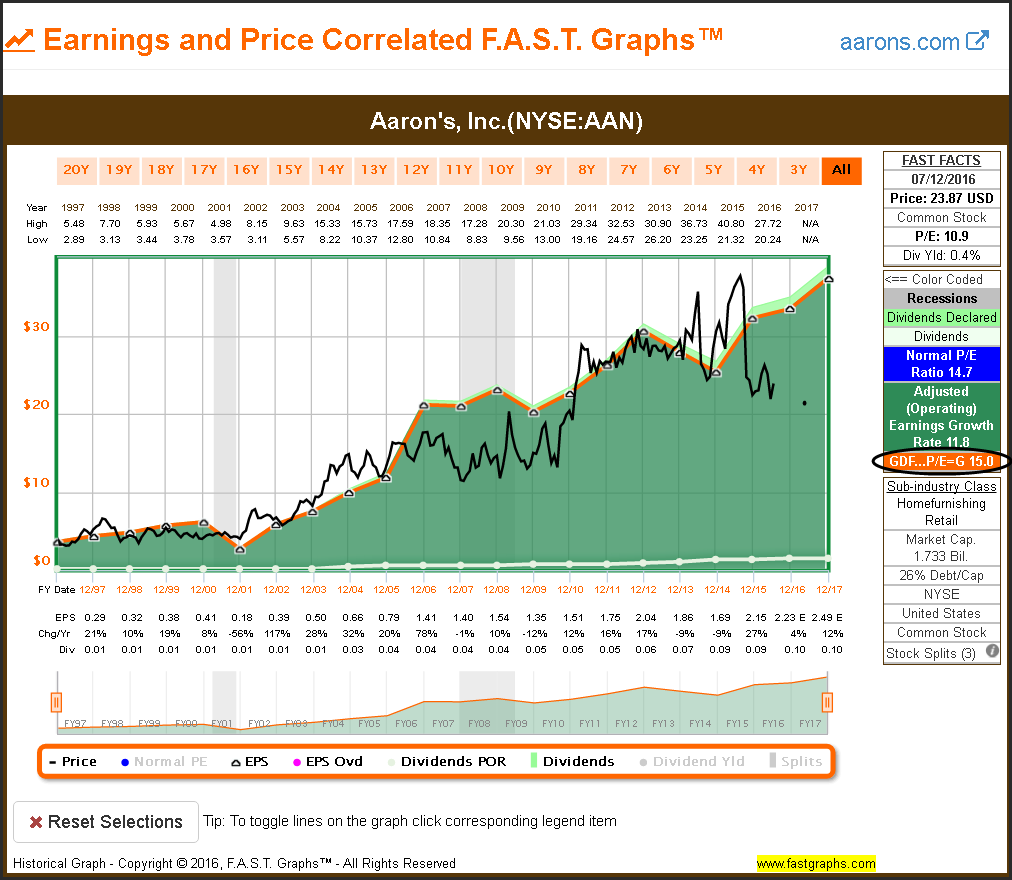
Aaron’s, Inc. (NYSE:AAN)
Aaron’s doesn’t provide much in the way of dividend yield even though it has a history of increasing its dividend each year. However, the correlation between its price and the P/E ratio of 15 is clear and undeniable.
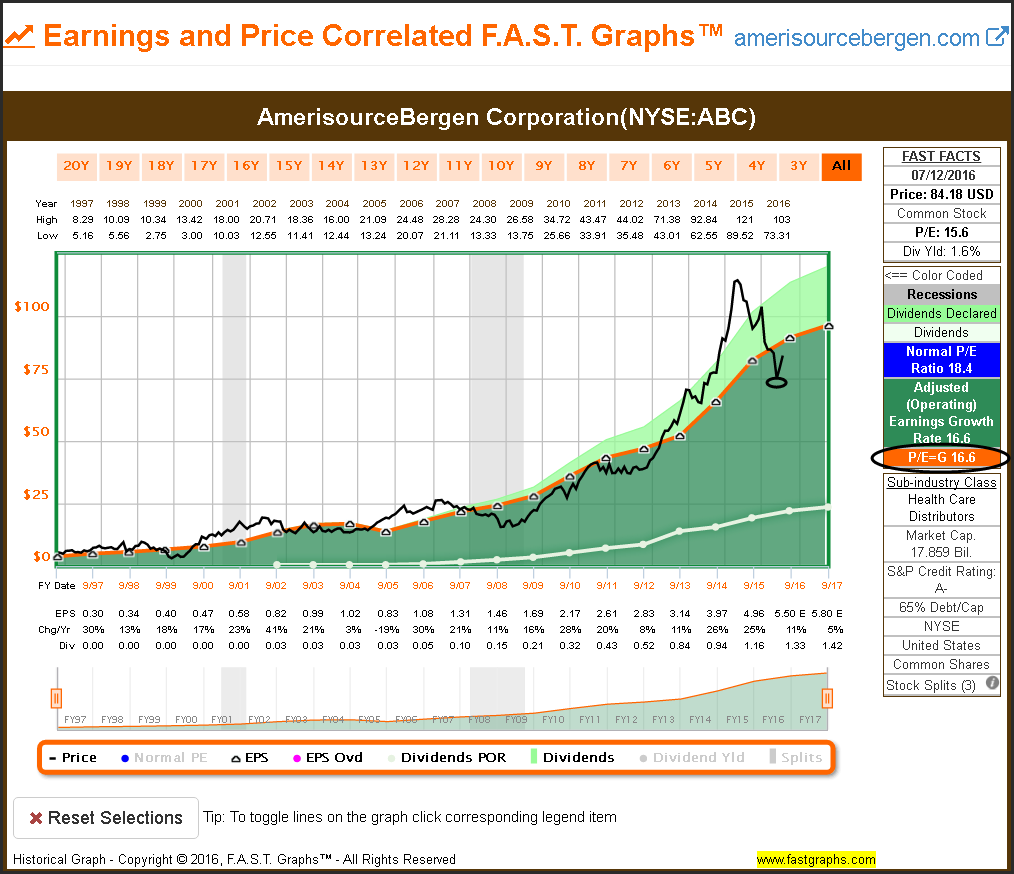
AmerisourseBergen Corporation (NYSE:ABC)
Fast-growing AmerisourseBergen is an exception to the 15 P/E ratio fair valuation reference. Earnings growth averaging 16.6% per annum commands a P/E ratio of 16.6. However, the earnings and price correlation at this slightly higher valuation is highly correlated.
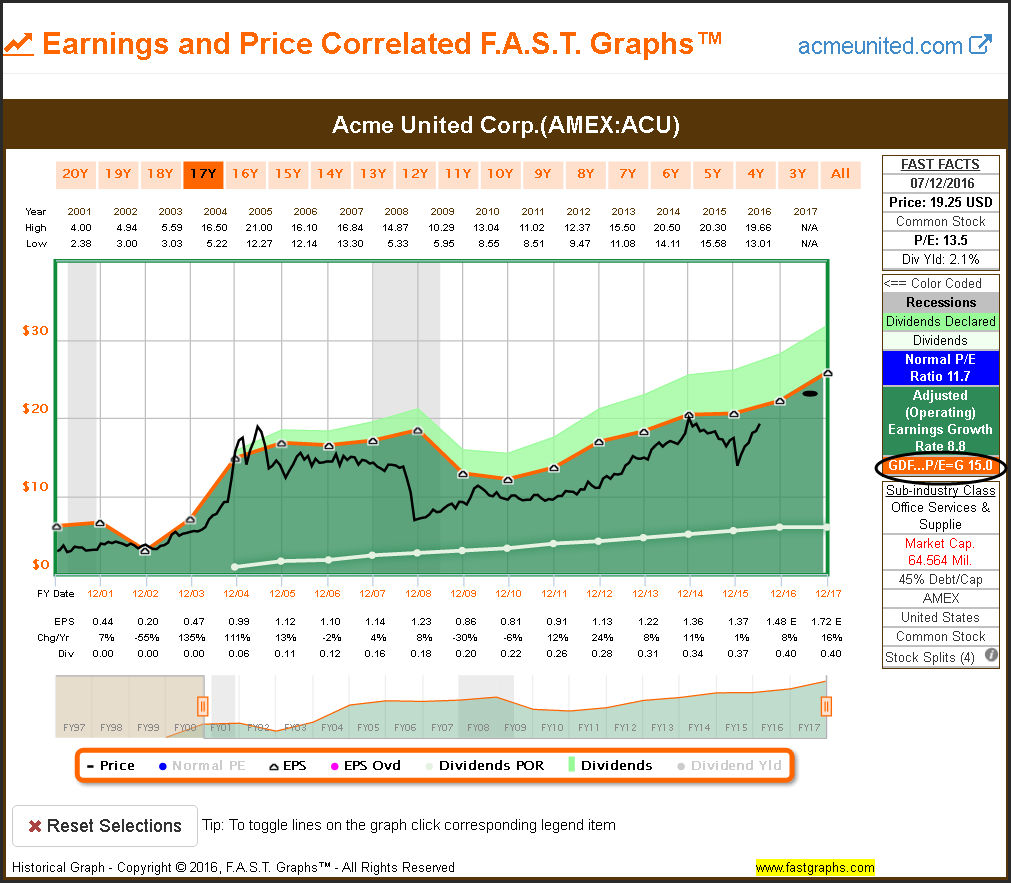
Acme United Corp. (NYSE:ACU)
This company has only been paying a dividend since 2004. Although the relationship of price to the P/E ratio of 15 is not as correlated, it is still relevant as a valuation reference. However, in this case it might be wise to lower the threshold to a lower P/E ratio valuation reference.
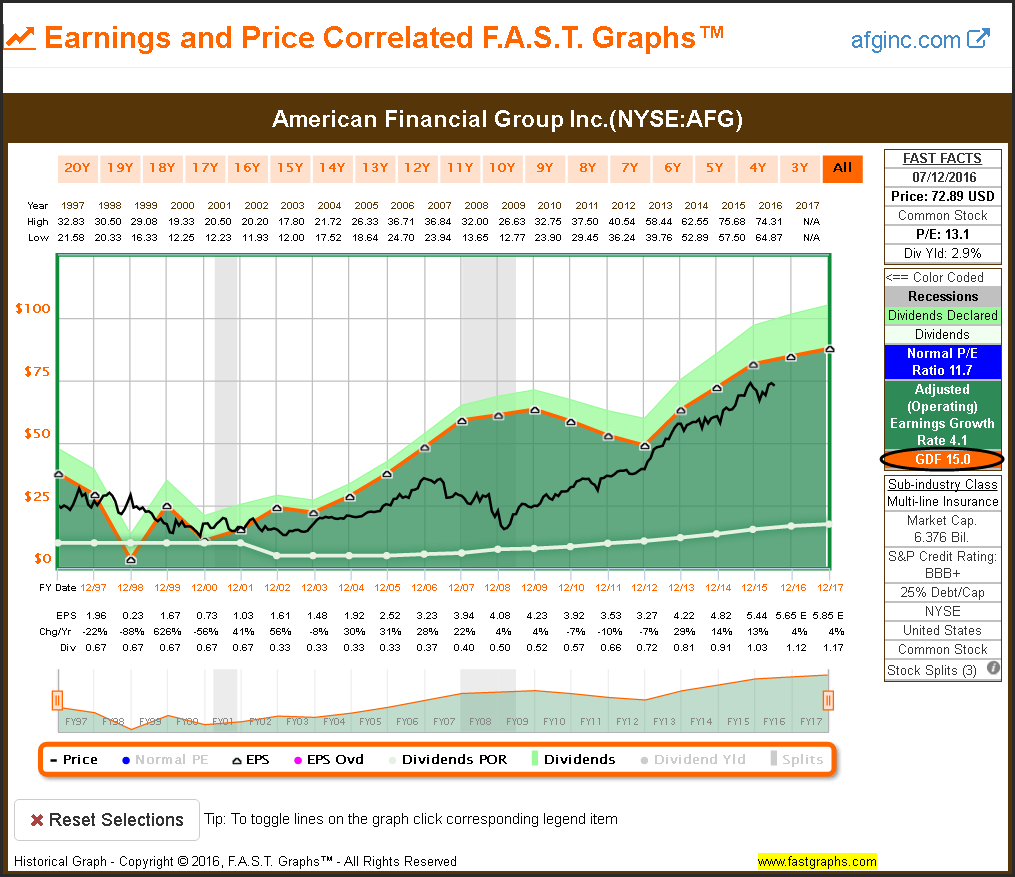
American Financial Group Inc. (NYSE:AFG)
Although the P/E ratio of 15 and price is not as correlated as many others, this example still establishes the 15 P/E ratio as an upper limit valuation reference.
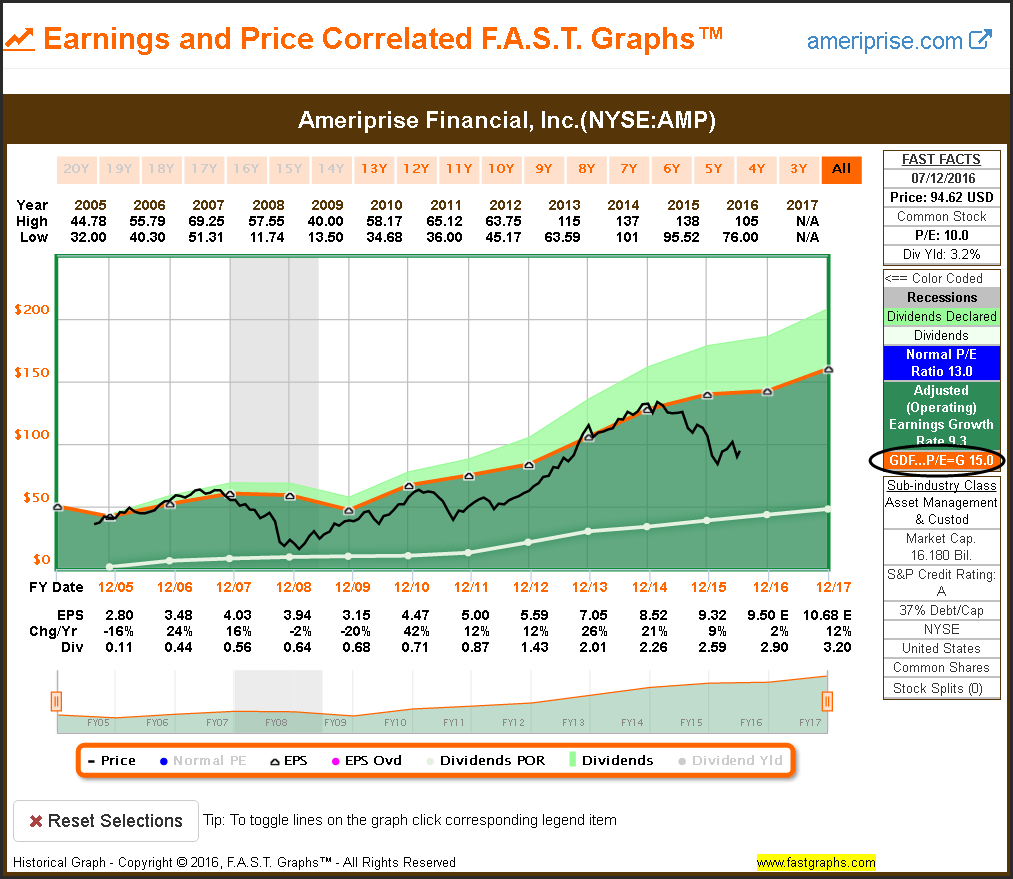
Ameriprise Financial, Inc. (NYSE:AMP)
After being spun off from American Express (NYSE:AXP) in 2005, the P/E ratio of 15 represents a profound valuation reference. Once again, periods of undervaluation are clearly revealed.
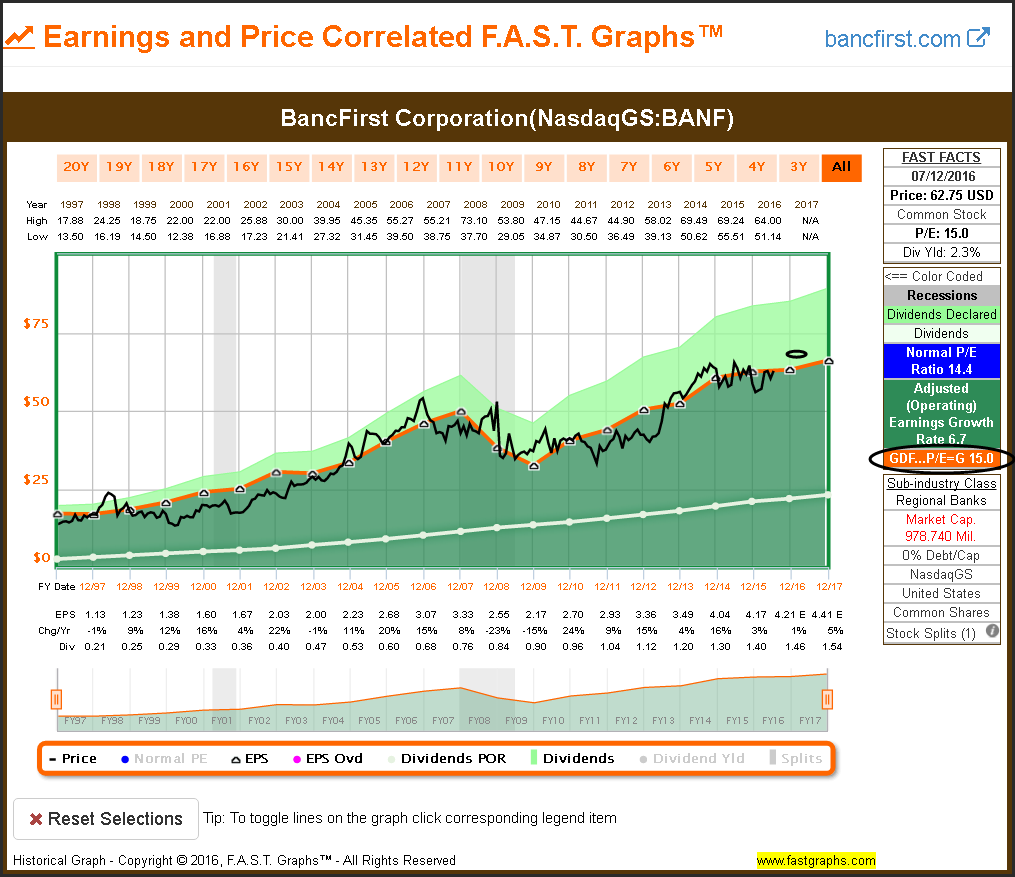
BancFirst Corporation (NASDAQ:BANF)
This is a classic example of the relevance of the P/E ratio of 15 as a valuation reference. Price clearly tracks earnings at that multiple, and periods of overvaluation and undervaluation are clearly revealed.
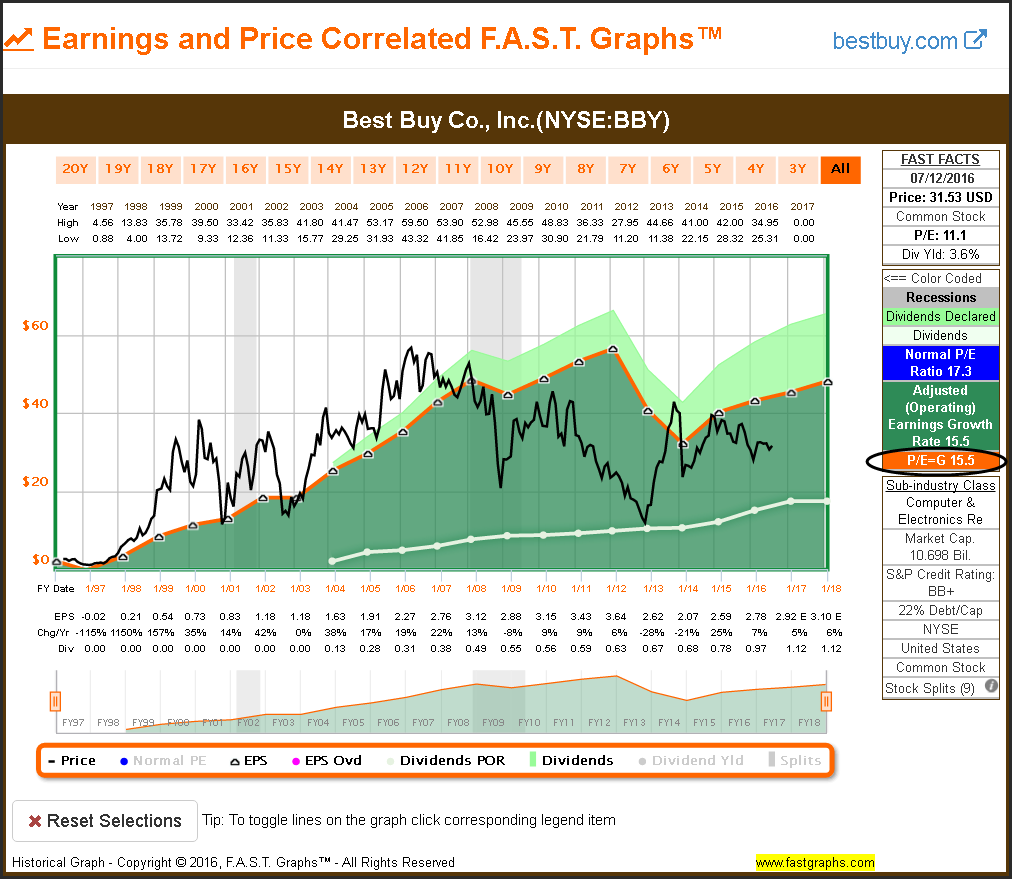
Best Buy Co., Inc. (NYSE:BBY)
This example clearly illustrates the danger of disregarding the P/E ratio of 15 as a valuation reference. Many times in the past the market has placed extreme valuations on this stock, and each time the price promptly fell back into alignment with the P/E ratio of 15.
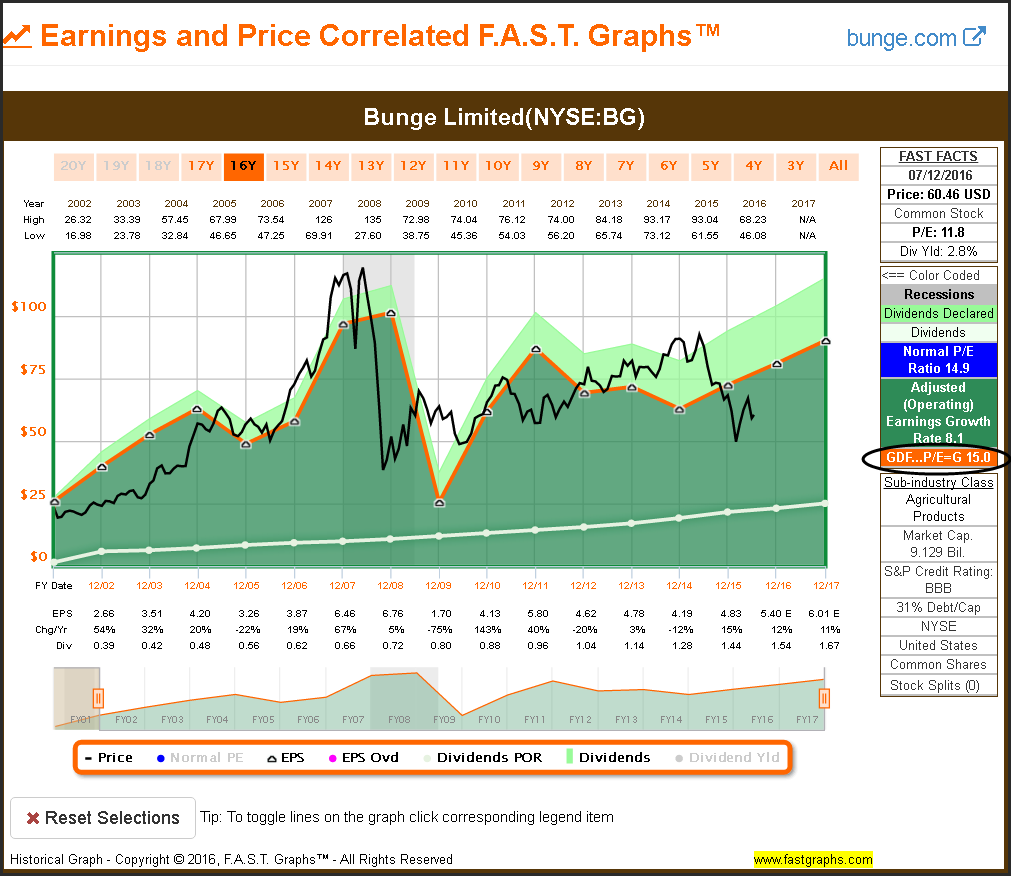
Bunge Limited (NYSE:BG)
The P/E ratio of 15 as a valuation reference is highly correlated with this example. Investing when the P/E ratio was above 15 has clearly been a mistake. However, earnings have been very cyclical over this timeframe.
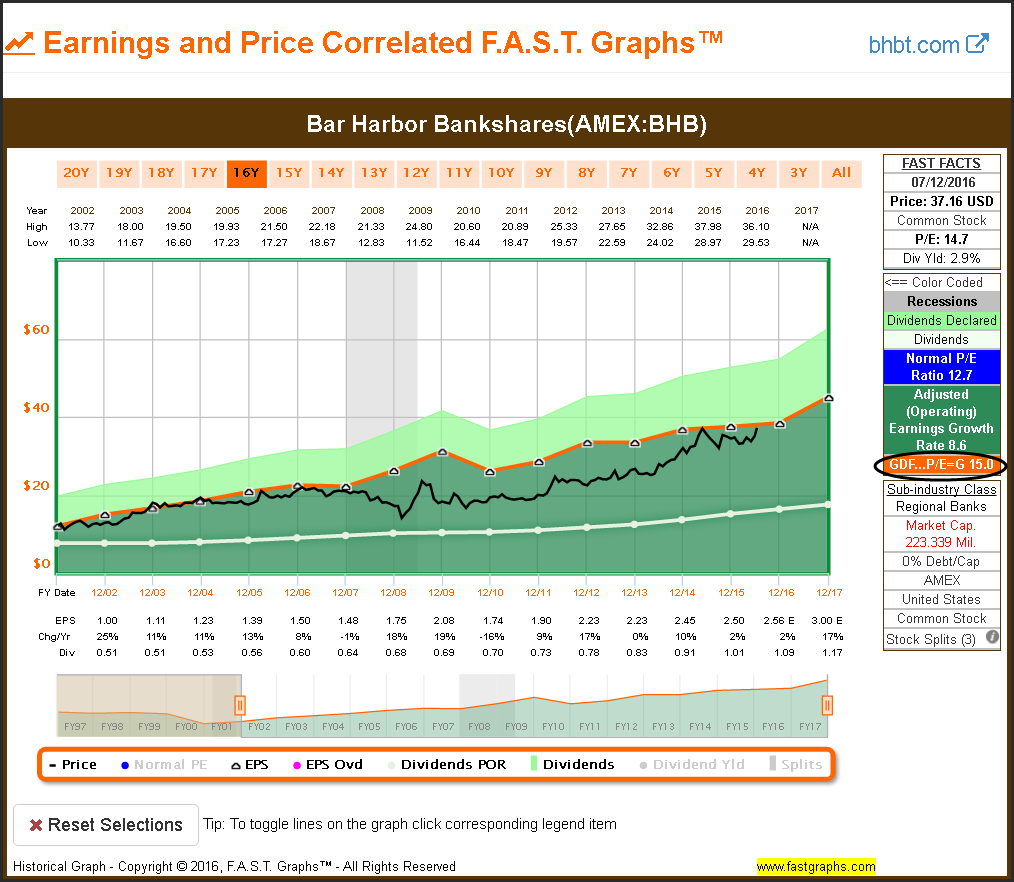
Bar Harbor Bankshares (NYSE:BHB)
Over time this company stock price has tracked earnings and correlated to a P/E ratio of 15. However, investing in this stock when the P/E ratio is below 15 was opportunistic.
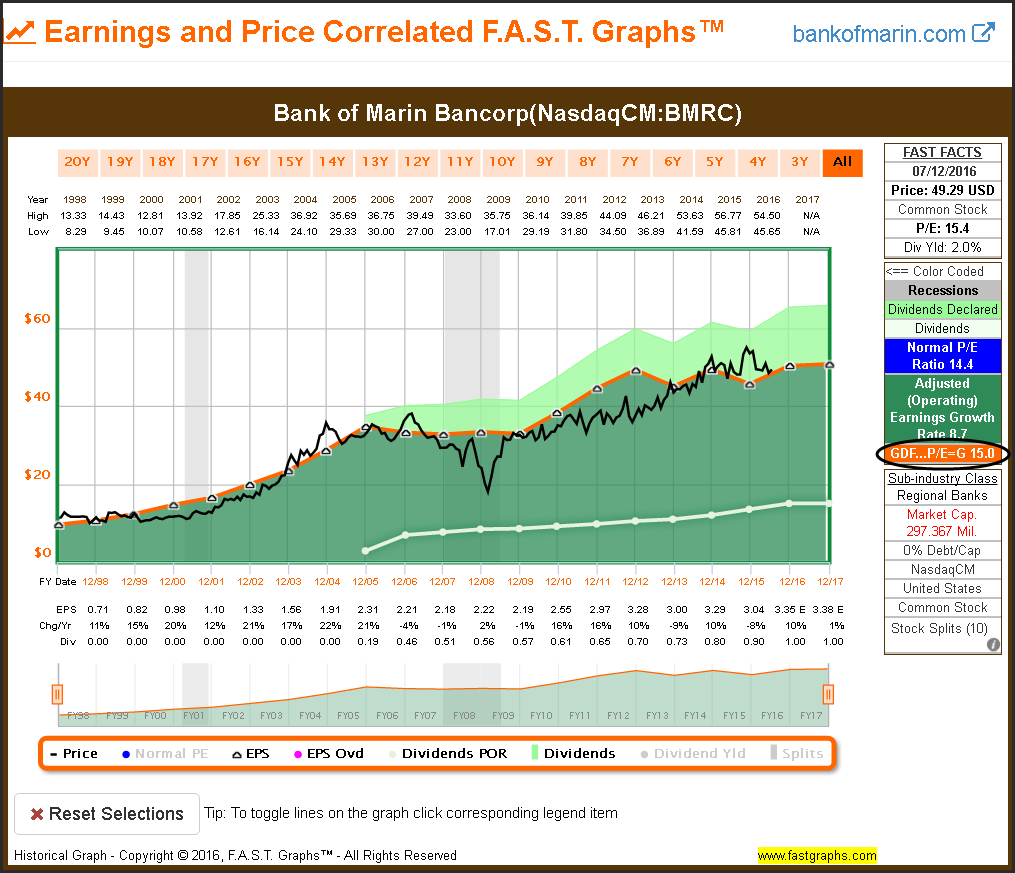
Bank of Marin Bancorp (NASDAQ:BMRC)
The relevance of the P/E ratio of 15 could not be clearer then with this example.
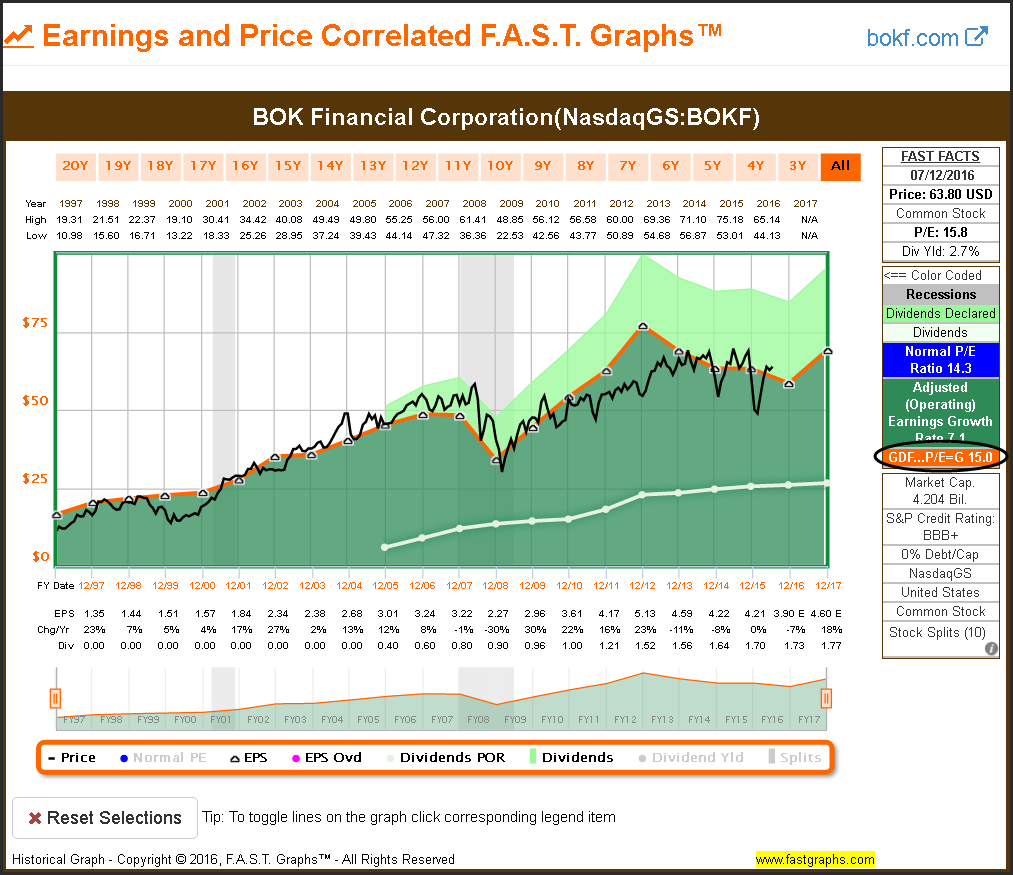
BOK Financial Corporation (NASDAQ:BOKF)
Being only willing to invest in this company with a P/E ratio was 15 or lower would have served you well.
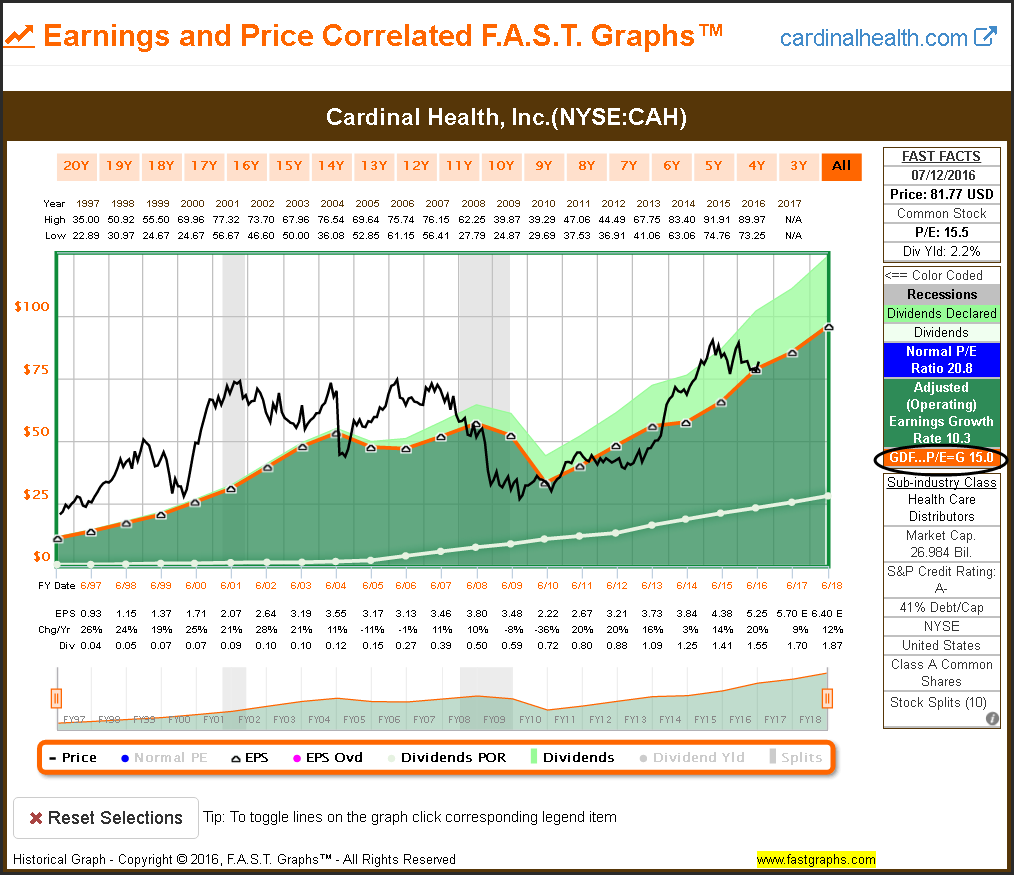
Cardinal Health, Inc. (NYSE:CAH)
Here we see an excellent example of how violating the P/E ratio of 15 as a valuation reference can be damaging to performance. Long periods of underperformance would have resulted from investing in the stock at P/E ratios above 15.
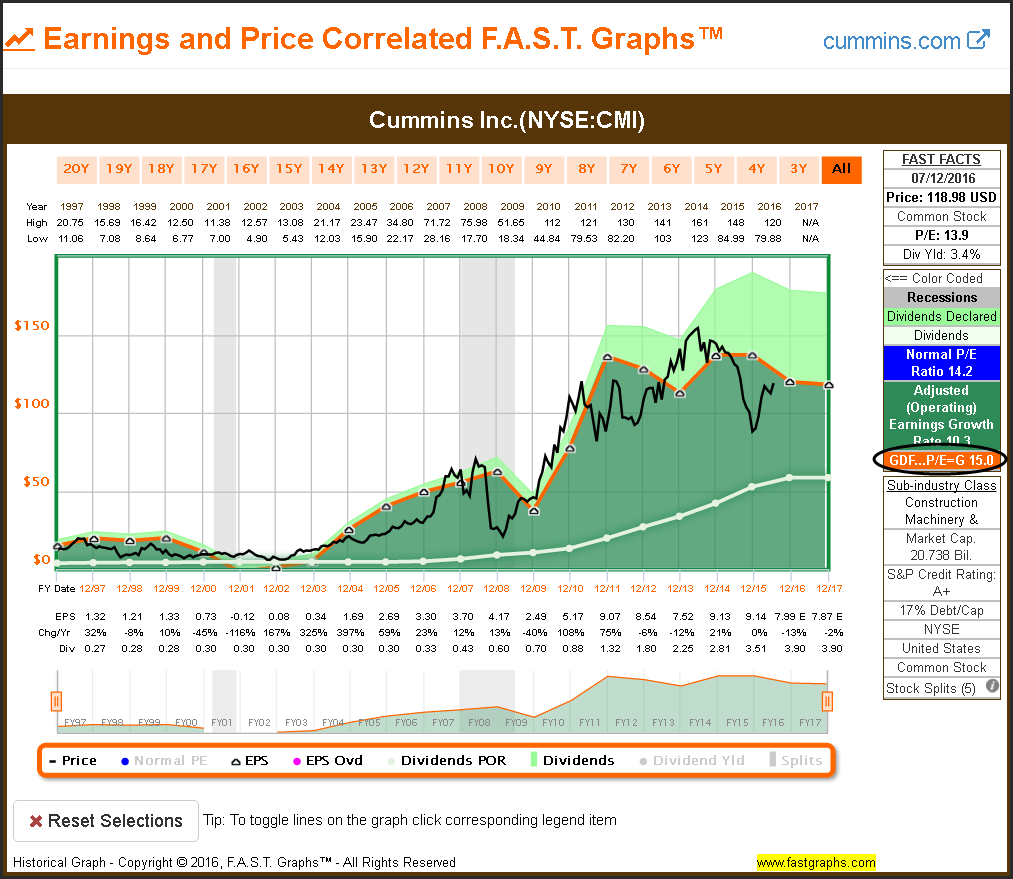
Cummins Inc (NYSE:CMI)
The 15 P/E ratio has been an important valuation reference for this cyclical. Reviewing the earnings and price history suggests that it seems prudent to invest in this cyclical at a P/E below this 15 threshold.
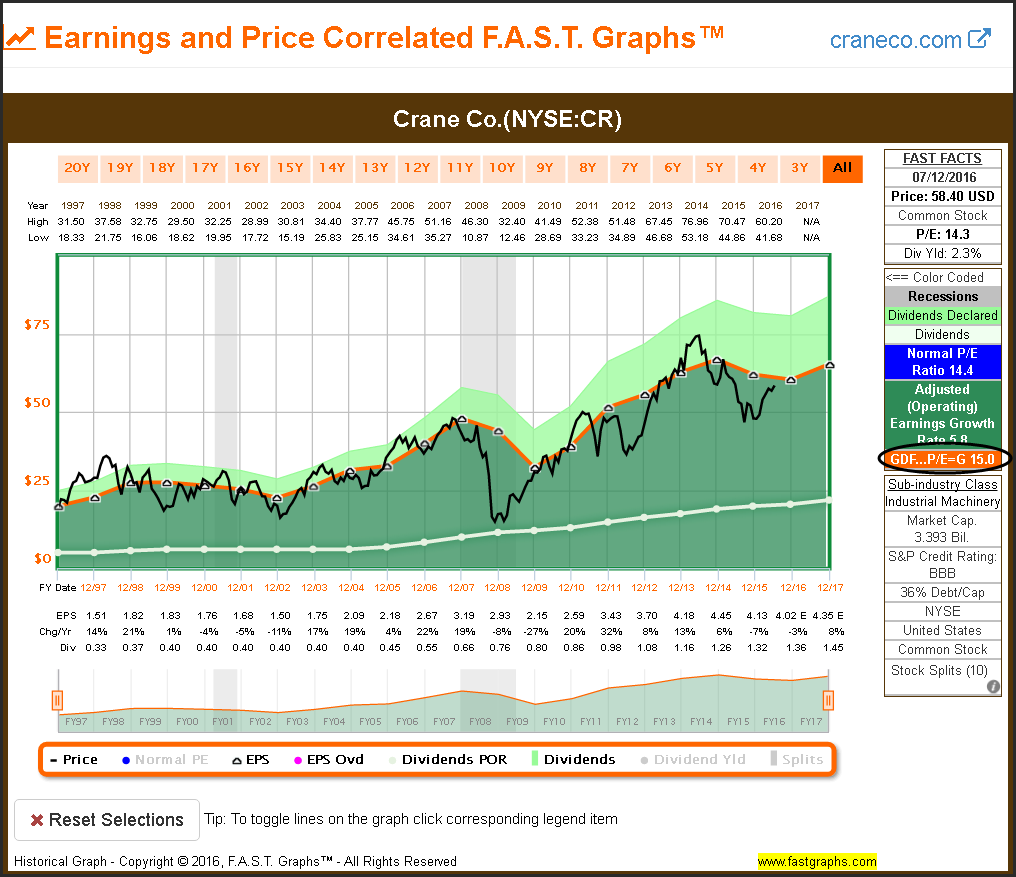
Crane Co (NYSE:CR)
This is an excellent example of the P/E 15 as a rational valuation reference. There are numerous short periods when the price rises above and below this valuation reference, but promptly returns.
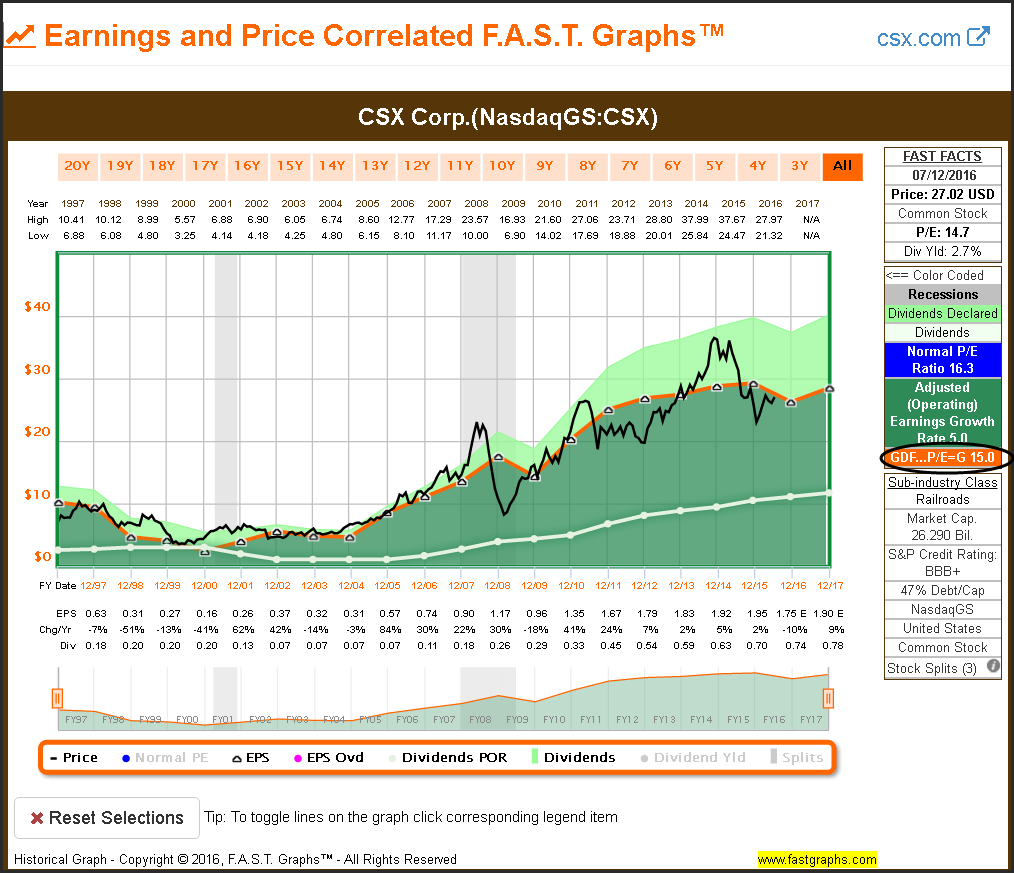
CSX Corp (NASDAQ:CSX)
Once again, another classic example of the P/E ratio of 15 as a sound valuation guide. Investing at a higher valuation always led to a short-term, and for the most part, a long-term mistake.
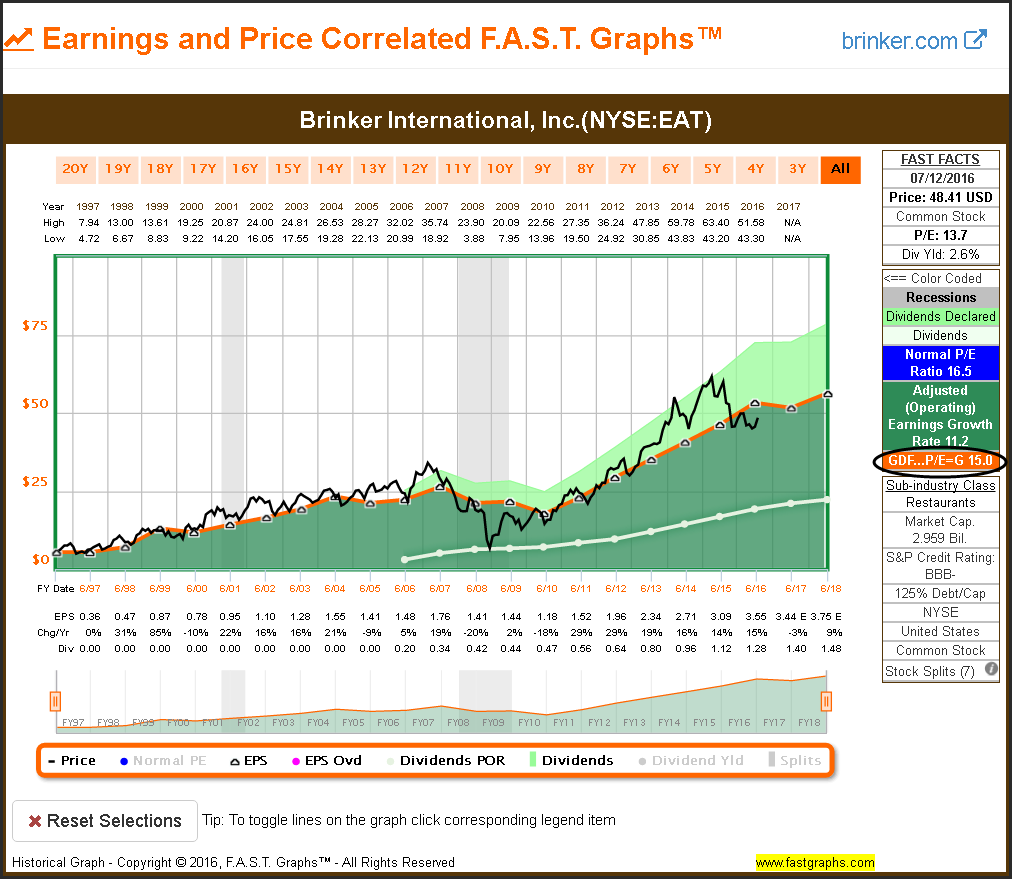
Brinker International Inc (NYSE:EAT)
In this example it is stunning how often the P/E ratio has risen above 15 many times in the past, and even more stunning how quickly price returns to P/E 15. Over the long run price follows the orange P/E 15 line.
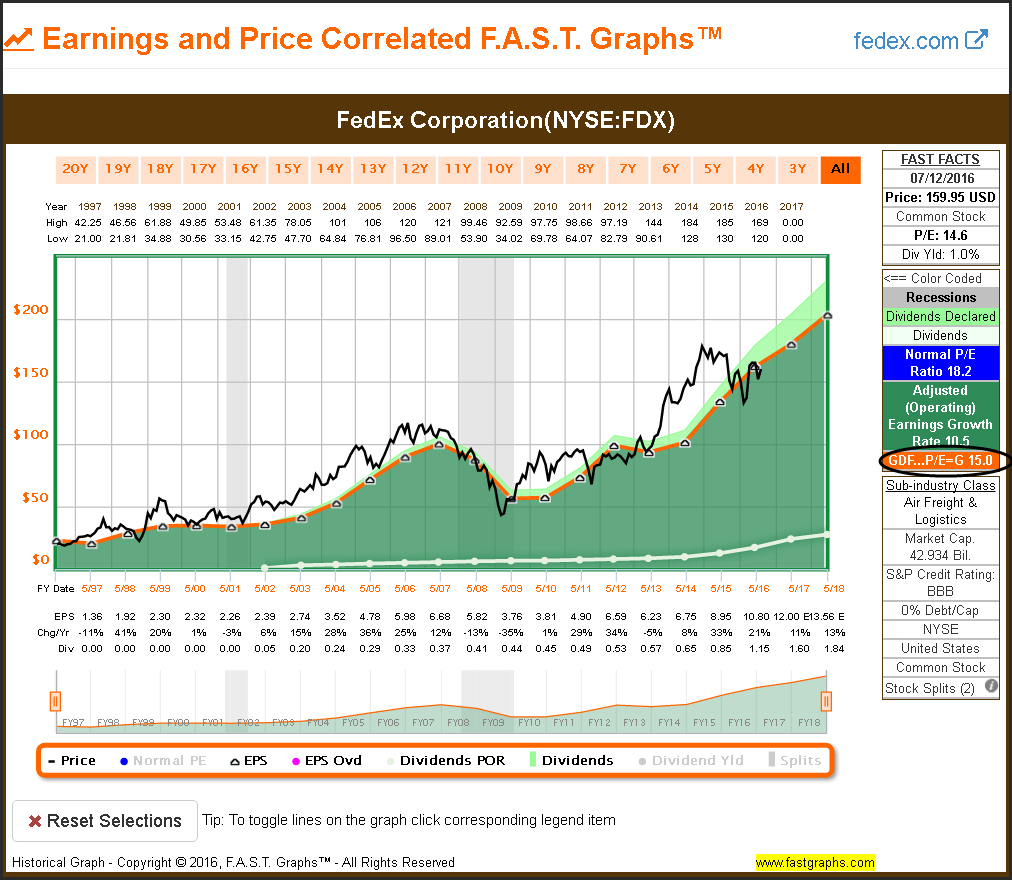
FedEx Corporation (NYSE:FDX)
With this example the market has had a penchant for applying a valuation above the P/E 15 line. Nevertheless, adhering to the 15 P/E valuation reference would have enhanced long term-returns.
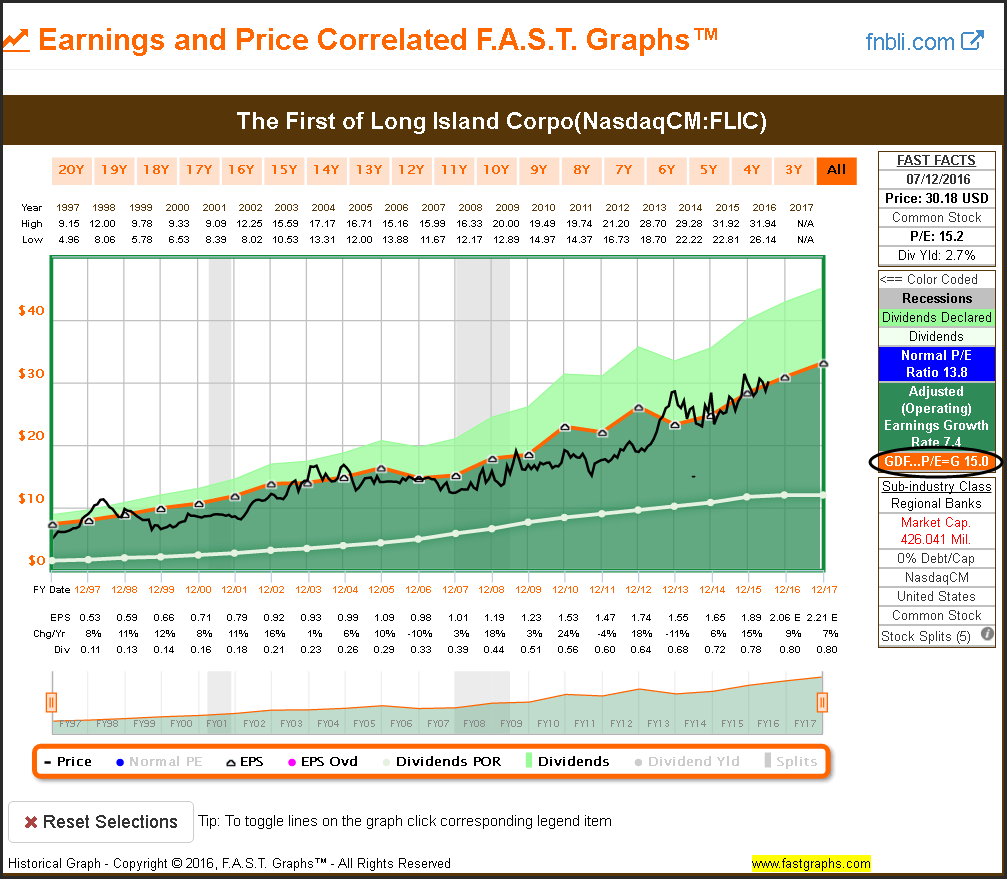
The First of Long Island Corporation (NASDAQ:FLIC)
Investing in this regional bank at a P/E of 15 or below has clearly been a sound decision. The price and 15 P/E correlation has been high.
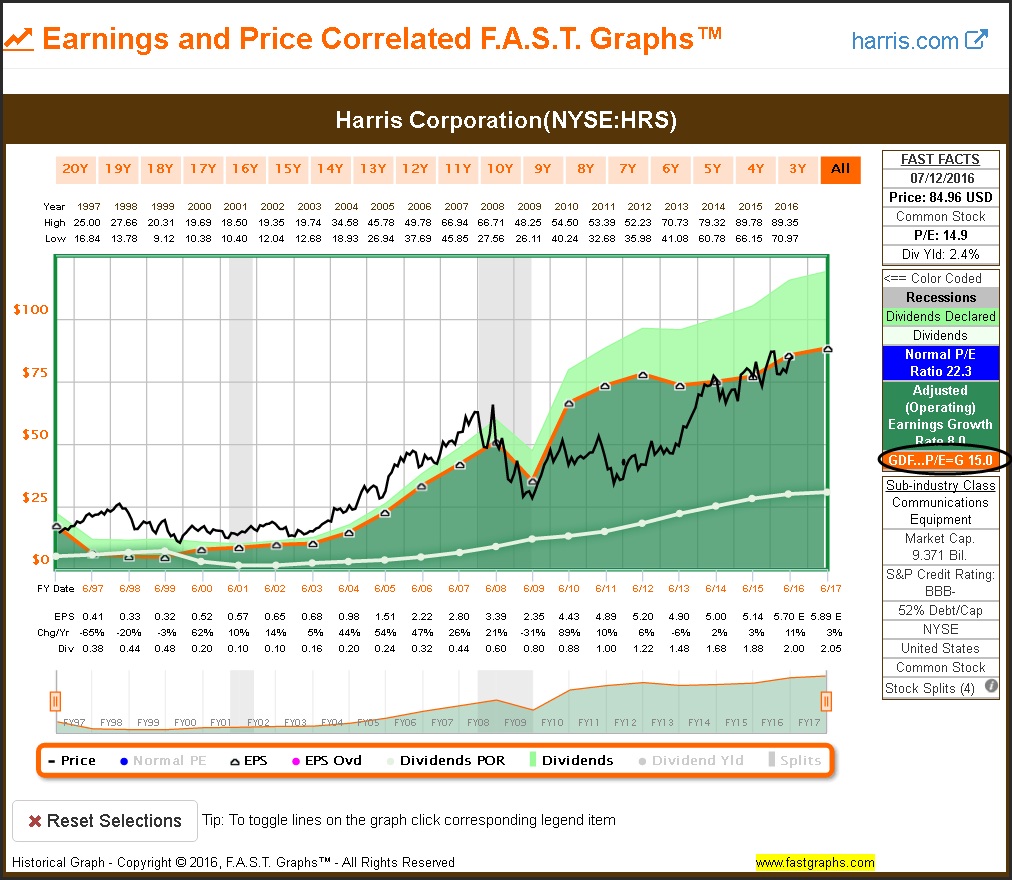
Harris Corporation (NYSE:HRS)
The 15 P/E valuation reference would have kept you out of this example for many years. However, in the long run it would have proved prudent.
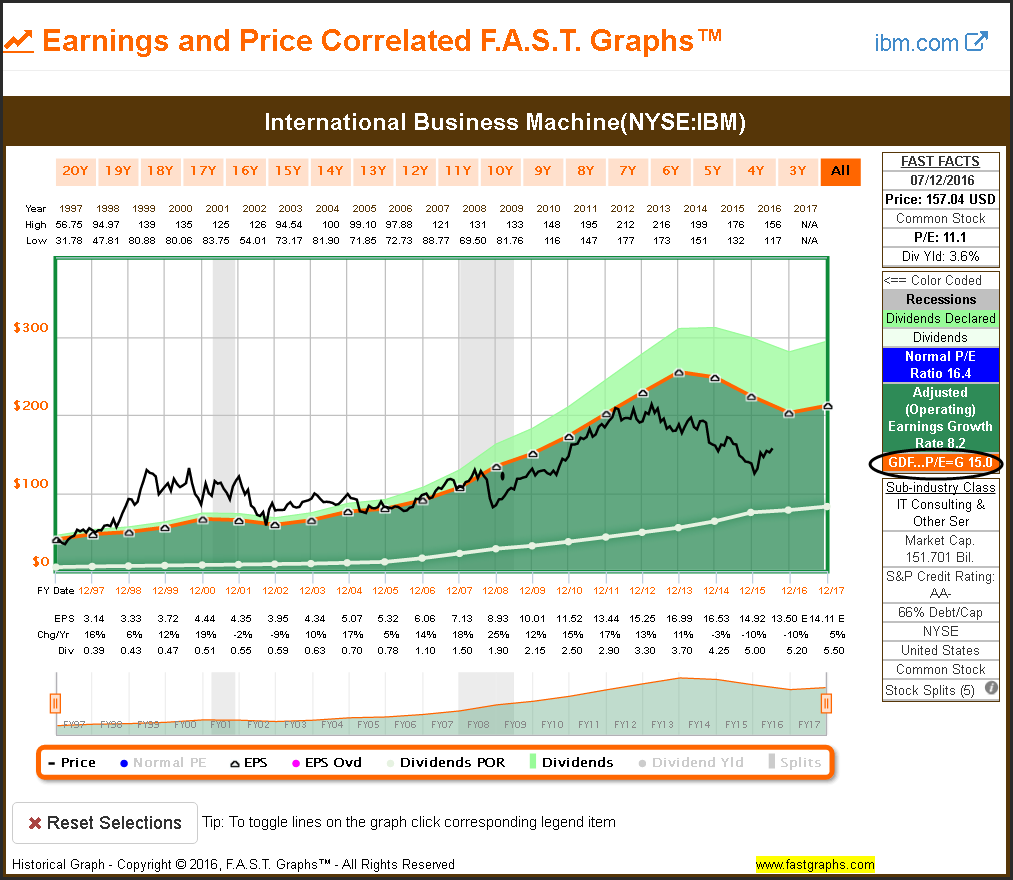
International Business Machine (IBM (NYSE:IBM))
Adhering to the 15 P/E valuation reference during the tech bubble would have avoided years of poor performance as price moved into alignment. Additionally, we see a clear relationship of the price to earnings correlation in recent years. The rising dividend has been the story in recent years.
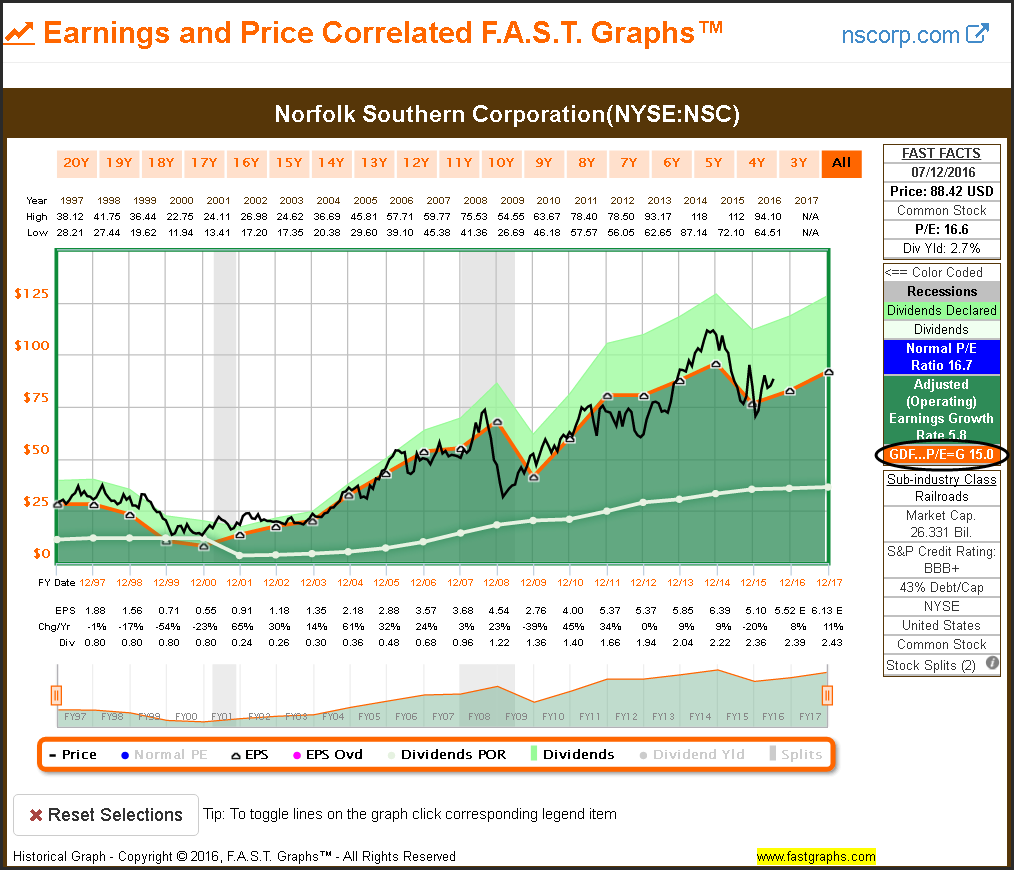
Norfolk Southern Corp (NYSE:NSC)
The importance of the relevance of the 15 P/E ratio as a valuation reference could not be more clear than with this example. The earnings and price correlation at that valuation is high.
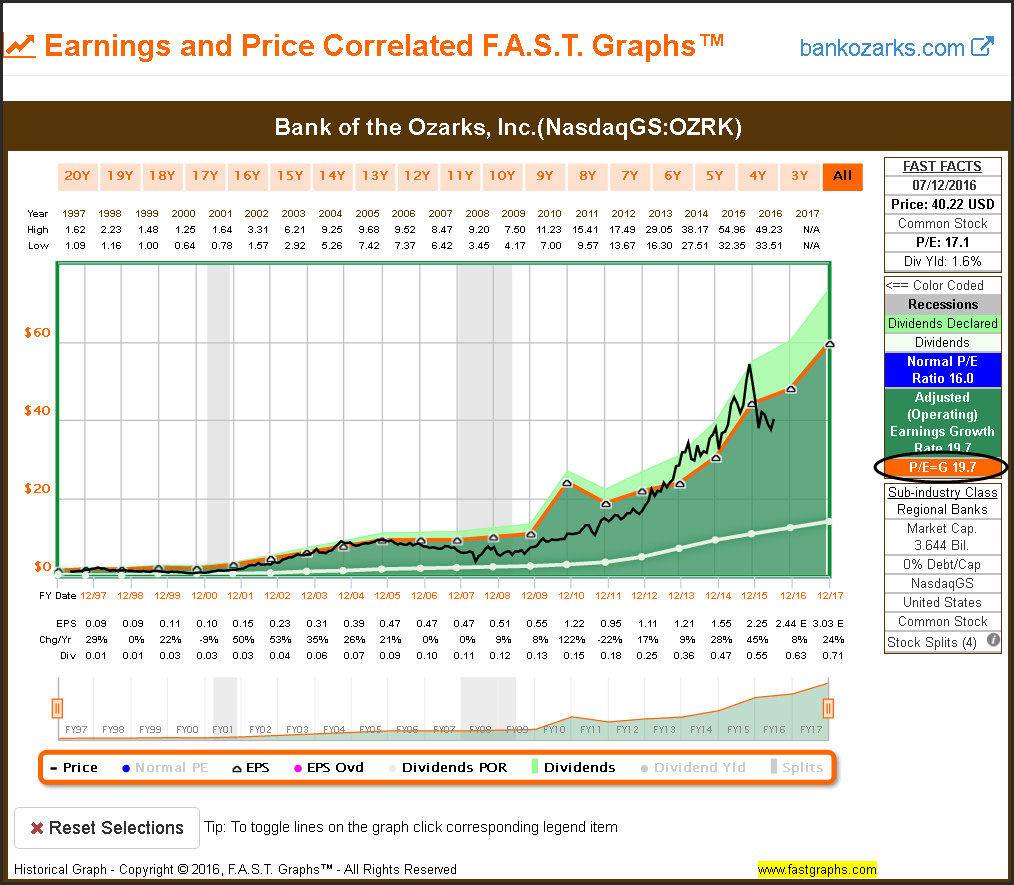
Bank of the Ozarks Inc (NASDAQ:OZRK)
With earnings growth averaging above 15%, a P/E ratio equal to the growth rate was a sound valuation reference with this example. The P/E ratio 15 valuation reference is a strong guide for average companies; However, it is rational to pay a higher valuation for higher growing businesses.
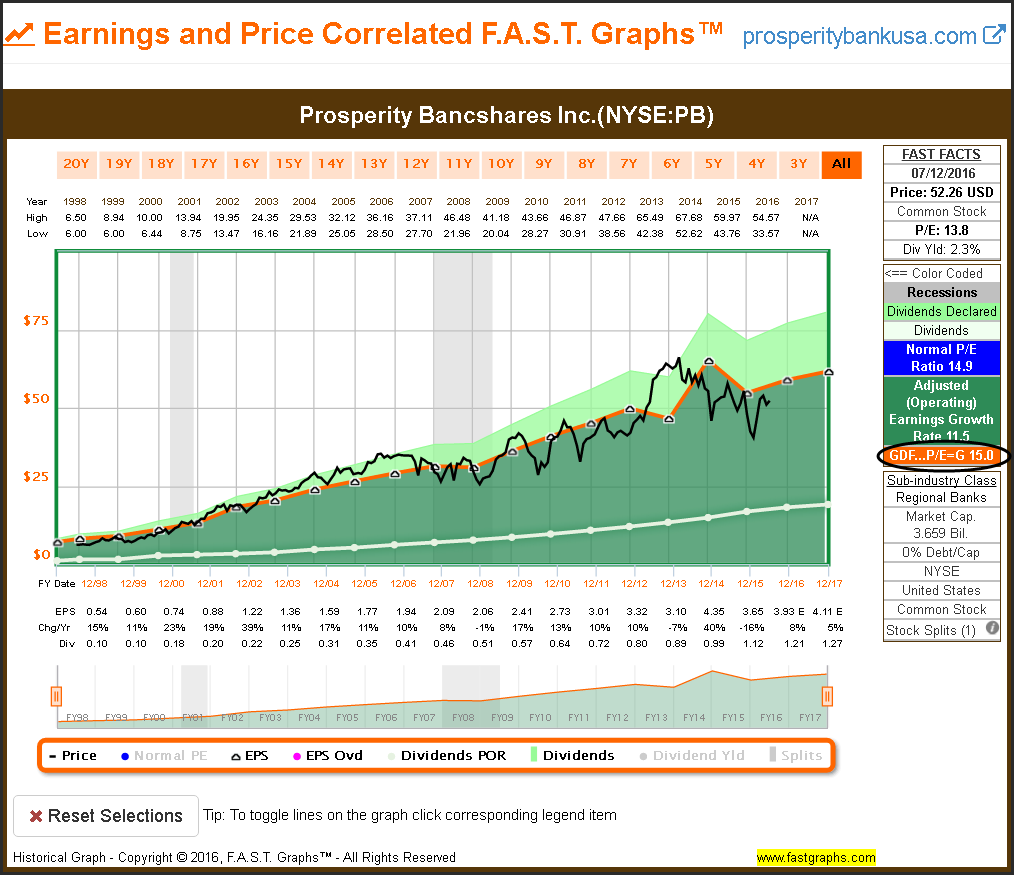
Prosperity Bancshares Inc (NYSE:PB)
Here is another example where the fair value reference P/E Ratio of 15 would serve investors well. Clearly, investing in this regional bank when the valuation was higher than that typically led to poor performance. However, in the long run, price tracked the P/E ratio 15.
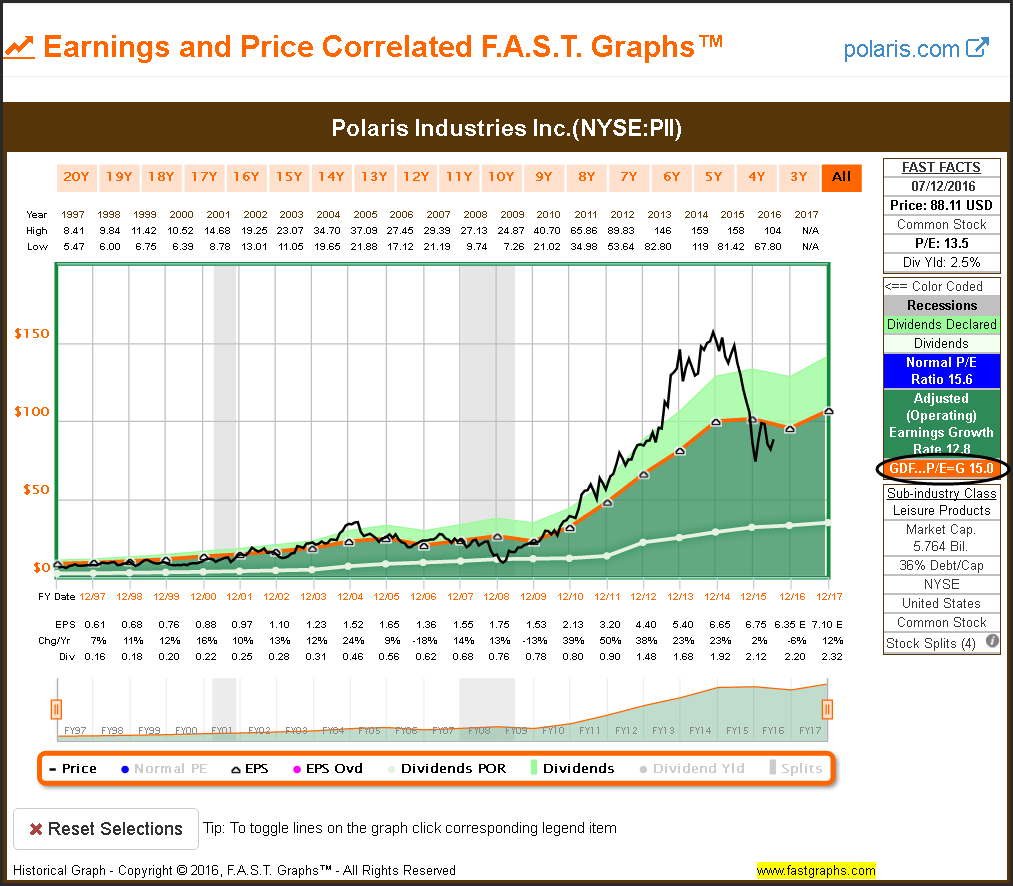
Polaris Industries Inc (NYSE:PII)
In this example, we see the price tracking the P/E ratio of 15 until earnings dramatically accelerated starting in 2010. For the next several years, the company commanded a higher P/E ratio than 15. However, once earnings flattened, the price quickly moved back to the P/E ratio 15 valuation reference.
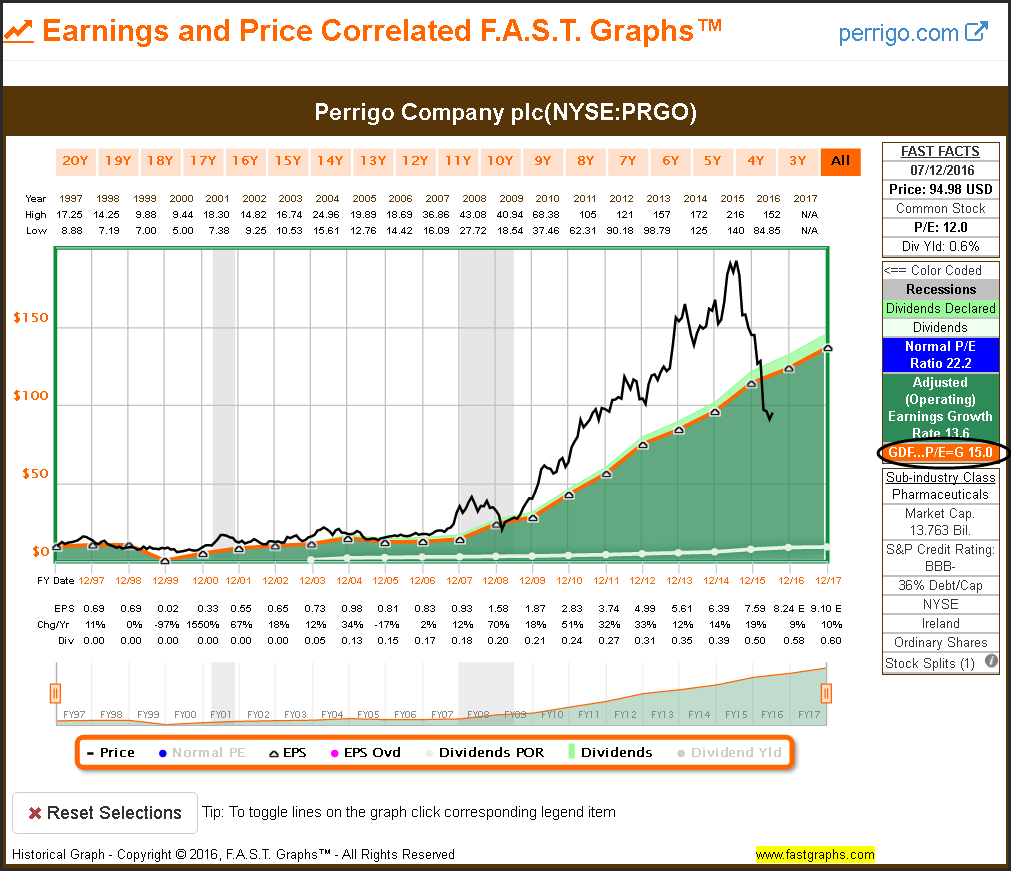
Perrigo Company (NYSE:PRGO)
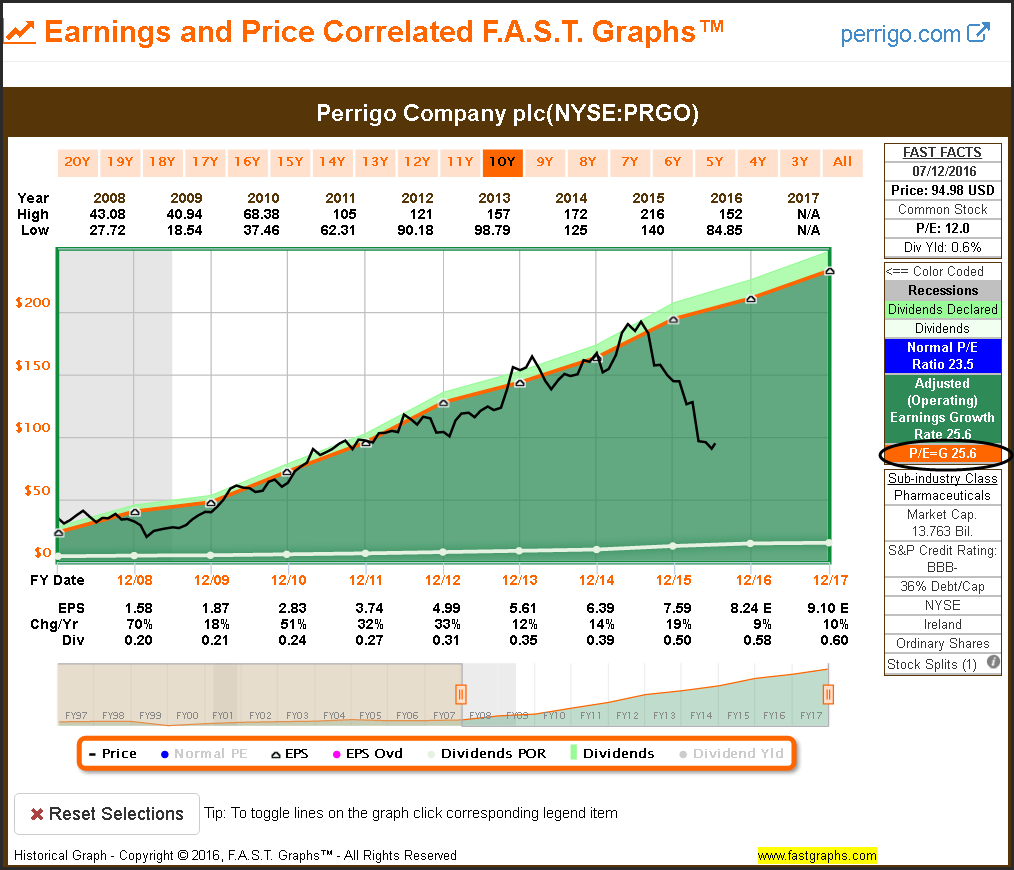
This is a very interesting example where price tracked the P/E ratio of 15 until earnings began accelerating in 2008. For several years this company has traded at a much higher P/E ratio. For clarity, I will be providing an additional graph for this timeframe.
With this shorter timeframe, we see an example of stock price trading at a P/E ratio equal to its growth rate of 25.6. When earnings growth is above 15%, a P/E ratio higher than 15 is justified due to the compounding high growth represents. However, note what happened to stock price when the earnings growth began to slow down.
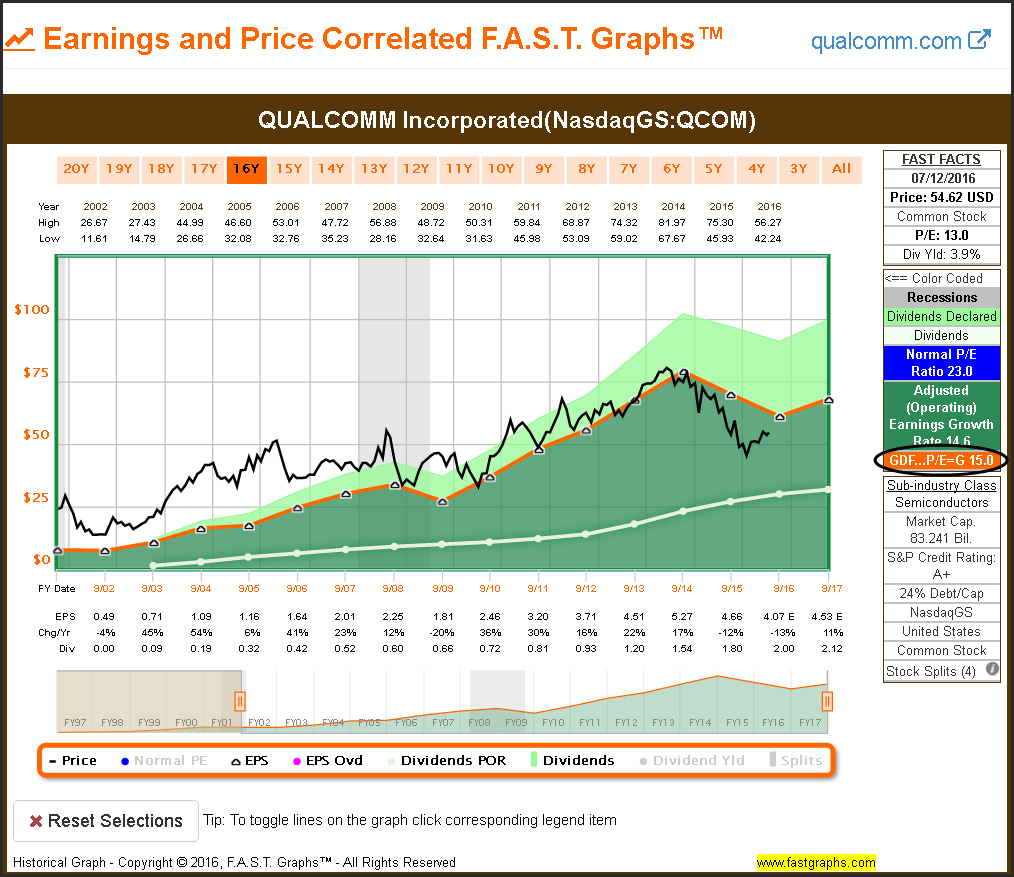
QUALCOMM Inc (NASDAQ:QCOM)
This example illustrates the danger of investing in a stock when its P/E ratio is above 15. Even though the company’s earnings and dividend growth were strong, the stock price had nowhere to go but sideways for many years.
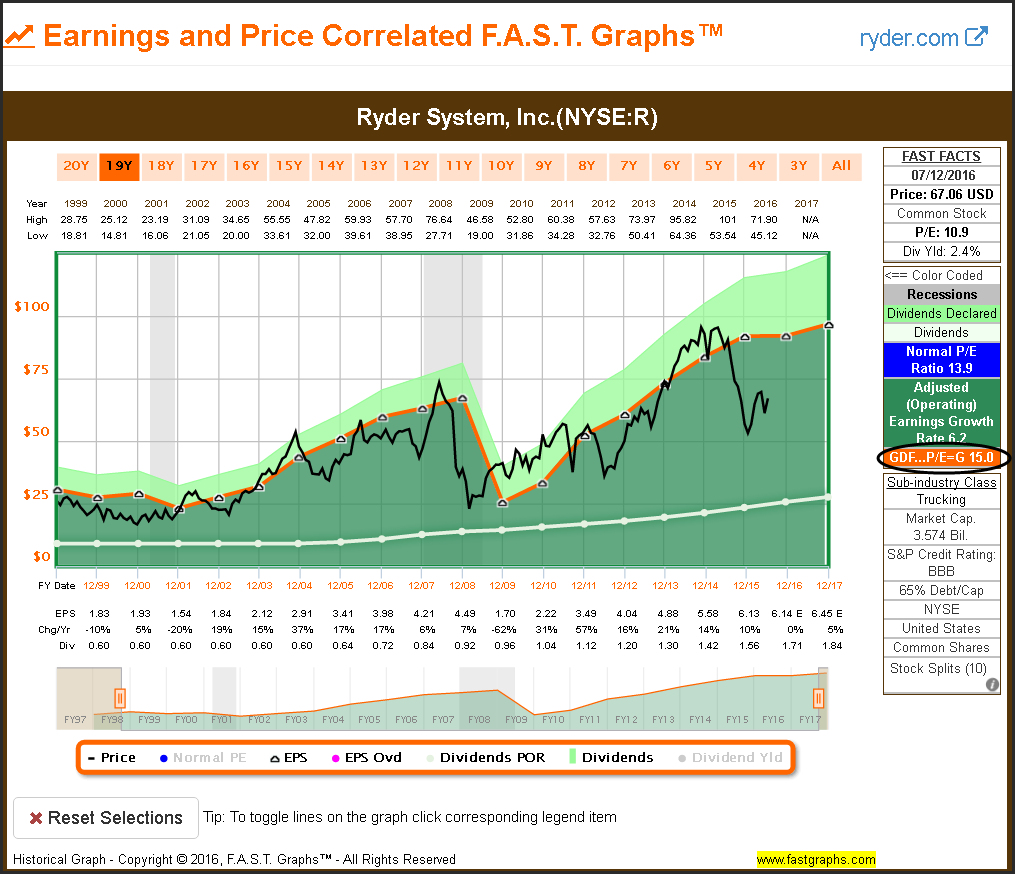
Ryder System Inc (NYSE:R)
This example clearly illustrates the relevance of the P/E ratio of 15 as a valuation reference. However, it also illustrates what can happen when earnings are falling. The fair valuation reference P/E ratio of 15 is very relevant as long as the company continues to grow earnings in the future.
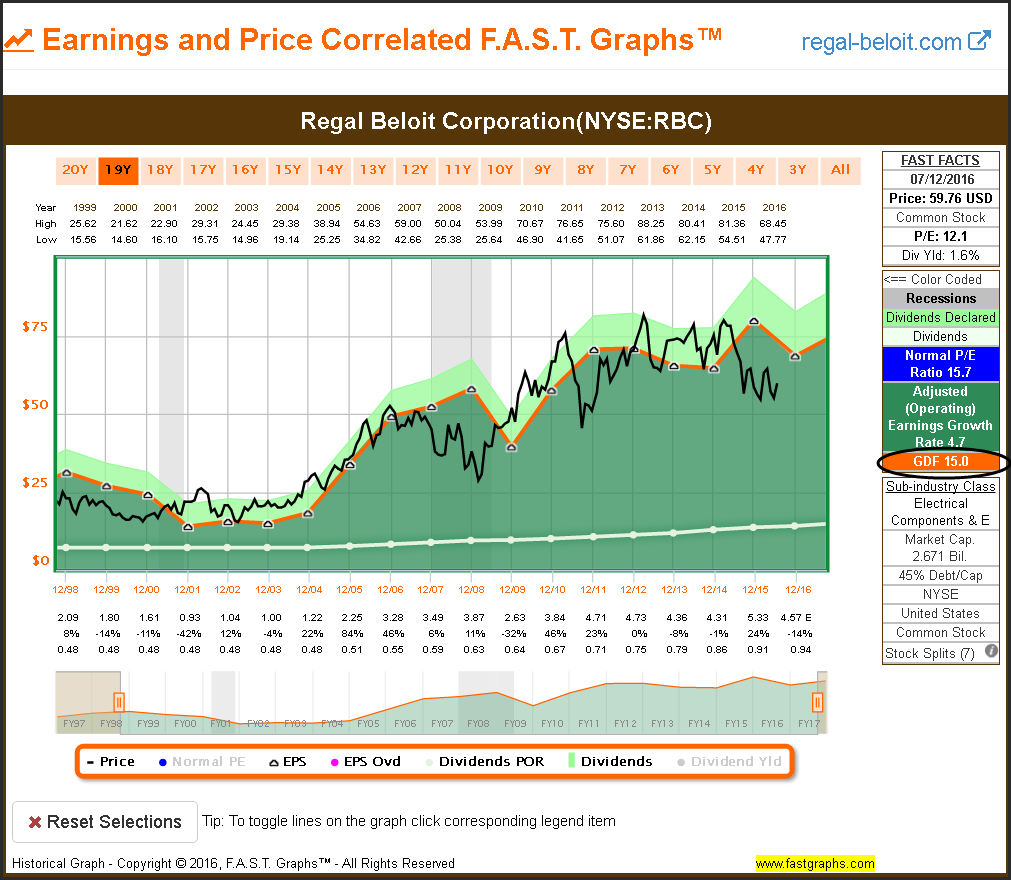
Regal Beloit Corporation (NYSE:RBC)
Once again we see a company’s stock price tracking a P/E ratio of 15 over the long run. This principle applied even though earnings were very cyclical.
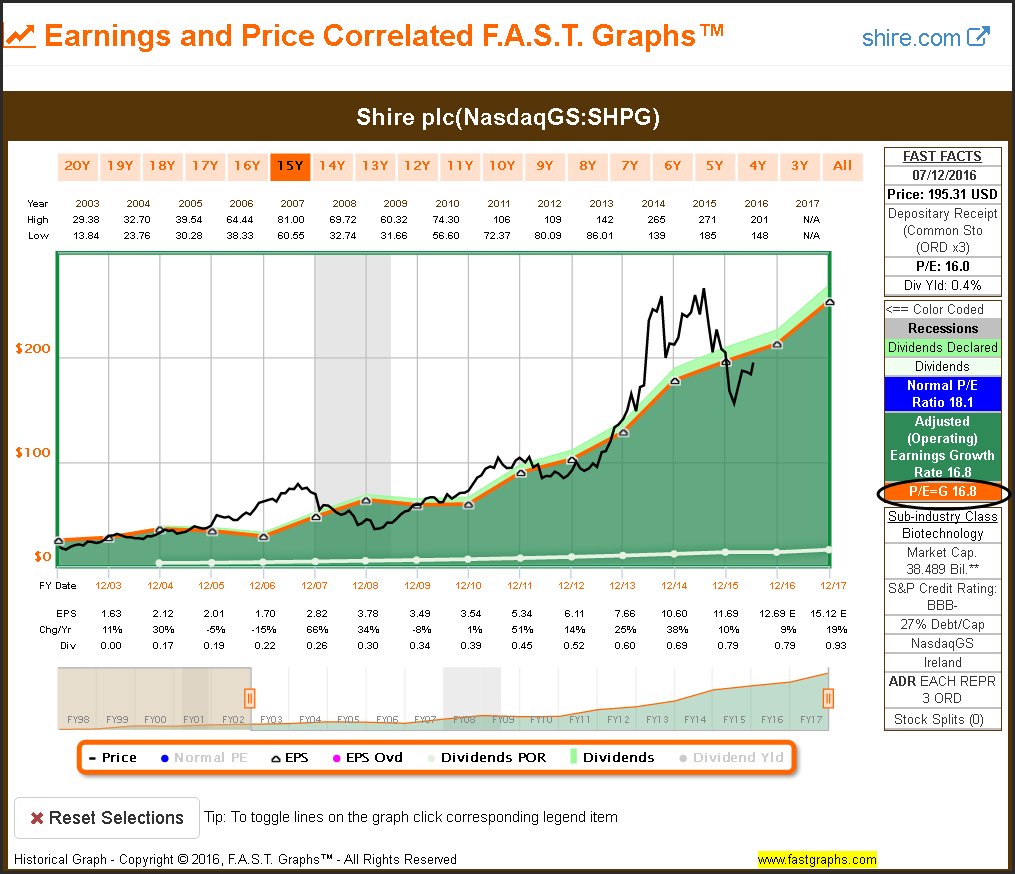
Shire (NASDAQ:SHPG)
This is another example where a P/E ratio above 15 is rational because earnings growth averaged more than 15% per annum. However, the long-term relationship between price and earnings as a valuation reference remains profound.
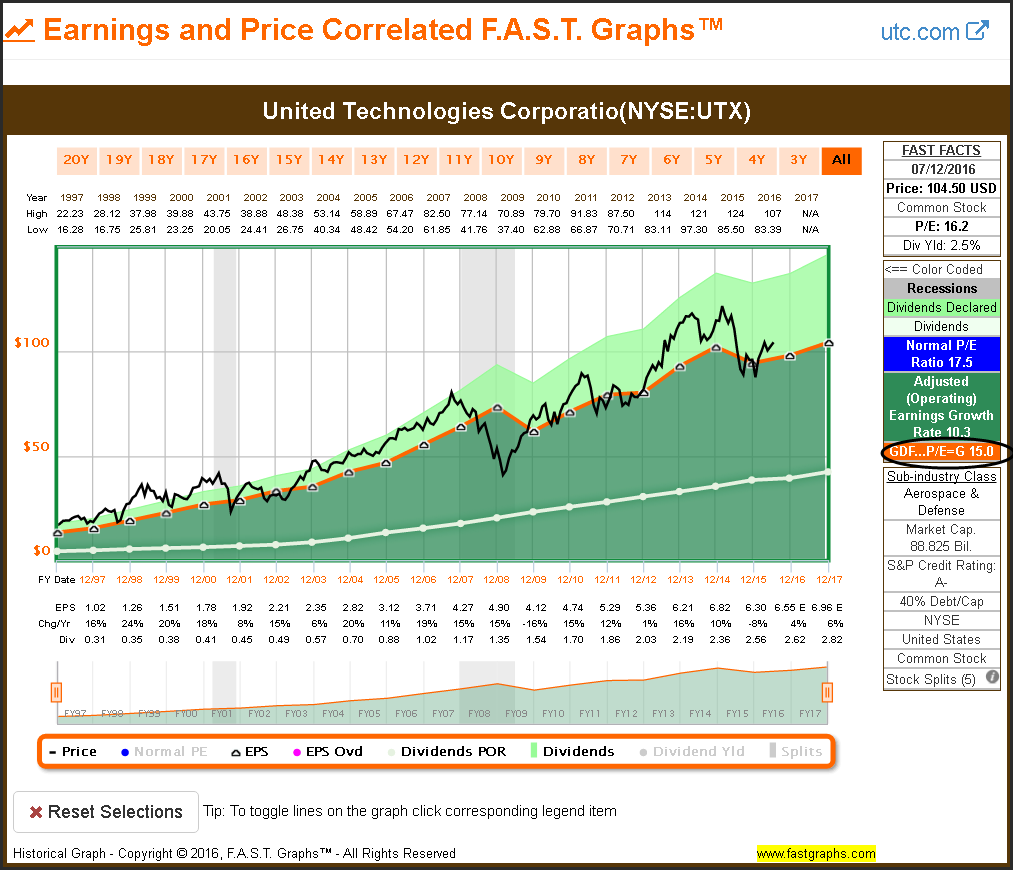
United Technologies Corporation (NYSE:UTX)
Although the market shows a history of placing a premium valuation on this blue-chip dividend growth stock, the P/E ratio of 15 still has relevance. Patiently waiting to invest in this stock when its P/E ratio was 15 or lower would produce better returns at lower levels of risk.
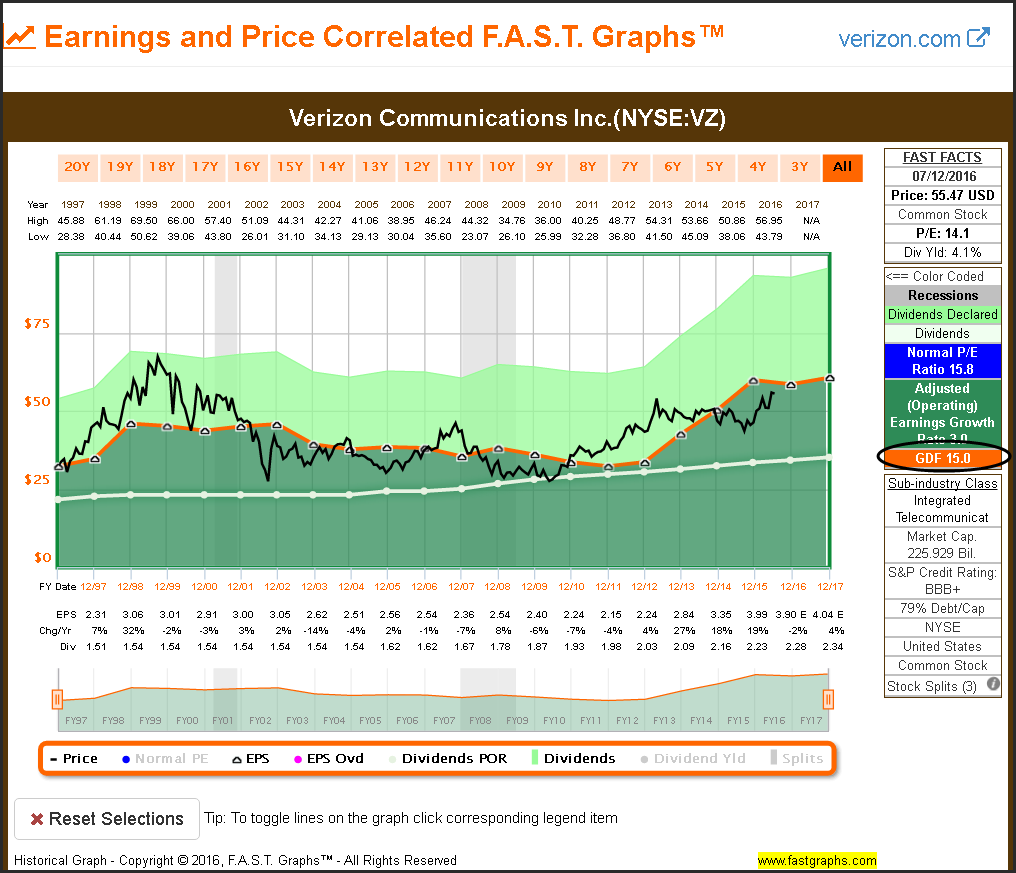
Verizon Communications Inc (NYSE:VZ)
With this example we see the correlation of price to a P/E ratio of 15 even during a long stretch of weak earnings growth. The point here is that the P/E ratio of 15 is a valuation reference, but it does not automatically ensure good returns. Earnings growth has to follow.
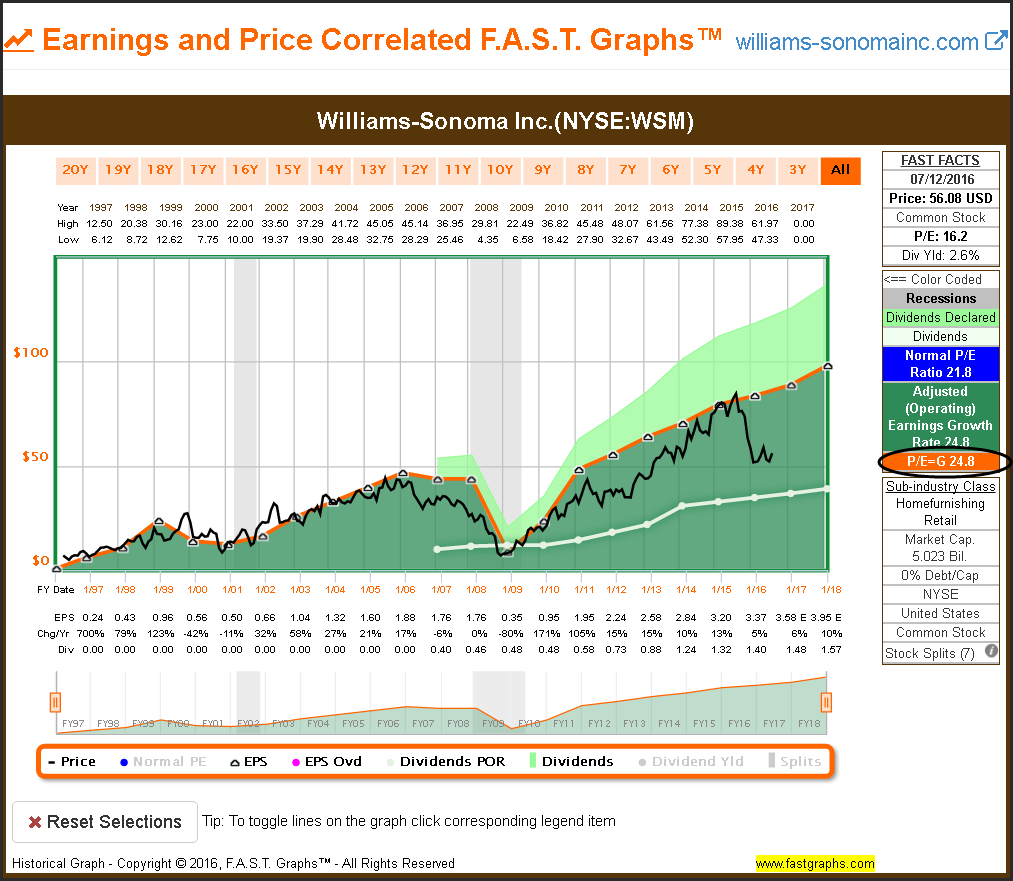
Williams-Sonoma Inc (NYSE:WSM)
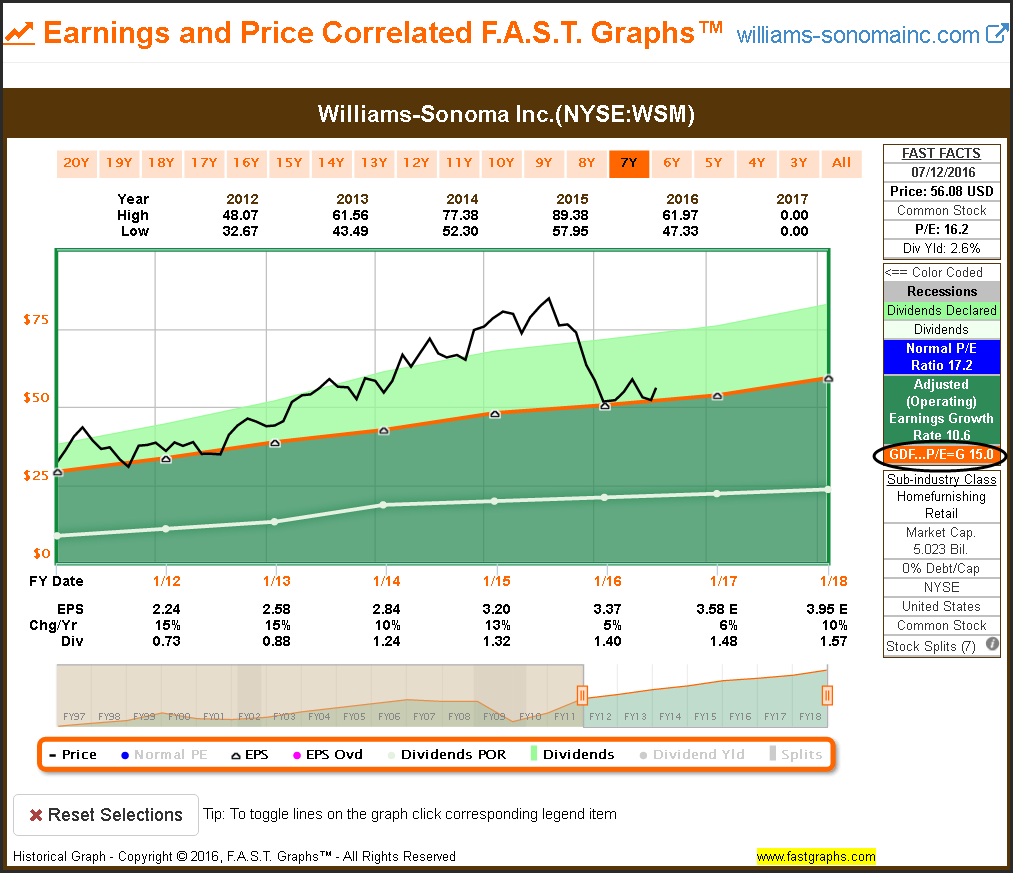
Here we see another example where a high rate of earnings growth justifies a higher P/E ratio than 15. In this case, fair value was equal to the company’s growth rate of 24.8%. However, I have also added a second shorter graph for this example to illustrate how a P/E ratio of 15 becomes relevant when earnings growth slows.
Since earnings growth only averaged 10.6% since 2011, the 15 P/E ratio fair valuation reference became extremely relevant. Higher P/E ratios eventually gave way to sound valuation.
Summary and Conclusions
If you spent time reviewing the graphs in this article it should now be clear to you how relevant the P/E ratio of 15 truly is as a valuation reference. However, you should also recognize the importance of the word “reference” in that statement. Additionally, you should now immediately understand that if you invest in a company when its P/E ratio is higher than 15, you are paying a high price for the company’s earnings power.
Based on the mathematics behind this valuation reference, I believe it is only rational to pay a higher P/E ratio when you are absolutely confident that the company’s future earnings growth will be strong. I refer to this as earnings growth yield. If future earnings growth turns out to be high, then you will be purchasing future earnings at a reasonable valuation. On the other hand, if earnings growth is expected to be single digits, I contend that paying any P/E ratio above 15 is too high a price to pay. You can still make money doing this, but you will make less and take on more risk to earn those lower returns. This includes receiving less dividend income as well.
Finally, there are other factors to consider before actually making an investment in a stock even when the P/E ratio is 15 or lower. For example, if earnings growth is expected to fall, then a current P/E ratio of 15 may actually be too high of a high valuation. There are also many other fundamental metrics that should be considered. Nevertheless, I believe that investors should recognize and keep the mathematics behind a P/E ratio of 15 in the forefront of the minds. But there is one thing that I feel certain about, and that is that a P/E ratio of 15 is far from an overly simplistic valuation reference.
Disclosure: Long VZ,UTX,AAN,ABC,AMP,CMI,CR,EAT,FDX,IBM,NSC,QCOM,GD,HCP>
Disclaimer: The opinions in this document are for informational and educational purposes only and should not be construed as a recommendation to buy or sell the stocks mentioned or to solicit transactions or clients. Past performance of the companies discussed may not continue and the companies may not achieve the earnings growth as predicted. The information in this document is believed to be accurate, but under no circumstances should a person act upon the information contained within. We do not recommend that anyone act upon any investment information without first consulting an investment advisor as to the suitability of such investments for his specific situation.
