Get 40% Off
👀 👁 🧿 All eyes on Biogen, up +4,56% after posting earnings. Our AI picked it in March 2024.
Which stocks will surge next?
Unlock AI-picked Stocks

The Yield Inversion No One Is Talking About

Published 08/19/2019, 07:10 AM
Updated 09/20/2023, 06:34 AM

This post was written exclusively for Investing.com

Is the future about to get brighter for stocks? With inversion mania taking hold across the investing landscape, there's one important example that appears to be escaping everyone’s attention: the inversion between the S&P 500 dividend yield and the 10-year U.S. Treasury yield.

Recently, the yield on the 10-year note fell below that of the S&P 500. If history repeats itself, stocks could be about to get a powerful boost.

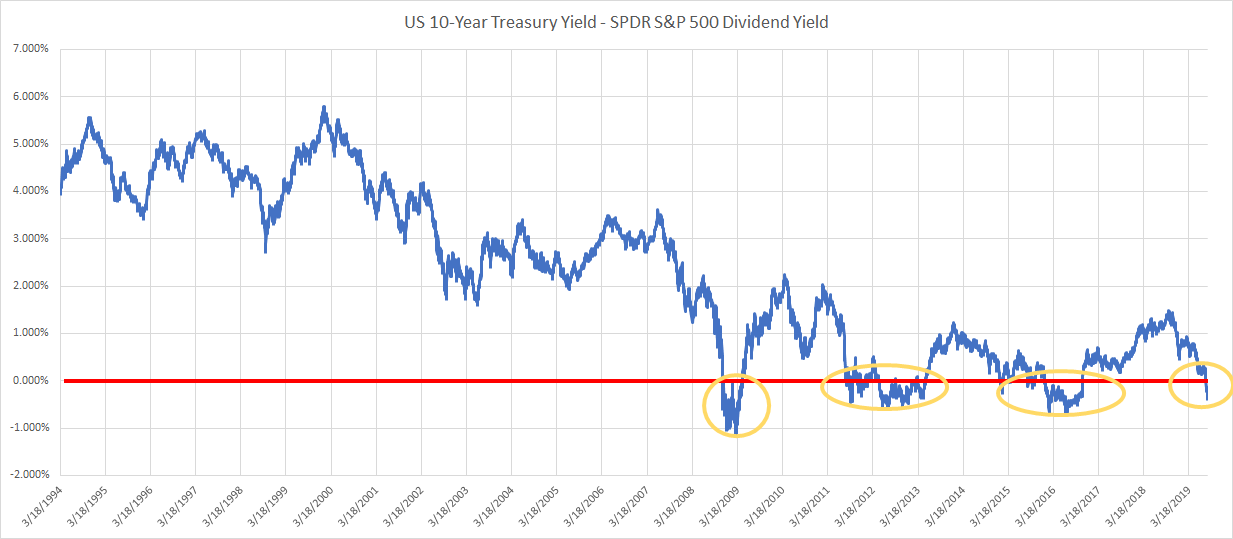
Using the dividend yields of the SPDR S&P 500 ETF (NYSE:SPY) as a proxy for the S&P 500, and the 10-year Treasury yield have inverted just three times since 1994. Those inversions occurred during the periods of 2009, 2012 to 2013, and 2015 to 2016.

Now, that same type of inversion is taking place again. Additionally, during the 2012 and 2015 periods, the equity market also went through a nearly two-year period of consolidation. In those instances, once the inversion reversed, stocks took off, leading to a significant rise in the equity market.
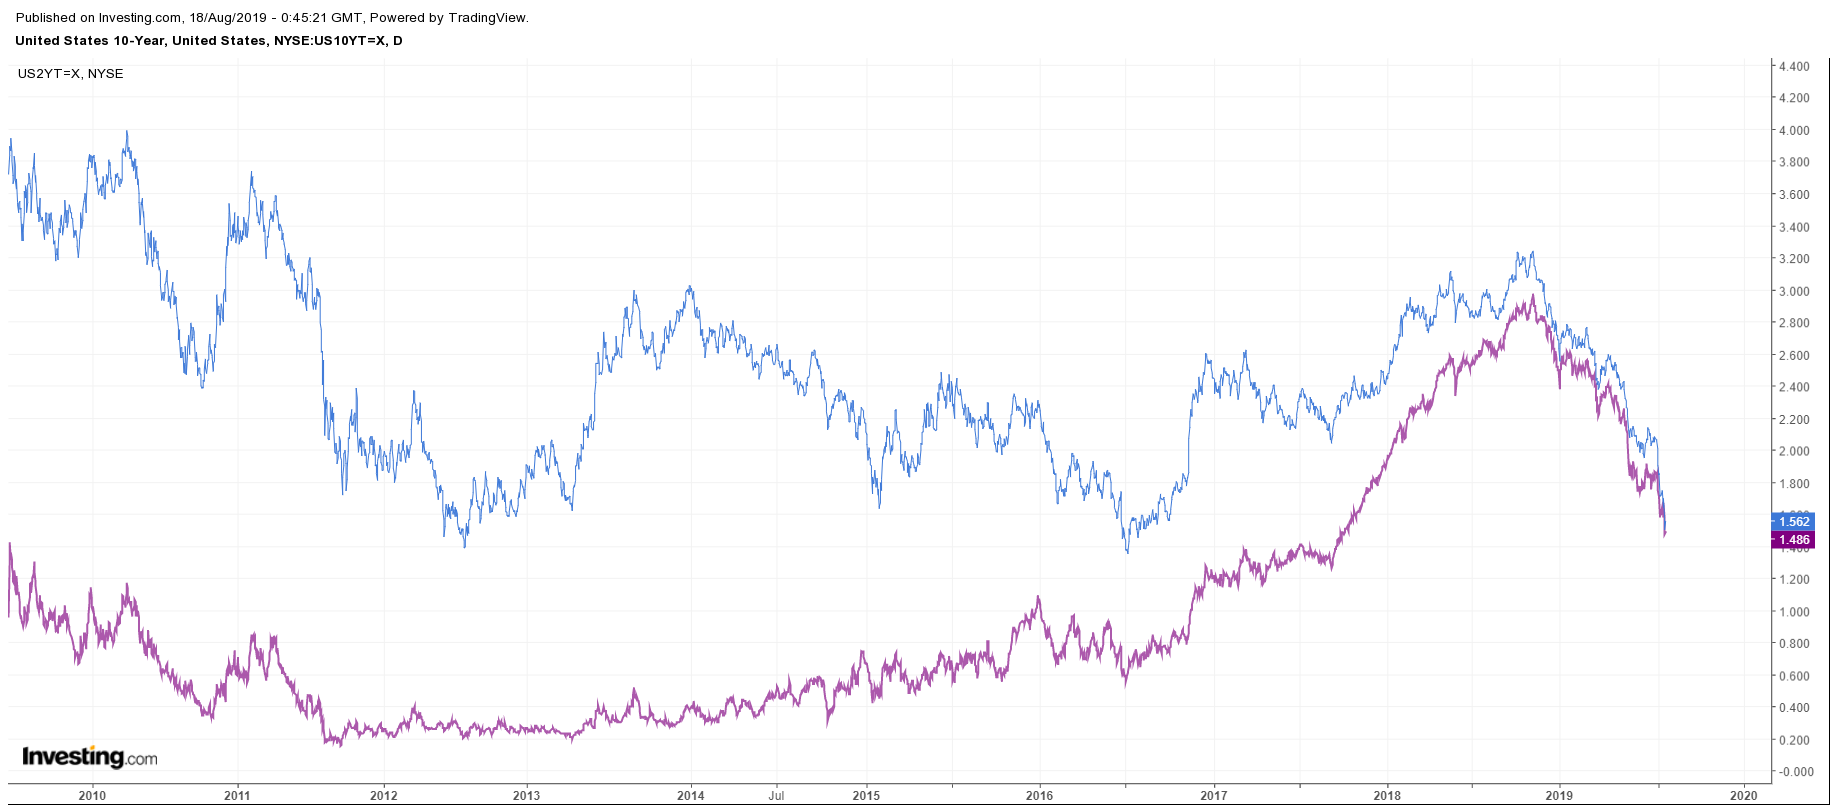
2Y:10Y Treasury Yields Daily

10-Year/2-Year Inversion

While worries about the 10-year yield and the 2-year yield inversion have been hogging the headlines, few have been paying attention to what was happening with the SPY (NYSE:SPY) dividend yield. Since the end of July, the 10-year Treasury yield has plunged to around 1.55% from approximately 2.1%. That deep dive led to the Treasury rate falling below the SPY ETF dividend yield of 1.88% and resulted in the spread falling to a negative 0.33%. The difference between the two rates is now at its lowest level since November 2016.

3rd party Ad. Not an offer or recommendation by Investing.com. See disclosure here or remove ads .

US 10-Y:SPY Yield Ration

Deja Vu?

The inversions in the past also took place during periods of equity market stagnation. During the inversion of 2015 and 2016 the equity market was moving sideways, from March 2015 until November 2016, with the S&P increasing by just 0.34%—an equity market consolidation that lasted for nearly 18 months.

That was followed by the post-presidential election rally in the equity market, with the S&P 500 increasing by around 35% through January 2018.

A similar thing also happened from April 2011 through July 2013 when the S&P 500 increased by just 0.2%, while the 10-year yield also traded below the S&P 500 ETF dividend yield. The S&P 500 then went on to advance by a stunning 55% from July 2012 to March 2015.
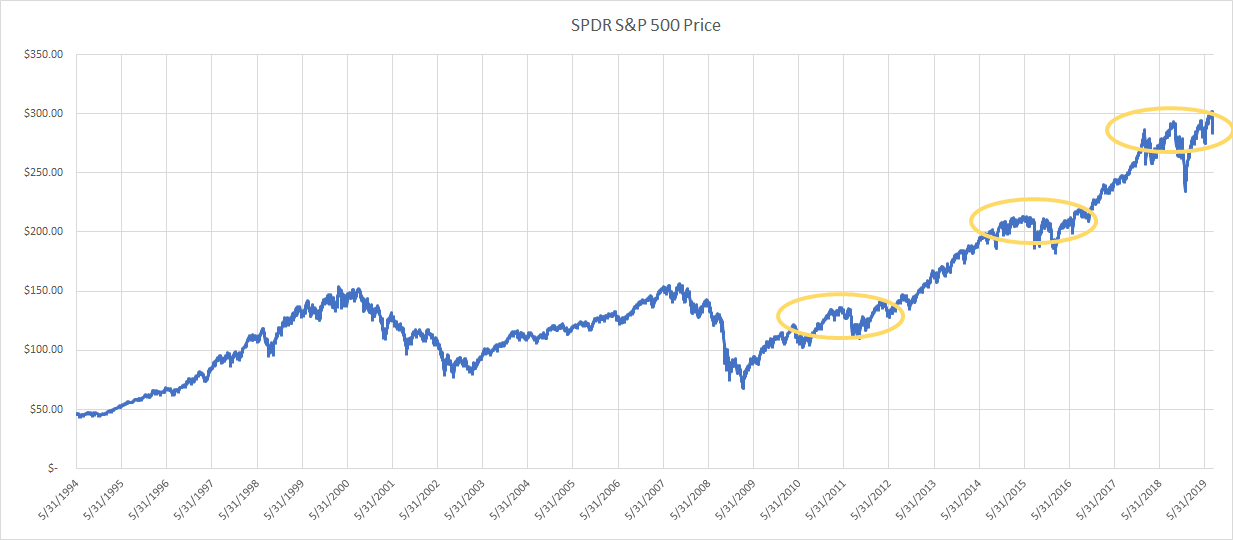
SPY Price 1994-2019

Amazingly, the past 18 months have seen several similarities to the prior periods mentioned above, including a period of equity market stagnation. Since the end of January 2018 through today, the S&P 500 has increased by just 0.85%, mirroring what occurred in both the 2012 and the 2015 doldrums.

If history repeats itself, then the equity market may be getting ready for its next major leg higher.

History Repeating Itself?

It certainly seems possible that the equity market will soon see its next significant advance. Given the option between owning stocks or bonds in this low rate environment, the choice seems to favor that of owning stocks.

As well, stocks offer the added advantage of earnings growth and stand to benefit as the global economy begins to improve from its recent slowdown.

3rd party Ad. Not an offer or recommendation by Investing.com. See disclosure here or remove ads .

The reason history seems to be repeating itself appears fairly clear: during both the 2012 and 2015 periods, investors were confronted with concerns over global growth. From 2011 through 2013 there was a high degree of uncertainty around problems taking place in the European banking system, while in 2015 and 2016 deflationary forces were taking hold around the world.

Today’s situation doesn’t seem that different. Currently, investors worrying about how a U.S./China trade war may slow growth and push the global economy into recession.

Should the problems of the present be resolved as were those of the past, rates on the 10-year yield should begin to rise again. Additionally, as the world starts to show signs of improvement, the equity market should also start moving higher.

Though the phrase “history repeating itself” is often used in a negative context, in this case, it would be something for equity investors to hope for: a brighter future for their stocks.

Latest comments

Vrey informative. Thank you!
funny because what are really talking about expectations. Just one or two major agreements and off we go. yield curves are just another indicator of expectations . charts show most still riding this wave of equity across the globe. I believe it's more of same panic up then panic down. centrals banks and pre-planned news events moving markets now new world system not so much real numbers
Agree
I saw a stock rally cycle is ending,which is a 3-wave cycle and similar as the one in 1990-2000.
My feeling too. In Sweden i can buy premium stocks with a dividend of around 5% and borrow at around 1,5%. So i can let shareprices/dividend drop 69% and still make money.
I'm getting tired of the recession fear reporting. Either make a prediction with a timetable and set expectations or never speak of it again. I've told several people if they think a recession is coming to put a hundred dollar bill on the table and give me a specific quarter when the recession will hit. No one has taken me up on it. Why? Because they are talking out their *******
I agree, it's all headlines to feed fear into mostly retail investors and this and that and the times that it actually hits some people would just absolutely love the attention of being named the "genius" who predicted it. Ray Dahlio's model on managing is best to apply to this scenario because in the end nobody really knows and as stated they just want the credit for when it actually happens.
guite right!
wow if you want to talk about pattern it's how about the fact that there's multiple signs that signify a recession just like the last time?you cannt ease the fear. it was set in motion when the fed was created.fiat allways fails.
you guys just want to cause more panic once the markets are quiet hahaha
but what about context? i understand the point and i agree but i don´t have the security about the "comeback" of stocks in short term. in 2009, 2012 to 2013, and 2015 to 2016. there was a consensus in the world to focus on growth, today that it´s not that clear. Trump it´s not Obama, and this conflict it´s not only economical, it´s political and worst.. is internal politics, it´s Trump intent to make "america great again" and the basis of his reelection in 2020 (if he fails it´s a goodbye to Donald).
thx. great insight.
Always giving insightful interesting information Kramer.
Yeah. This was actually a bit refreshing compared to the other articles on here. Thank you.
thanks
Thanks
good article
Risk Disclosure: Trading in financial instruments and/or cryptocurrencies involves high risks including the risk of losing some, or all, of your investment amount, and may not be suitable for all investors. Prices of cryptocurrencies are extremely volatile and may be affected by external factors such as financial, regulatory or political events. Trading on margin increases the financial risks.
Before deciding to trade in financial instrument or cryptocurrencies you should be fully informed of the risks and costs associated with trading the financial markets, carefully consider your investment objectives, level of experience, and risk appetite, and seek professional advice where needed.
Fusion Media would like to remind you that the data contained in this website is not necessarily real-time nor accurate. The data and prices on the website are not necessarily provided by any market or exchange, but may be provided by market makers, and so prices may not be accurate and may differ from the actual price at any given market, meaning prices are indicative and not appropriate for trading purposes. Fusion Media and any provider of the data contained in this website will not accept liability for any loss or damage as a result of your trading, or your reliance on the information contained within this website.
It is prohibited to use, store, reproduce, display, modify, transmit or distribute the data contained in this website without the explicit prior written permission of Fusion Media and/or the data provider. All intellectual property rights are reserved by the providers and/or the exchange providing the data contained in this website.
Fusion Media may be compensated by the advertisers that appear on the website, based on your interaction with the advertisements or advertisers.
© 2007-2024 - Fusion Media Limited. All Rights Reserved.