Highlights
- Market Movers: Weekly Technical Outlook
- US retail sales beat again, market-economy gap continues to widen
- Look Ahead: Stocks
- Look Ahead: Commodities
- Global Data Highlights
Market Movers: Weekly Technical Outlook
Technical Developments:
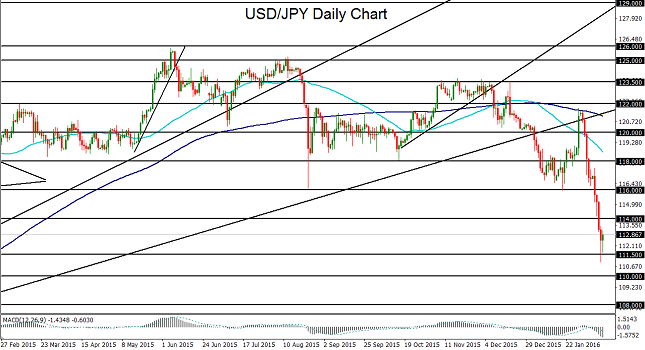
- USD/JPY remains severely pressured as the dollar weakens on low Fed rate hike expectations and the safe haven yen surges on continued stock market volatility. Technical bias: Bearish
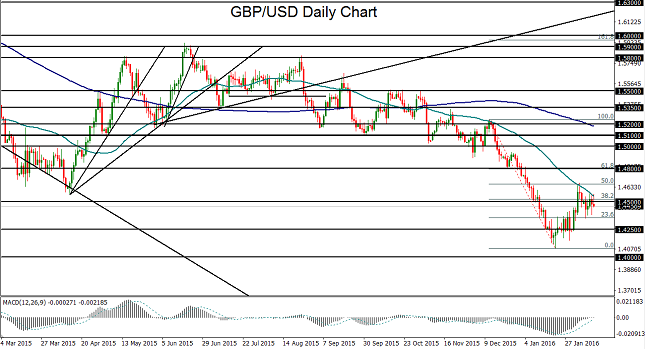
- GBP/USD has lost upside momentum within the context of its recent rally, and could be poised to resume its bearish stance. Technical bias: Neutral to Moderately Bearish
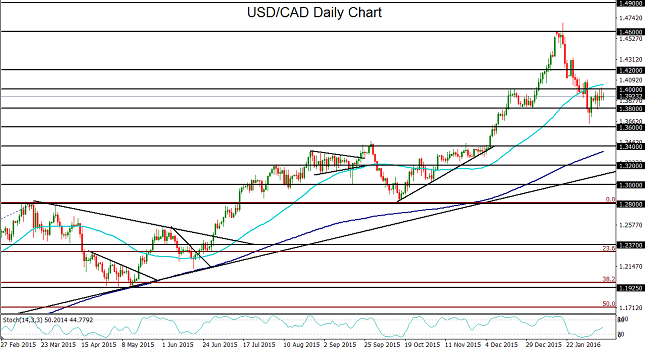
- USD/CAD has bounced modestly after pulling back to February lows, and could resume its uptrend on continued weakness in crude oil. Technical bias: Neutral to Moderately Bullish
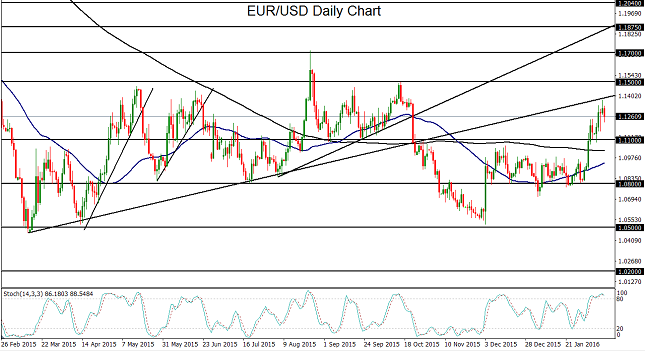
- EUR/USD has surged on a severely weakened US dollar, and could have further to run as economic concerns increasingly preclude another Fed rate hike. Technical bias: Moderately Bullish
USD/JPY
During most of the past week, USD/JPY continued its steep plunge as diminished expectations of further interest rate hikes by the US Federal Reserve weighed on the dollar, and turbulent stock markets around the world pushed up the safe haven Japanese yen. This resulted in swift breakdowns below successively lower support levels this past week, including the key 116.00 and 114.00 levels. Pressure on the dollar due to diminished expectations of future Fed monetary tightening is not likely to abate in the very near future. Likewise, heightened fear and volatility in the struggling global equity markets appear likely to remain for the time being, which should further prop up the Japanese yen. For USD/JPY, this means that the recent plunge could potentially be extended. Having reached down this past week to touch a new 15-month low slightly below 111.00, USD/JPY has seen an acceleration of its bearish momentum and could now be poised to target further downside objectives at the key 110.00 and 108.00 support levels.
Source: FOREX.com
GBP/USD
GBP/USD has spent the past week fluctuating in a tight range directly under its 50-day moving average and around the key 1.4500 level. This consolidation has occurred after the currency pair spent late January and early February rallying in an upside pullback from its multi-year lows above 1.4000. While critically-lowered expectations of a US Federal Reserve rate hike in the foreseeable future may have placed the dollar under a great deal of pressure, the Bank of England (BoE) is arguably even more dovish than the Fed may now be when it comes to raising interest rates. The BoE recently confirmed expectations that a UK rate hike, which has long been anticipated, will be put on hold even further, with no real indication as to when such a rate hike may occur. The monetary policy committee vote to keep rates unchanged was unanimous, and was accompanied by lower forecasts for inflation, economic growth, and wages. If the BoE consistently maintains an even more dovish stance than the Fed, it would be a clear bearish signal for the currency pair. The noted rally prior to this past week's consolidation may in fact be little more than a conventional upside pullback within the context of a strong downtrend that has been in place since at least mid-year of last year. This rally retraced 50% of the latest slide (from the mid-December high down to January’s new multi-year low of 1.4078), before starting to retreat in early February. In the event of an extended retreat with sustained trading below the 1.4500 level, a continuation of GBP/USD’s entrenched bearish momentum could prompt a further drop to begin targeting the 1.4250 and then 1.4000 support objectives once again.
Source: FOREX.com
USD/CAD
USD/CAD consolidated in a tight range this past week after having made a modest bounce from its February lows. A continued drop in oil prices for most of this past week, which weighed on the oil-correlated Canadian dollar, helped USD/CAD rise off those lows. US dollar weakness in the midst of diminishing Fed rate hike expectations, however, limited that rise. While USD/CAD has, since mid-January, been mostly entrenched within a sharp pullback from multi-year highs around 1.4600 resistance, the hammer candle in early February that reached down to a new year-to-date low of 1.3638 prompted a pivot back to the upside. Could this be signaling a potential end to the recent pullback, especially in light of persistently depressed oil prices? From a longer-term perspective, the currency pair continues to trade within a strong bullish trend, despite the noted pullback in late January and early February. With the prospect of a successful oil output deal somewhat difficult to imagine given strong underlying differences among major oil-producing nations, continued weakness in crude could be one of the catalysts that potentially propels USD/CAD to new highs. In the short term, the key 1.4000 psychological resistance level continues to be the major level to watch. With any sustained breakout above 1.4000, the currency pair could be on track once again to target 1.4200 resistance followed by a potential retest of the noted 1.4600 resistance level further to the upside.
Source: FOREX.com
EUR/USD
EUR/USD spent much of the past week continuing its rise above the 1.1100 level as the US dollar weakened significantly due to an increasingly dovish Federal Reserve. Whereas the months of December and January saw the currency pair consolidate within a tight trading range just above the key 1.0800 support level, the arrival of February brought increased concerns over turbulent financial markets, plunging crude oil prices, and slowing economic growth on a global basis. In turn, these concerns severely dampened speculation over future Fed rate hikes and led to broad-based dollar-selling. This has been manifested as a strong surge in the EUR/USD that broke out above the noted 1.1100 resistance level, and then followed-through to the upside to rise well above 1.1300 at its height this past week. As the probability of further rate hikes by the Fed in the foreseeable future continues to diminish, the dollar could continue to undergo increased selling pressure, which could propel EUR/USD further up towards major resistance areas around 1.1500 and then 1.1700. To the downside, any sustained move back below 1.1100 support (previous resistance) would be a significant bearish indication that would invalidate the recent upside breakout.
Source: FOREX.com
US retail sales beat again, market-economy gap continues to widen
After an extremely volatile week, traders are no doubt feeling a bit apprehensive about the future. After all, global stocks have now entered a “bear market” (20% decline in the MSCCI World index), USD/JPY briefly traded down over 1000 pips in less than two weeks and US 10-year treasury yields are approaching all-time lows, a threshold that many global bonds have already reached. Surely all this risk-off trading can be chalked up to declining economic growth? Based on the recent data out of the world’s largest economy at least, the answer is “no.”
Over the last couple weeks, traders have seen top-tier US economic reports come out relatively mixed. On the worse-than-anticipated side of the ledger, both ISM PMI reports came out below economists’ expectations, as did the headline number of jobs in January’s Nonfarm Payrolls report and the Q4 advance GDP reading. That said, we also saw strong readings on wage growth and average hourly earnings, the ADP employment report, and just today, a better-than-anticipated retail sales report.
According to the census bureau, US retail sales rose 0.2% m/m, better than the 0.1% reading eyed by analysts; the “core” retail sales report, which filters out volatile automobile purchases, also beat expectations at 0.1% m/m growth vs. 0.0% expected. Excluding the decline in gasoline prices, retail purchases rose at a healthy 0.4% m/m rate. The gains were paced by rapid increases in online purchases (up 1.6%), at general merchadise outlets (0.8%), and on autmobiles (up 0.6% after a 0.5% gain in December).
With today’s retail sales report representing just the most recent evidence that the US economy is, at worst, continued to muddle through, it’s hard to square the decent economic data with the sharp declines in investor sentiment. Traditional economists view the current market conditions as one of the all-to-frequent tantrums that traders throw, but argue that the present volatility will blow over soon, leading to a rapid return of risk sentiment. More pessimistic investors note that market sentiment tends to be a leading indicator for the economy (though perhaps one that’s too sensitive; as the saying goes, “the stock market has predicted 9 of the last 4 US recessions”), and just because the US economy appears to be on reasonable footing doesn’t rule out the possibility of bear market.
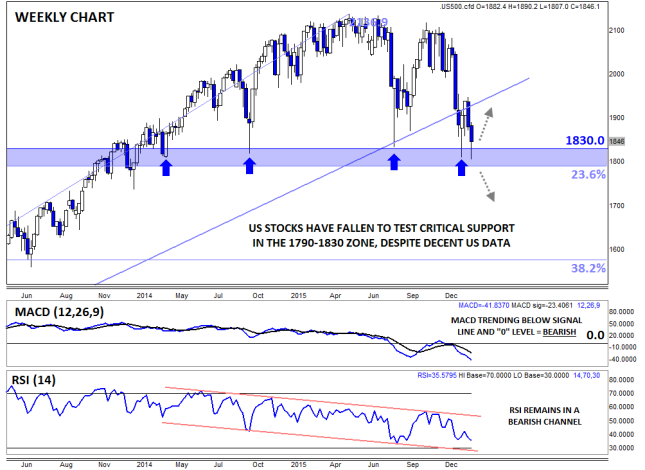
We tend to fall somewhere in the middle: we’re not calling for a global economic recession at this point, but anticipate that we haven’t seen the end of the current spate of market volatility. When it comes to actionable levels to watch, we remain hyperfocused on the critical 1790-1830 support zone in the S&P 500. If that level gives way, fears about slowing economic growth may start to become a self-fulfilling prophecy and a deeper drop would become likely. On the other hand, a bounce through off that floor and back toward the 2000 area would suggest that the stock market is catching back up to the decent economic figures of late.
Source: FOREX.com
Look Ahead: Stocks
At the time of this writing on Friday afternoon, global equities were witnessing some rare bullish price action which helped to reduce the weekly losses for the global indices. But we are not out of the woods just yet as like the previous occasions this may well prove to be just another short-covering bounce from oversold levels. It is not surprising that some bearish speculators would want to go into the weekend flat, knowing full well that there is a good chance for a central bank intervention, or some sort of production agreement among the key oil exporting countries in an effort to boost crude prices. Of course, there can be good reasons for some bullish speculators to tip their toes in around these severally oversold levels, too. Some would argue that the global economy is not as bad as people make it out to be, while the central banks’ desire to hold rates at or around zero is good news for higher-yielding stocks. For now, however, the bulls are being very nimble as they are fully aware of the possibility for a much larger correction now that the major indices are in the bear territory (20% off highs).
Next week, Chinese investors will come back after the week-long Lunar New Year celebrations. The economic calendar is also going to be a lot busier, with Japanese GDP and Chinese trade figures to kick things off on Monday. In terms of company earnings, we are now at the twilight of the fourth quarter US reporting season, which on the whole has been poor. But the European reporting season is at full throttle now. Here, the results have been largely mixed so far. Next week, some of the major European companies that are reporting their results will include Reckitt Benckiser Group PLC (L:RB) and Hammerson PLC (L:HMSO), on Monday; Anglo American (L:AAL) on Tuesday; Go-Ahead Group (L:GOG), Centrica (L:CNA) and BAE Systems (L:BAES) all on Thursday. So there will be lots to look forward to next week, which could have major implications for stocks and other financial markets.
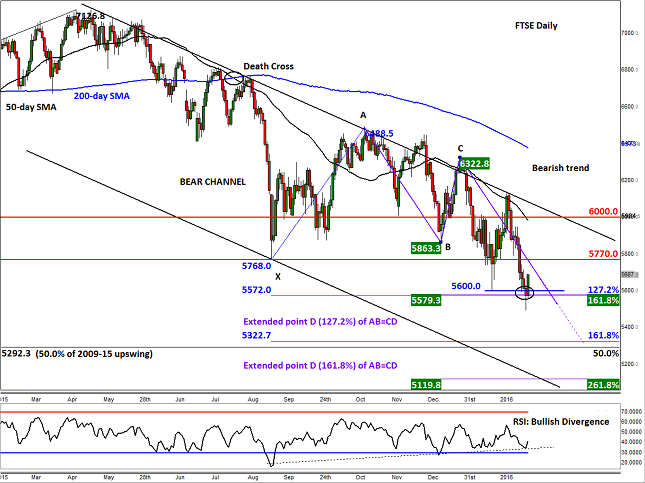
As mentioned, the major indices have reached or neared key reference points or exhaustion levels now. For the FTSE 100, the area around 5570 marks an exhaustion point, which may help explain why the UK benchmark stock index has bounced back on Friday. As can be seen from the daily, below, this 5570 level is where the 127.2 and 161.8 percent Fibonacci extension levels of the previous corrective upward moves come into play. An extended (127.2%) point D of an AB=CD pattern also converges there. Meanwhile, the momentum indicator RSI has been making higher lows recently, indicating that the selling pressure may be waning. All of these technical indications point to a potential short-term bounce, which may well be underway now.
That being said, the overall trend is clearly bearish and any short-term bounces should be taken with a pinch of salt. The FTSE is stuck inside a large bearish channel, and is also below its main moving averages and other key resistance levels. The bulls should remain nimble. Going forward, some of the key resistance levels to watch include 5770 and then 6000, levels which were previously support and/or resistance. Only a break above the bearish trend would be deemed a strong bullish outcome. Until and unless that happens, the path of least resistance remains on the downside. The next potential bearish target below 5570 could be around 5290-9325. This area marks the 161.8% extended point D of the AB=CD pattern, the 161.8% extension of the XA move and the 50% retracement level of the entire 2009-15 upswing.
Source: FOREX.com. Please note this product is not available to US clients.
Look Ahead: Commodities
The rally in the price of gold accelerated this week, most notably on Thursday when it jumped by a huge $65 on the session. On a closing basis, the 4 percent increase was the best one-day performance in seven years. From its December’s low of $1046, the metal has climbed to a high so far of $1263, which is a cool 20 percent. Gold’s sudden waking from its slumber has caught many people by surprise. Likewise, the global stock market’s 20% plunge has lasted a lot longer than what most people had probably envisaged when it first started to descend. Clearly, gold’s status as the ultimate safe haven asset has well and truly been confirmed, yet again.
The buck-denominated precious metal has also benefitted from a weaker dollar as hopes about further 2016 rate rises from the Federal Reserve have basically been dashed. Janet Yellen, the Fed’s Chairwoman, more or less confirmed that no further rate rises are on the horizon at her testimony this week. Consequently, the opportunity cost of holding the yellow metal, which pays no interest, has been reduced on a relative basis. Hence, investors have rushed back into gold, as evidenced by the continued inflows into gold-backed ETFs, for example.
On the physical side of the equation, demand for gold in the fourth quarter of last year jumped 4% year-over-year according to the World Gold Council. Investment demand rose 15% while central banks expanded their purchases by a further 25%. Due to weaker demand in the first half of 2015, total gold demand was slightly lower than the previous year, however. Clearly, the lower prices of gold led to a significant rise in demand in the second half of 2015, especially for coins, bars and jewelry. China maintained its position as the largest consumer of gold, followed closely by India. The WGC thinks that demand from both nations is set to rise in 2016.
Going forward, the only thing that could stop gold is if the dollar and/or stocks rebound strongly, which appear unlikely. That being said, on Friday both stocks and the dollar rose on the back of mixed back US data and as oil prices rose sharply on continued speculation about coordinated output cuts from oil exporting countries. If oil prices form a base, stocks are likely to stage a more meaningful recovery next week, too. This could be bad news for gold. Indeed, we think there is a good chance that gold may consolidate for a while given the extent of this week’s rally. But if equities drop to fresh lows then that could provide the stimulus for another push higher, which is very much possible given the sheer number of high-impact economic data in early next week, including the Japanese GDP and Chinese trade figures.
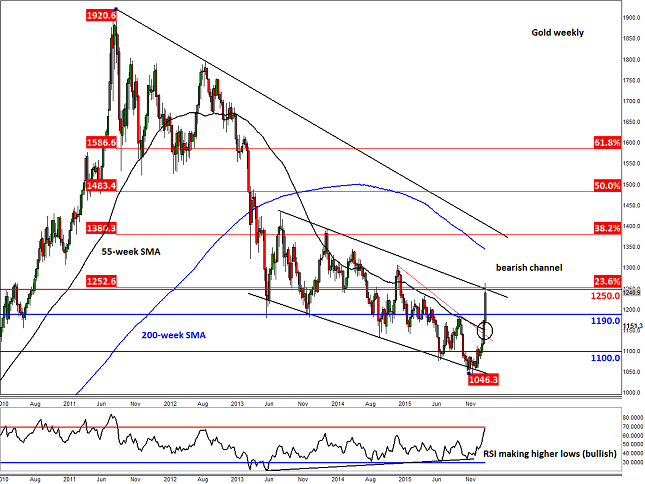
Meanwhile from a technical view point, nearly all of the short-term resistance levels have broken down with so much ease, suggesting that gold could be in the process of a major upswing. Looking at the long-term weekly chart, below, there is still some resistance that needs to be cleared around the $1250 area before gold could potentially extend its gains. Here, the upper resistance trend of a bearish channel meets the shallow 23.6% Fibonacci retracement level of the entire 2011-2015 downswing. This channel has been in place since 2013, and given the overbought conditions on smaller time frames, the precious metal’s pause for breath here on Friday made perfect sense. But as mentioned, it could break further higher early next week if risk aversion rises.
The break above the 55-week average has been sustained, while the ease at which other short term resistances have broken down is also noteworthy. Added to this, the momentum indicator RSI had already formed a triple divergence with price, correctly suggesting that the selling pressure was waning towards the end of 2015. All of these indications point to a break out of the channel soon. If seen, gold could potentially rise towards its 200-week average at $1345 or even test the long-term bearish trend and 38.2% Fibonacci level at $1380.
Now that the key resistance at $1190 has broken down, the buyers will be happy for as long as price holds above this level. In the event that it breaks back below this level however, fresh selling pressure could resume. For now, all the focus is on the $1250 area, which as mentioned, marks the resistance trend of the bearish channel and 23.6% Fibonacci level.
With regards to oil, both contracts have turned higher from key technical levels, with Brent holding its own above the psychological level of $30 which is also the 61.8% Fibonacci retracement of the most recent upswing. At this stage, it should be treated as just a technical oversold rebound, but if oil prices create new highs above their recent ranges then that would confirm a change in the trend.
Source: FOREX.com. Please note this product is not available to US clients
Global Data Highlights
Sunday, February 14
23:50 GMT – JP Preliminary Q4 GDP
Japanese traders will get an extremely late Valentine’s Day present in the form of the Q4 GDP report. Economists are expecting that growth slipped into negative territory at -0.2% q/q after the last quarter’s upwardly revised 0.3% reading. In a bit of a paradox, Japanese policymakers may be hoping for a disappointing report to help mitigate some of the recent strength in the yen.
Monday, February 15
14:00 GMT – ECB President Draghi Speech
ECB President Mario Draghi will testify on monetary policy before the European Parliament. Given the recent market turmoil, disappointing economic data, and dovish signals at the last ECB meeting, traders have priced in aggressive easing from Draghi and company. Super Mario will look to shape those expectations ahead of the highly-awaited March meeting and continued dovishness could take the wind out of euro bulls’ sails.
Tuesday, February 16
0:30 GMT – RBA Monetary Policy Meeting Minutes
The notes from the most recent RBA meeting will reveal whether the central bank seriously considered cutting interest rates or whether such a move may be further away than some analysts expect. In his press conference two weeks ago, Stevens noted that "Continued low inflation may provide scope for easier policy, should that be appropriate to lend support to demand,” and the minutes will show whether this view was shared by his RBA colleagues.
9:30 GMT – UK CPI
Inflation in the UK has been subdued near 0% for nearly an entire year, but for what it’s worth, analysts are expecting the CPI reading to tick up to 0.3% m/m growth from 0.2% last month. Nonetheless, the ongoing weakness in oil prices is likely to keep a lid on overall consumer inflation for the foreseeable future.
9:00 GMT –Eurozone ZEW Economic Sentiment
This economic survey on German investors and analysts shows how optimistic or pessimistic market participants are and tends to serve as a leading indicator for economic growth. With Germany’s DAX dropping to a new 16-month low last week, economists anticipate that the survey’s diffusion index will drop to just 10, which would mark the second-lowest reading since 2013.
Wednesday, February 17
9:30 GMT – UK Claimant Count
The UK’s most important jobs report is scheduled for release on Wednesday and should show a slight decline in unemployed Brits, if economist estimates are to be believed. More important that the (likely slight) change in unemployment claimants, the average hourly earnings index will also be released. With inflation in the dumps (see above), it won’t take much for the UK populace to see positive real (inflation adjusted) wage growth.
19:00 GMT – FOMC Meeting Minutes
Talk about stale data! The Fed opted to leave rates unchanged at its January meeting, but back then, there was still optimism surrounding a March hike. Over the last 3 weeks though, those hopes have faded completely amidst the global market turmoil, so this usually impactful report is unlikely to move markets meaningfully.
Thursday, February 18
0:30 GMT – AU Employment Report
The monthly jobs reports out of Australia have been particularly volatile of late, though the last three have all come in above expectations (massively above expectations in the case of the November and October reports). Traders and economists expect a +13k reading this time around, though almost no reading from this notoriously inconsistent indicator would surprise traders.
Friday, February 19
9:30 GMT – UK Retail Sales
UK Retail sales have been all over the place in recent months, printing at +1.7% in September, -0.5% in October, +1.3% in November, and -1.0% in December. For what it’s worth, retail sales are expected to rise at a 0.9% m/m rate on Friday, continuing the strong-weak-strong-weak pattern that we’ve seen of late.
13:30 GMT – US CPI
The final report that traders will key on in the coming week will be the US CPI report. With expectations of any Fed rate hike in 2016 falling dramatically, it would take a sustained improvement in inflation readings to revive the dollar. Expectations for this month’s report are for prices to fall -0.1%, though the “core” CPI reading is anticipated to tick up at a 0.2% m/m rate.
