The latest bearish meme is the focus on market divergences. The idea is that a "healthy" market shows confirmation from various sectors. The Dow made a new record high this past week, which does not really reflect the overall market. Many smaller stocks have experienced a significant decline from their highs.
In a week that will have fewer earnings stories and less important economic data, I expect many to ask, "Should we be worried about divergences?"
Prior Theme Recap
Last week I expected a focus on the Ukraine crisis. My main idea is that it is important for citizens but not really a market crisis. The muted impact from news last week provided some support for my thesis, although there were clearly some intra-day moves attributed to news from the region. The impact on Russian stocks is certainly important.
It proved not to be a primary theme, but the idea of fading this "news" is still sound.
Forecasting the theme is an exercise in planning and being prepared. Readers are invited to play along with the "theme forecast." I spend a lot of time on it each week. It helps to prepare your game plan for the week ahead, and it is not as easy as you might think.
Naturally we would all like to know the direction of the market in advance. Good luck with that! Second best is planning what to look for and how to react.
This Week's Theme
What is a divergence and should we worry about it?
Josh Brown cites Peter Boockvar who warns as follows:
You don't typically want to see large caps struggling at recent highs with less underlying participation by individual stocks – narrowing of participation at highs is how tops are formed. You also don't typically want to see new all-time highs for the S&P while the more economically sensitive small caps are in a correction. These things can resolve in either direction, but the historical bias is toward a resolution to the downside.
Josh, open-minded about the final resolution, illustrates the divergence between the Russel 2000 and the S&P 500 with this chart:
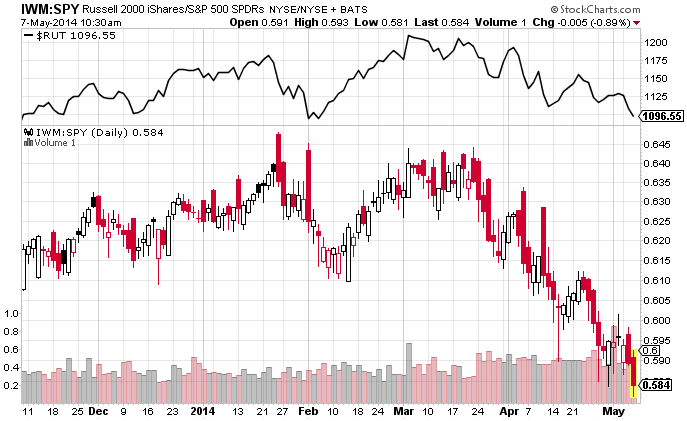
Is the divergence a cause for concern? Boockvar does not really provide any evidence about small caps being more economically sensitive, nor about how divergences are usually resolved. Here are some other viewpoints:
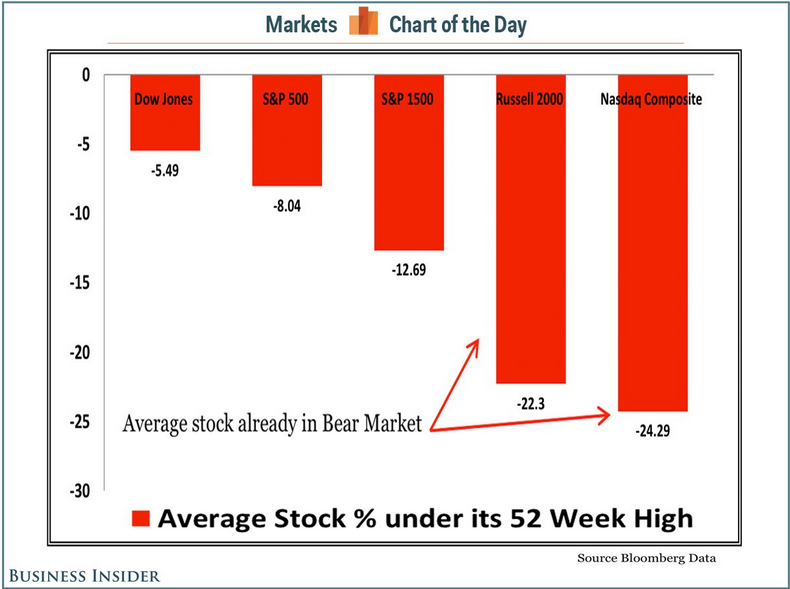
- The average stock is already in a bear market. Sam Ro cites J.C. O'Hara, who echoes Boockvar's message about "masking internal weakness."
- It is a rotation, emphasizing dividend stocks (see Bespoke).
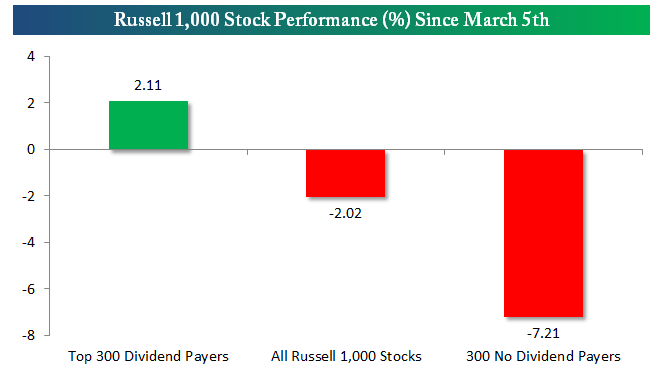
- It is a rotation, resulting from pension fund reallocation (via Cam Hui).
- You see what you are looking for with trend lines. Greg Harmon has good charts and examples.
As usual, I have some thoughts that I will share in the conclusion. First, let us do our regular update of the last week's news and data. Readers, especially those new to this series, will benefit from reading the background information.
Last Week's Data
Each week I break down events into good and bad. Often there is "ugly" and on rare occasion something really good. My working definition of "good" has two components:
- The news is market-friendly. Our personal policy preferences are not relevant for this test. And especially -- no politics.
- It is better than expectations.
There was little news, but it was mostly good.
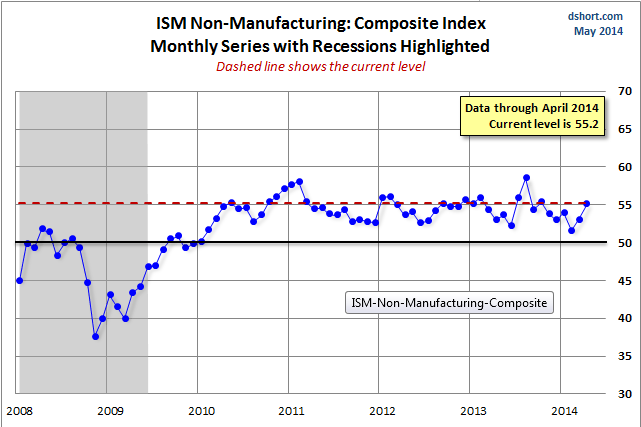
- ISM services increased to 55.2. That is the highest level in months. Read Doug Short's complete report for discussion of the underlying components and additional charts. Here is the headline series:
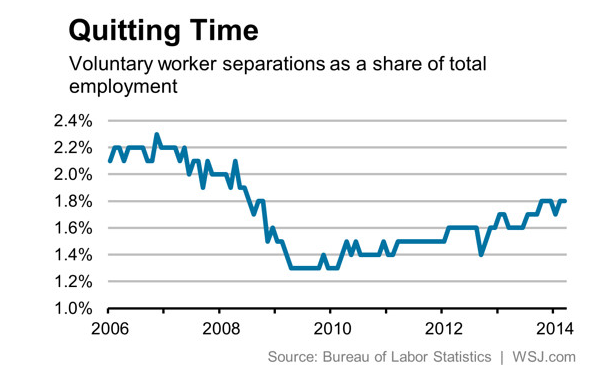
- The quit rate is higher. There is some really bad analysis of the JOLTS report. Those who change their choice of indicator with the wind have thousands of choices. I emphasize the quit rate as the most important aspect of this report. It is not as good as other methods for analyzing overall job growth or unemployment. It is focused on turnover. The number of those voluntarily leaving their jobs is a good indicator of market health, and one that most do not know. 2.5 million people voluntarily quit jobs in February, the highest number since July, 2008. Nick Timiraos of the WSJ has a nice analysis with good charts. Here is the quit rate:
- Initial jobless claims declined to 319K. This relieved some concern about the recent spike in this noisy, but important weekly series.
- Hotels are on track for the strongest year since 2000. Calculated Risk reports the details – not surprising to this traveler!
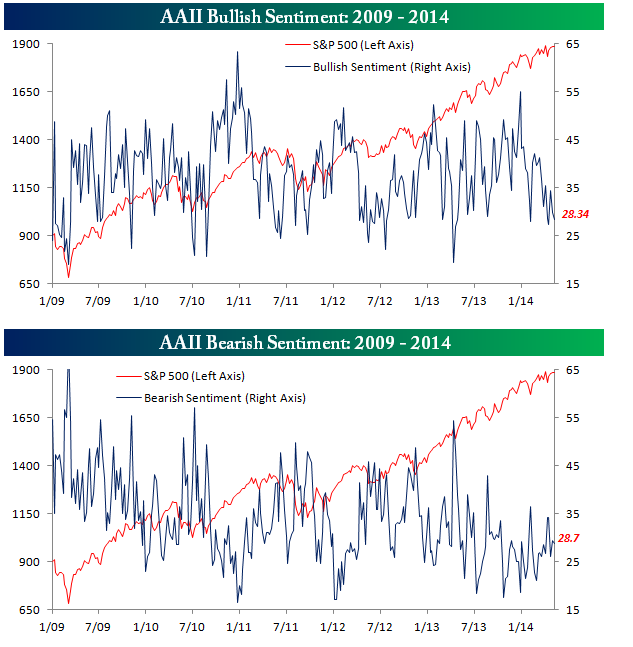
- Sentiment has turned bearish (a contrarian indicator). Bespoke has the story.
- Earnings growth has been solid. 5.4% for Q1 and 8.36% on forward estimates. Earnings expert Brian Gilmartin has the full story. His insights have been very strong, both overall and on individual stocks.
- Consumer credit continues to grow. This has been an economic and market positive for many years. (See Steven Hansen for an alternative viewpoint and details on the rate of growth).
- A college education is worth $800,000. (From the SF Fed's Research) With plenty of recent emphasis on student loan debt, we should also keep in mind that education is an investment. Staying in school makes special sense when job markets are weak.
The Bad
There was also some bad news.
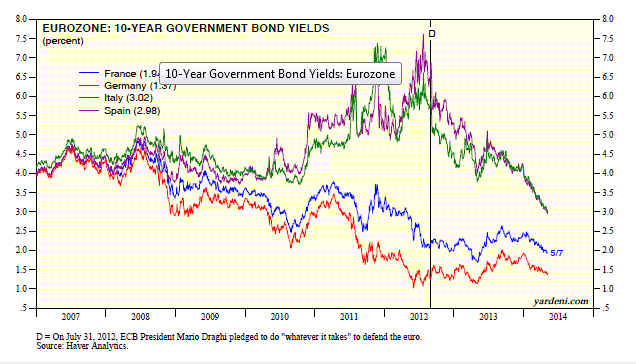
- European deflation concerns. On one hand it is a positive that Eurozone countries can roll debt at low rates. (Remember the scary warnings from a couple of years ago?) We must also consider whether the reason is confidence or a different brand of fear. Ed Yardeni sees the plunging yields as deflation concern. Here is a key chart:
- Productivity fell by 1.7% in the first quarter, the first drop in a year. The flip side is that unit labor costs were higher. The WSJ has a good account, evaluating the possible weather effects.
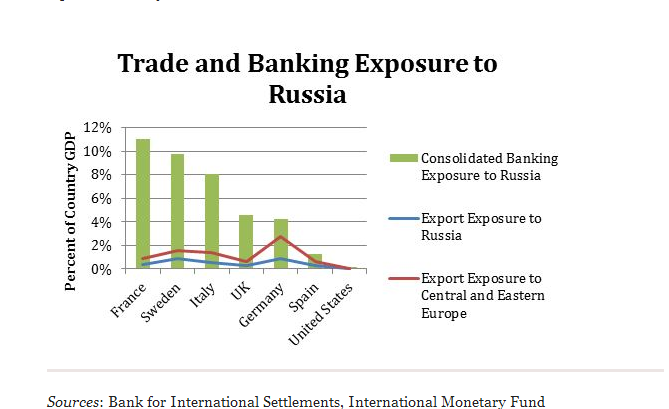
- Continuing Ukraine effects are negative, even with the stalemate. Robert Kahn, of The Council on Foreign Relations, has a thoughtful analysis of the contagion from sanctions against Russia.
The Ugly
Drug shortages – not just specialized drugs, but generics as well.
The problem built for years, and Congress finally gave the FDA expanded powers to address shortages. The shortages averted have increased from 38 in 2010 to 170 in 2013, but the active number is still 300 per day. The extended article from Remapping Debate makes a proposal that we free-market types will question: Government manufacture and distribution of some drugs.
What is wrong with the market solution? Among various reasons, this one stands out:
…companies choose which drugs to manufacture based on projections for demand and, if they have competitors, what others may produce. Oftentimes, they prioritize newer generics with bigger profit margins, even if that increases the likelihood of shortages, according to a report released in February on the drug shortages by the Government Accountability Office. What's more, the watchdog agency said, older generics are routinely "discontinued in favor of producing newer drugs that are more profitable or that have more demand."
When older, less profitable generics are made, they're produced in limited quantities because unsold pharmaceuticals can't be stockpiled like bricks; they have a short shelf life. As HHS pointed out in its 2011 economic analysis: "There is little cost (except reputational) of producing too little of one drug (rather than another), but a potentially high cost of producing too much of that drug."
This is a truly ugly problem, and it is getting worse.
Housing Revisited
Following up on last week's data, we have more analysis of housing. Here are two interesting articles, both worth reading in full.
- Logan Mohtashami, a senior loan officer, explains that prices are too high and there are not enough good jobs for strong new buying.
- Calculated Risk has nine reasons to look on the bright side of housing, responding to many recent concerns.
The Silver Bullet
I occasionally give the Silver Bullet award to someone who takes up an unpopular or thankless cause, doing the real work to demonstrate the facts. Think of The Lone Ranger. Reader nominations are always appreciated! (Thanks to C.S. for this one).
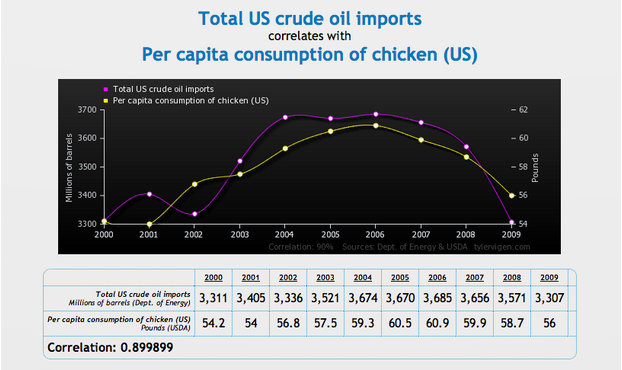
In a world filled with two-variable "correlation charts" it is difficult for most to remain objective. Everyone knows, in theory, that correlation does not imply causation, but the stories sometimes sound so plausible. Tyler Vigen at Spurious Correlations has some good ones. (HT to Dina Spector at Business Insider, who highlights some favorites). Here is mine, showing per capita chicken consumption versus total US oil imports:
You might also enjoy this vintage "Dash" where I looked at Ben Bernanke, the balance sheet, and the S&P 500.
Quant Corner
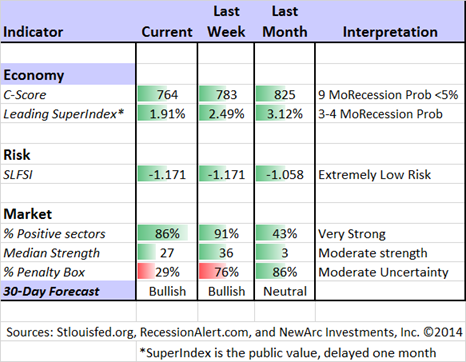
Whether a trader or an investor, you need to understand risk. I monitor many quantitative reports and highlight the best methods in this weekly update. For more information on each source, check here.
Recent Expert Commentary on Recession Odds and Market Trends
Georg Vrba: Updates his unemployment rate recession indicator, confirming that there is no recession signal. Georg's BCI index also shows no recession in sight. For those interested in hedging their large-cap exposure, Georg has unveiled a new system.
RecessionAlert: A variety of strong quantitative indicators for both economic and market analysis.
Bob Dieli does a monthly update (subscription required) after the employment report and also a monthly overview analysis. He follows many concurrent indicators to supplement our featured "C Score." One of his conclusions is whether a month is "recession eligible." His analysis shows that none of the next nine months could qualify. I respect this because Bob (whose career has been with banks and private clients) has been far more accurate than the high-profile TV pundits.
Doug Short: An update of the regular ECRI analysis with a good history, commentary, detailed analysis and charts. If you are still listening to the ECRI (2 ½ years after their recession call), you should be reading this carefully. He notes that the ECRI has emerged from hibernation. "Interestingly, the interview includes no reference to ECRI's recession call, instead focusing on whether the winter economic downturn was weather-related or reflective of a cyclical downturn."
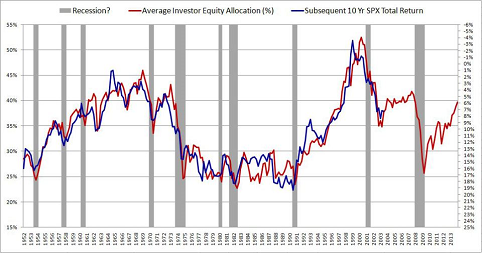
Philosophical Economics has a provocative analysis about projected stock returns for the next ten years. Unlike some modelers who take hundreds of variables, all of the available data, and create a back-fitted regression equation, this is a simple bivariate approach. It is history, of course, so the reasoning is important. The article is long and thoughtful. I recommend it.
The basic conclusion is that the expected future return from stocks is inversely related to the average investor stock allocation. The resulting chart is compelling. It suggests an annualized 6% return over the next ten years.
How does this stack up against the other models that you always see quoted? Better, much better. Better than the "Buffett indicator," and much better than the Q-ratio or CAPE.
The Week Ahead
We will have a moderate week for news and data. Some sources are doing better with an approach similar to mine – not listing everything, but highlighting what is important. Kathleen Madigan at the WSJ has a nice take with five things to watch.
The "A List" includes the following:
- Initial jobless claims (Th). Best concurrent read on employment.
- Housing starts and building permits (F). Housing remains crucial if the economic rebound is to gain real strength. Building permits are a good leading indicator.
- Michigan Sentiment (F). Good concurrent read on employment and spending.
- Retail Sales (T). Continued rebound from the bad weather months?
The "B List" includes:
- Industrial production (Th). Also capacity utilization, now approaching 80%, a level that suggests more Capex spending.
- PPI (W). Inflation will someday be important, but not until it has exceeded the Fed's target level.
- CPI (Th). See PPI above.
There are a number of regional Fed surveys. I do not regard these as very important (at least not individually) and it takes a big move in one for any real market impact. It is an active week for FedSpeak, including more from Chair Yellen.
Earnings season winds down. Ukraine remains a wild card.
It is options expiration week, so surprising moves sometimes become exaggerated. Option strike prices thought to be irrelevant suddenly come into play.
How to Use the Weekly Data Updates
In the WTWA series I try to share what I am thinking as I prepare for the coming week. I write each post as if I were speaking directly to one of my clients. Each client is different, so I have five different programs ranging from very conservative bond ladders to very aggressive trading programs. It is not a "one size fits all" approach.
To get the maximum benefit from my updates you need to have a self-assessment of your objectives. Are you most interested in preserving wealth? Or like most of us, do you still need to create wealth? How much risk is right for your temperament and circumstances?
My weekly insights often suggest a different course of action depending upon your objectives and time frames. They also accurately describe what I am doing in the programs I manage.
Insight for Traders
Felix has continued the bullish rating, and the choices have become more aggressive. The broad market ETFs look better, except for the iShares Russell 2000 Index (ARCA:IWM), which is neutral. More sectors have emerged from the penalty box, reflecting higher confidence in the ratings.
Those who want to follow Felix more closely can check us out at Scutify, where he makes a daily appearance to join in vigorous discussions about trading.
Insight for Investors
I review the themes here each week and refresh when needed. For investors, as we would expect, the key ideas may stay on the list longer than the updates for traders. The current "actionable investment advice" is summarized here.
Despite a little daily volatility, there have not been many good dips to buy for long-term value investors.
Those trying out our Enhanced Yield approach should have enjoyed yet another good week in a sideways market. It is important and helpful to own value stocks that pay dividends and add some hedging via short calls. I have written several times about examples that you can try on your own. It reduces your risk. Start small and get the sense of how to do it.
Here are some key themes and the best investment posts we saw last week. For some reason, these are all things that you should try not to do!
Individual investors are bad market timers. Jason Zweig is a champion for this group with his regular column, The Intelligent Investor. He aggressively asks, Just How Dumb Are Investors? Stock fund investors made 3.7% annually over the last 30 years while the S&P 500 had annual gains of 11.1%. Basic reason? Investors chase returns, buying and selling the wrong mutual funds and getting out of the market at the wrong times.
The economy is stronger than you think, according to these nine reasons from Jeff Reeves's Strength in Numbers. He describes an unexciting story of modest growth, suggesting that it might be time to "push aside" the doom and gloom crowd. What fun would that be?
Beware of the advice from famous hedge fund managers. Barry Ritholtz warns about the need to distinguish between some famous "headline" calls and the overall results. Here is a key quote:
The 2013 results were similarly disappointing: a 3.8 percent loss for the conference's best picks versus the Standard & Poor's 500 Index gain of 15.2 percent. The pattern was the same in 2012: a 19 percent gain for the Sohn picks versus 22 percent for the S&P 500. (Note the gains are calculated conference to conference, and not on the calendar year).
Beware of the bubble callers. The legendary Jeremy Grantham has pedestrian returns, even with a defensive position during the last recession. Why? He was too early and got back in the market too late. Here is the full story, typical of many bubblers. For contrast, read also James A. Kostohryz, who asks what might happen if Americans were actually optimistic.
Beware the hype machine. Tom Brakke describes what happens when sell-side analysts write about companies where there are also stock offerings. See his great case story and chart.
Beware of "inside" information. Most people are suspicious of those who are selling information instead of using it themselves. Here are several reasons for walking the other way!
If you are obsessed about possible market declines, you have plenty of company. This is one of the problems where we can help. It is possible to get reasonable returns while controlling risk. Check out our recent recommendations in our new investor resource page -- a starting point for the long-term investor. (Comments and suggestions welcome. I am trying to be helpful and I love and use feedback).
Final Thought
Divergences seems like a manufactured problem. Take a look at this chart from Bespoke.
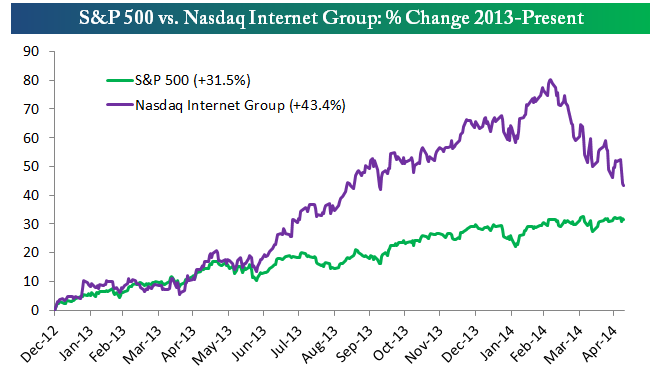
They analyze the strength of the NASDAQ Internet Group last year and the recent weakness, noting that "the tortoise could catch up to the hare."
It is normal. It is what you should expect when attitudes change about sector valuations. We always see changes based upon perceptions of where we are in the business cycle as well as sentiment. It is not just about company size. At some point, I expect the current dividend favorites to lose ground to cyclical and financial names. That is business as usual.
Here is a simple test:
When these more speculative stocks were surging last year, did analysts now warning about "divergences" celebrate the "confirmation" of the strength of the market? Or did they warn that the market was in a "bubble?"
If the latter, isn't it healthy to restore more normal valuations?

