Can positive economic trends overcome the weight of market seasonality?
We all love simple rules, especially when supported by data. Throw in a rhyme or some alliteration and you have the makings of a powerful slogan. "Sell in May and go away" fits the bill.
Despite the biggest flow of fresh news and data we have seen in recent memory, I expect the financial punditry to repeat the rhyme and ask that question to anyone willing to step in front of a microphone.
Prior Theme Recap
Last week I expected the theme to be economic optimism. There were several stories on that subject early in the week. It played out pretty well until the release of the new home sales data. That caused most to reconsider. Despite that, the balance of news and corporate reports were upbeat on the economy.
As I try to emphasize, forecasting the theme is an exercise in planning and being prepared. Readers are invited to play along with the "theme forecast." I spend a lot of time on it each week. It helps to prepare your game plan for the week ahead, and it is not as easy as you might think.
Naturally we would all like to know the direction of the market in advance. Good luck with that! Second best is planning what to look for and how to react.
This Week's Theme
Is it time to "Sell in May?"
There are many articles on this subject, but charts like this one (from Sam Ro at Business Insider) highlight the seasonal difference:
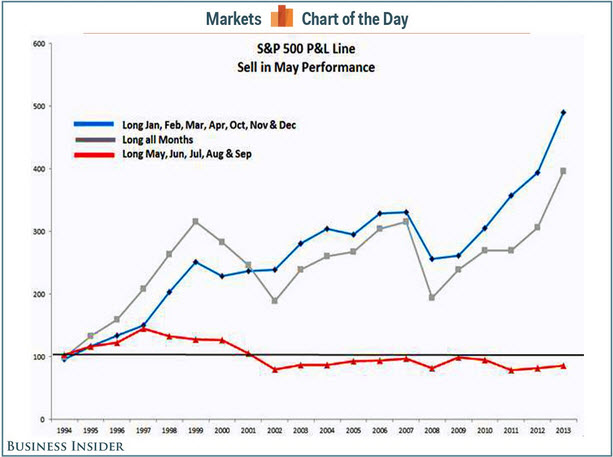
We'll let that chart stand for a thousand words!
If you insist on more detail, you can find scores of articles that suggest that this is the exact moment for many bearish predictions to come true – "only pain ahead."
On the positive side, there are five important trends suggesting solid economic improvement:
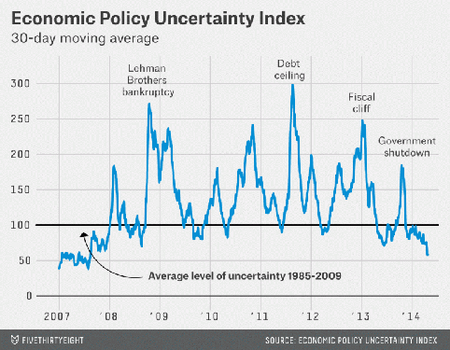
- Less economic uncertainty. Remember all of the complaints that business was reluctant to expand because of unpredictable government policies? That has gotten better. Fivethirtyeight has a nice update article in an objective indicator, the economic policy uncertainty index.
- Corporations are finally putting cash to work (via Bloomberg) although it is only a start (via Scott Grannis).
- Expected earnings growth remains strong. Brian Gilmartin provides regular updates of the growth in the forward estimate, now 7.68%.
- US oil production is surging, up 67% in four years. Scott Grannis calls this a "huge boost for the US economy."
- Business economists see improved hiring. These are not Wall Street economists or academics (although their message is similarly upbeat). These are corporate economists offering evidence about their own business or sector. This is the best kind of survey. Josh Brown has a nice discussion, noting that we have had four annual "false starts" toward the elusive goal of economic "escape velocity."
How much of an anchor will seasonal forces provide? Will economic progress be reflected in stock prices?
As usual, I have some thoughts that I will share in the conclusion. First, let us do our regular update of the last week's news and data. Readers, especially those new to this series, will benefit from reading the background information.
Last Week's Data
Each week I break down events into good and bad. Often there is "ugly" and on rare occasions something really good. My working definition of "good" has two components:
- The news is market-friendly. Our personal policy preferences are not relevant for this test. And especially -- no politics.
- It is better than expectations.
The Good
There was plenty of economic news, and on balance it was very good (including key trends highlighted above).
- Durable goods growth was strong at 2.6%, well above forecasts of 2.0%. Growth in core goods was also well above expectations. See Steven Hansen at GEI for comprehensive analysis and charts.
- Michigan sentiment climbed to 84.6. This was the second highest reading in almost seven years. Values are still well below the pre-recession days, but the results are encouraging. See Doug Short for complete analysis and my favorite chart of this series.
- Leading economic indicators were up 0.8% -- strong and above consensus.
-
Property tax collections are back at the pre-recession peak. (See Calculated Risk).
The Bad
There was also some bad news, most importantly the housing data.
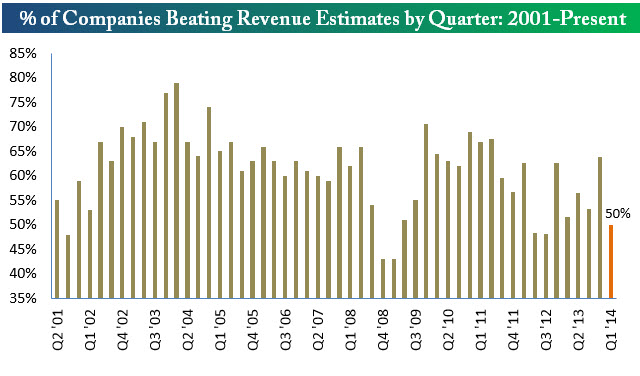
- The revenue beat rate is weak – only 50%, which is well below the 59% average. The earnings beat rate has been acceptable at 62%, the average of the last few years. Bespoke has the full story including this chart:
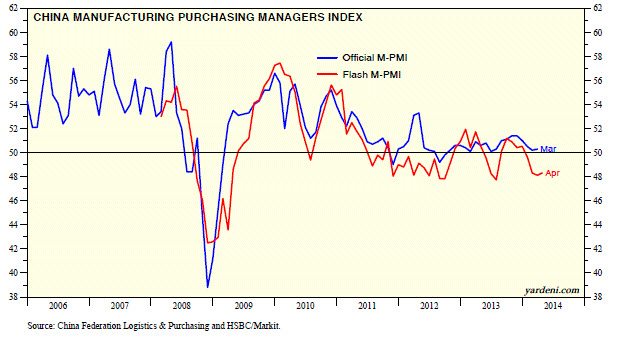
- China's growth remains disappointing. The Manufacturing PMI edged higher, but has been in the contraction range for three months. Dr. Ed Yardeni explains that the weakness reflects less government stimulus and is affecting demand for commodities, including oil. Here is a key chart:
- Initial jobless claims spiked to 329K. This is a noisy series, so the focus is on the four-week moving average, but it bears watching.
-
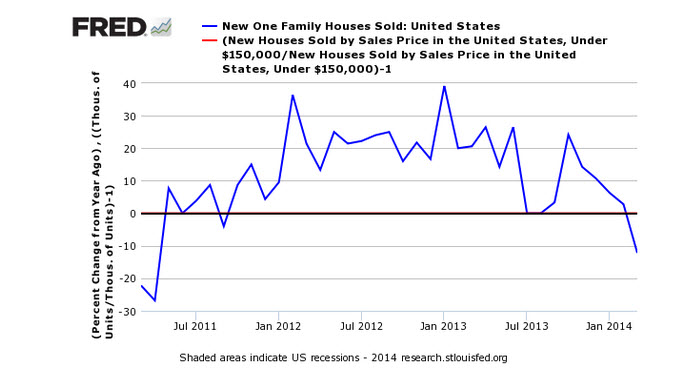
New home sales plunged by 14.5% on a seasonally adjusted basis. The March data should have had reduced effects from weather. John Lounsbury and Steven Hansen analyze this noisy series with a focus on unadjusted data and comparative moving averages. New Deal Democrat wants some dap for his bearish call on housing, so check out his reply to Calculated Risk and Joe Weisenthal. Here is a chart from the GEI analysis:
The Ugly
Health care costs for the elderly. A new study suggests that middle-class retirees may need to use their entire Social Security benefits to offset health care costs. The costs are the Medicare and Medigap premiums as well as co-pays. The costs are projected at 98% of Social Security benefits for a healthy copy retiring in ten years.
Quant Corner
Whether a trader or an investor, you need to understand risk. I monitor many quantitative reports and highlight the best methods in this weekly update. For more information on each source, check here.
Recent Expert Commentary on Recession Odds and Market Trends
Georg Vrba: Updates his unemployment rate recession indicator, confirming that there is no recession signal. Georg's BCI index also shows no recession in sight. For those interested in Canadian stocks, Georg has unveiled a new system.
RecessionAlert: A variety of strong quantitative indicators for both economic and market analysis.
Bob Dieli does a monthly update (subscription required) after the employment report and also a monthly overview analysis. He follows many concurrent indicators to supplement our featured "C Score." One of his conclusions is whether a month is "recession eligible." His analysis shows that none of the next nine months could qualify. I respect this because Bob (whose career has been with banks and private clients) has been far more accurate than the high-profile punditry.
Doug Short: An update of the regular ECRI analysis with a good history, commentary, detailed analysis and charts. If you are still listening to the ECRI (2 ½ years after their recession call), you should be reading this carefully. He notes that the ECRI is back in "hibernation."
The Week Ahead
We have a very big week for news and data.
The "A List" includes the following:
- Employment situation report (F). A complex and heavily revised story, but viewed as the most important read on the economy.
- FOMC decision (W). Strong consensus on the outcome, but wording will get attention.
- ISM Index (Th). Key gauge of trend in manufacturing and employment.
- Personal income and spending (Th). Important element of GDP.
- Consumer confidence (T). Good read on employment and spending.
- Initial jobless claims (Th). Best concurrent read on employment. Will the improvement be maintained?
The "B List" includes:
- ADP employment (W). Good independent measure of private job growth.
- Auto sales (Th). Will growth rebound?
- Pending home sales (M). Plenty of attention on housing.
- GDP (T). Backward looking and low expectations, but still the ultimate growth measure.
Fed Chair Yellen speaks on Thursday, after the FOMC meeting. No press conference for this one.
Major earnings reports continue and may overshadow economic news.
How to Use the Weekly Data Updates
In the WTWA series I try to share what I am thinking as I prepare for the coming week. I write each post as if I were speaking directly to one of my clients. Each client is different, so I have five different programs ranging from very conservative bond ladders to very aggressive trading programs. It is not a "one size fits all" approach.
To get the maximum benefit from my updates you need to have a self-assessment of your objectives. Are you most interested in preserving wealth? Or like most of us, do you still need to create wealth? How much risk is right for your temperament and circumstances?
My weekly insights often suggest a different course of action depending upon your objectives and time frames. They also accurately describe what I am doing in the programs I manage.
Insight for Traders
Felix has shifted to a bullish rating, but it is still a close call. We have been mostly out of US equities, but fully invested for trading accounts, mostly in Latin America. Somewhat to my surprise, we never got a "buy" signal on the inverse ETFs. The Dow and the S&P 500 look better and the QQQ's have also rebounded to the neutral range. Many more sectors have earned good ratings, but are still in the penalty box, reflecting higher uncertainty.
Those who want to follow Felix more closely can check us out at Scutify, where he makes a daily appearance to join in vigorous discussions about trading.
Insight for Investors
I review the themes here each week and refresh when needed. For investors, as we would expect, the key ideas may stay on the list longer than the updates for traders. The current "actionable investment advice" is summarized here.
Because we have been trimming winners in our "long stock" program, we have prepared to buy on dips. I have not added to these positions yet, but we are shopping. I am especially interested in regional banks, energy and some "old tech."
Those following our Enhanced Yield approach should have enjoyed another good week in a sideways market. It is important and helpful to own value stocks that pay dividends and add some hedging via short calls. I have written several times about examples that you can try on your own. It reduces your risk. Start small and get the sense of how to do it.
Here are some key themes and the best investment posts we saw last week.
Most investors are still sidelined. A Bankrate.com poll shows that 73% of people are still "nor more inclined to invest in stocks." Chief financial analyst Greg McBride notes, "A lot of individual investors got burned twice and as a result they swore off investing in equities."
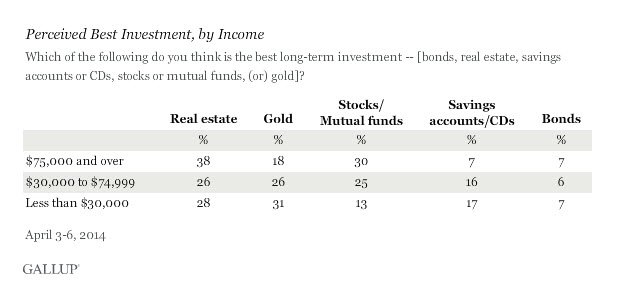
Investors favor real estate and gold rather than stocks according to Gallup. Gold is especially popular with low income Americans.
Meanwhile, affluent US investors are very bullish on equities (according to a Legg Mason survey). 74% thought that equities were the best choice for 2014.
We all have a choice about investments, but it is interesting to see how others are behaving and which groups are more similar to your own thinking.
Ideas? For those interested in finding some solid stocks, there are plenty of attractive values. David Bianco highlights Apple (NASDAQ:AAPL), JP Morgan (NYSE:JPM) and Chevron (NYSE:CVX) as examples of companies that will do fine if the economy muddles through the rest of the year and even better if it accelerates. He states, "Either way you win with these stocks." (I am long all three names in our stock and/or enhanced yield programs, since this value approach is much like ours).
If you are obsessed about possible market declines, you can see that you have plenty of company. This is one of the problems where we can help. It is possible to get reasonable returns while controlling risk. Check out our recent recommendations in our new investor resource page -- a starting point for the long-term investor. (Comments and suggestions welcome. I am trying to be helpful and I love and use feedback).
Final Thought
The seasonal slogans often substitute for thinking and analysis. The powerful-looking chart that leads today's post actually translates into a 1% monthly difference in performance. The "good months" gain 1.3% on average while the "bad months" gain about 0.3%.
To make a wise decision you need to make an objective quantitative comparison between the economic trends and the small seasonal impact. The Great Recession has been followed by a slow and plodding recovery. We have an extended business cycle with plenty of central bank support. Since I am expecting the current cycle to feature (eventually) a period of robust growth, I do not want to miss it. The 1% seasonal effect will be minor in a month where we get a real economic surge.
If instead we get the typical sideways market with some volatility, it is a perfect environment for selling short-term calls against attractive, dividend-paying stocks.
Take what the market is giving you – often a path not chosen by the crowd.

