In sharp contrast to last week, the punditry has less to chew on this coming week. This leaves the media agenda wide open. Discussion will range freely on the potential for the economy as well as the markets. Expect to see stories about China, Europe, low volume, low volatility, and the implications therefrom.
Everyone is expecting the quiet time to end, with a break in one direction or another. Will it be this week? Or are we in for a continuing quiet time?
Prior Theme Recap
Last week I expected plenty of discussion about the economic data, finally providing some clarity about the direction of the economy. This was indeed the main subject for discussion, but the data changed few minds. The overall effect was positive, as you can see from Doug Short's weekly market summary – a good discussion featuring this chart:
Forecasting the theme is an exercise in planning and being prepared. Readers are invited to play along. I work on it each week because it helps to prepare your game plan for the week ahead. It is not as easy as you might think. Feel free to suggest your own likely theme in the comments.
Naturally we would all like to know the direction of the market in advance. Good luck with that! Second best is planning what to look for and how to react.
This Week's Theme
I suggest: Be prepared! It is quiet, too quiet.
Nearly everyone expects a rebound in volatility.
Here are some perspectives.
- Josh Brown wonders if we will experience "the annual letdown" that we have seen in the last few years.
- Barron's notes the improvement from the "strong manufacturing and jobs data."
- James R. Hagerty, writing for the WSJ, has a balanced discussion about the potential for a U.S. manufacturing rebound – both sides examined carefully.
- Dan Greenhaus at BTIG provides (via the WSJ) a list of 26 current investor worries.
As always, the conclusion may depend upon your time frame.
We always use our planning to be prepared, but the current market is a special test. Charles Kirk sets a great example for traders. His invaluable weekly chart show cites both the bullish underpinnings and also the possibility of an early-week test of recent trading gaps. He explains what to watch. (The Kirk Report has a small membership fee, which you will recover almost instantly in your personal trading. The weekly magazine is an entertaining and instructive mix of ideas that I always review in my preparation).
As usual, I have some thoughts that I will share in the conclusion. First, let us do our regular update of the last week's news and data. Readers, especially those new to this series, will benefit from reading the background information.
Last Week's Data
Each week I break down events into good and bad. Often there is "ugly" and on rare occasions something really good. My working definition of "good" has two components:
- The news is market-friendly. Our personal policy preferences are not relevant for this test. And especially – no politics.
- It is better than expectations.
The Good
There was plenty of encouraging news.
- Hurricane season is less likely to push up natural gas prices. Why? The shale gas revolution. (See Tim Puko at MoneyBeat).
- Light vehicle sales were strong. The annualized rate of 16.7 million was the best since early in 2007. There was clearly some rebound from bad weather, so the question will be whether the strength can be maintained. (See Scott Grannis for analysis and charts).
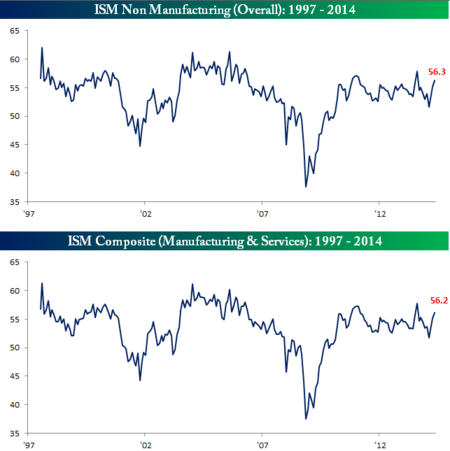
- ISM reports were positive. The manufacturing report had a reporting glitch, creating great fun for conspiracy buffs. The original report was a miss, followed by an estimate that was positive, and a final verdict that was in line. A sharp economist at the prestigious Stone and McCarthy firm noted that the underlying data were not consistent with the conclusion, given the pre-announced seasonal adjustment factors. A quick tweet sent the ISM folks back to the spreadsheets. The ISM services report beat expectations. The combination seems consistent with economic growth of 4 % or so. Bespoke has an interesting chart that I have not seen elsewhere – putting the two reports together. The result is the sixth highest level of the current expansion.
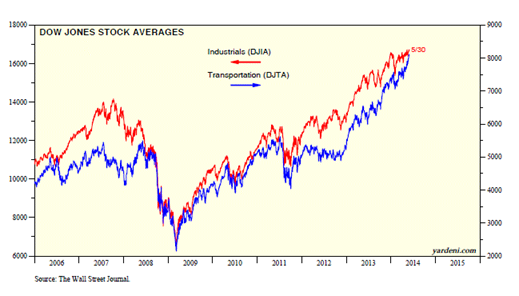
- Dow Theory is bullish. Ed Yardeni highlights the strength in the Dow Transports.
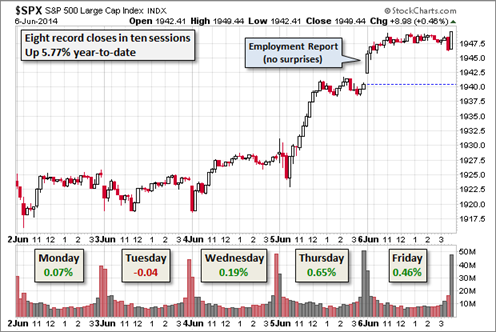
- ECB actions satisfied markets – negative rates, asset purchases and a promise of more. Much of the punditry objected to the policies, but the market treated the decision as a mild positive, as you can see from the chart in the introduction. Brian Blackstone of the WSJ has a good account.
- Rail traffic remains strong. See GEI for data, charts and analysis.
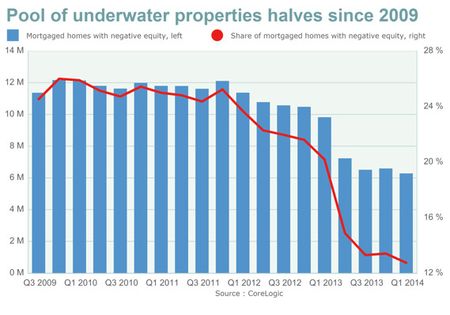
- Underwater mortgages have declined sharply—half the level of 2009. (CoreLogic via MarketWatch)
- Headline payroll job growth met expectations at 217K. Labor force participation increased, but the unemployment rate remained constant. The headline for most sources was that this was an all-time high in employment. Calculated Risk has this story and also announces the retirement of the "scariest jobs chart ever."
- Dean Baker warns that 41-year-olds are leaving the labor force – not just the older workers. Meanwhile, some older workers want to work longer.
- Job quality is the biggest criticism. (See Eric Morath at the WSJ).
- The real story is mixed. The most helpful source on job changes since the recession is the New York Times interactive chart. It is 255 charts in one, showing employment trends and wages in many industries. The trends in job creation are not easy to capture, and this wonderful resource defies illustration. You will enjoy spending a little time with it. Another good chart pack (only ten, but good ones) comes from Fivethirtyeight. Noteworthy is the drag from the public sector throughout the recovery.
Sources of all political stripes contrasted the all-time high in jobs with the reality of continuing high unemployment. No serious analyst questions this. The economic recovery may be enough to retire Bill McBride's scariest chart, but it is certainly not "mission accomplished." Bob Dieli says it well:
As welcome as this news is, you should keep in mind that it is the economic equivalent of winning the first game of the World Series. Namely, a good place to start, but hardly enough to get you a champagne shower in the locker room.
The Bad
There was also a fair share of bad news last week.
- Investors Intelligence shows bulls at 62.2, the 2nd highest rating on record. This is a favorite sentiment indicator of celebrated deep value investor Robert Marcin, my frequent opponent in friendly discussions at Scutify. I applaud Bob's value approach, but we often disagree on specific indicators. It is even better and more fun when readers join in.
- Immigration is off the House calendar for June. (The Hill).
- Trade deficit was higher – more than $6 billion above expectations. The April data is a negative for Q2 GDP, which adjusts for the trade imbalance.
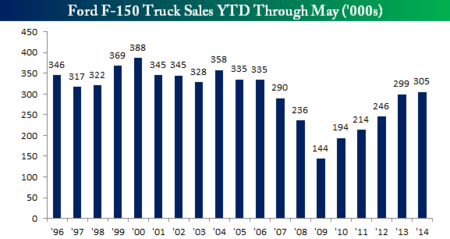
- Ford truck sales disappointed. I have highlighted the "F150 indicator" and this month it dropped 4.3%. These Ford (NYSE:F) sales reflect sales to construction companies and small businesses. Bespoke has the story and an update of their regular chart:
The Ugly
The VA hospital scandal. The causes of delayed care will eventually be revealed. We can and must do better for veterans. The Senate will hold hearings. In the House, the "other Jeff Miller (R-Fla.)" is on the job. (The Hill).
The Silver Bullet
I occasionally give the Silver Bullet award to someone who takes up an unpopular or thankless cause, doing the real work to demonstrate the facts. Think of The Lone Ranger. No award this week. Nominations are always welcome.
Quant Corner
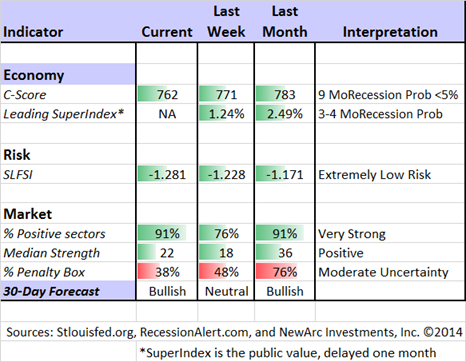
Whether a trader or an investor, you need to understand risk. I monitor many quantitative reports and highlight the best methods in this weekly update. For more information on each source, check here.
Recent Expert Commentary on Recession Odds and Market Trends
RecessionAlert: A variety of strong quantitative indicators for both economic and market analysis.
Bob Dieli does a monthly update (subscription required) after the employment report and also a monthly overview analysis. He follows many concurrent indicators to supplement our featured "C Score." One of his conclusions is whether a month is "recession eligible." His analysis shows that none of the next nine months could qualify. I respect this because Bob (whose career has been with banks and private clients) has been far more accurate than the high-profile TV pundits.
Doug Short: An update of the regular ECRI analysis with a good history, commentary, detailed analysis and charts. If you are still listening to the ECRI (2 ½ years after their recession call), you should be reading this carefully. Doug also has the best continuing update of the most important factors to the NBER when they analyze recessions. In general, you need to have a business cycle peak and then a significant decline. In contrast with Bob Dieli's method, this approach shows a possible peak in some of the elements. The most recent update includes employment.
Georg Vrba: Updates his unemployment rate recession indicator, confirming that there is no recession signal. Georg's BCI index also shows no recession in sight. For those interested in hedging their large-cap exposure, Georg has unveiled a new system.
Doug Short uses data from initial and continuing unemployment claims to analyze the probability of recession. Quant types will appreciate his data-driven analysis and fine charts. Some of the themes are similar to those we draw upon from Bob Dieli, and the conclusion is also familiar:
If history is a guide, the current percent ratios of weekly claims to the labor force contradict the minority view that the US is currently in recession (e.g., ECRI and a few bearish bloggers). Instead, the ratios suggests that even a near-term recession would be months in the future.
The Week Ahead
We have a light week for economic data.
The "A List" includes the following:
- Michigan sentiment (F). Good concurrent read on spending and employment.
- Retail sales (Th). We know that car sales were good. The rest of the story?
- Initial jobless claims (Th). Best concurrent read on employment.
The "B List" includes the following:
- Business inventories (Th). April data. More important because inventories were the key factor in Q1 GDP weakness.
- Wholesale inventories (T). April data. See above.
- JOLTS (T). This report is gradually getting more respect and attention. Look at the quit rate for a sense of overall labor market strength.
There will be more FedSpeak as well as news from China on inflation and retail sales.
How to Use the Weekly Data Updates
In the WTWA series I try to share what I am thinking as I prepare for the coming week. I write each post as if I were speaking directly to one of my clients. Each client is different, so I have five different programs ranging from very conservative bond ladders to very aggressive trading programs. It is not a "one size fits all" approach.
To get the maximum benefit from my updates you need to have a self-assessment of your objectives. Are you most interested in preserving wealth? Or like most of us, do you still need to create wealth? How much risk is right for your temperament and circumstances?
My weekly insights often suggest a different course of action depending upon your objectives and time frames. They also accurately describe what I am doing in the programs I manage.
Insight for Traders
Felix sees more opportunities -- fresh buys in the ETF universe, as more sectors emerge from the penalty box. A high penalty box level implies less than normal confidence in the ratings. This week we were fully invested in the top three sectors for our trading accounts.
The overall call remains very close between bullish and neutral. Even in a neutral market there are often good sectors to buy. This week Felix is even more bullish for our three-week time horizon.
Insight for Investors
I review the themes here each week and refresh when needed. For investors, as we would expect, the key ideas may stay on the list longer than the updates for traders. The current "actionable investment advice" is summarized here.
The market did not provide much opportunity for fresh buys. The gentle upward action is fine for long-term investors and excellent for those trying out our Enhanced Yield approach.
Here are some key themes and the best investment posts we saw last week:
David Tepper has been reassured. Tepper famously made a "Fed has your back" comment that started a rally in late 2010. The idea was that economic strength did not matter since the Fed would act if necessary. Stocks rallied that very day. While the idea was not unique, it carried credibility when coming from a top hedge fund manager. At the recent SALT conference Tepper said he was nervous about the market, apparently sparking 40-50 bps of pull back. This week he professed some satisfaction with the ECB action, although he sees them as still "behind the curve." While I think that too much is made of this, it is worth reviewing.
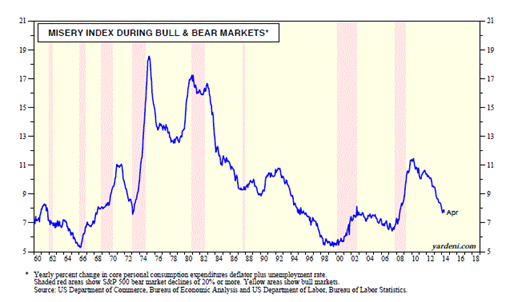
The bull market has plenty of time to run according to Ed Yardeni – at least another year. He shows the relationship with Arthur Okun's misery index and illustrates with a helpful chart:
Eddy Elfenbein explains that the rotation to value stocks is "still on." Check out his ETF-based chart.
I provided some advice for young investors. My hope is to make this an ongoing resource on my site. Please take a look and offer some comments. Some readers wrote that they passed the information along to young people in their lives. I hope that many find it helpful and it stimulates more ideas and sharing.
Want to be like Warren? Here is an interesting analysis of how he succeeds. "It may be possible to build, in essence, a Buffett-bot portfolio. No Oracle required."
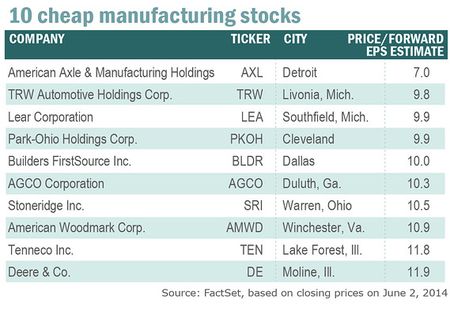
There are still plenty of interesting ideas for cheap stocks. Here is an interesting list from MarketWatch:
If you are worried about possible market declines, you have plenty of company. It is possible to get reasonable returns while controlling risk. Check out our recent recommendations in our new investor resource page -- a starting point for the long-term investor. (Comments and suggestions welcome. I am trying to be helpful and I love and use feedback).
Final Thought
The last few weeks have reflected a continuing improvement in economic data. While I do not like to use a "weather" excuse, I also insist on recognizing reality. Some of the economic activity in Q1 was lost forever. Some was pushed forward, creating an artificial boost. It may take a few months to see the actual trend.
Housing is not reacting as positively as auto sales. Employment is a little better, but not great. Corporate profits are encouraging.
Scott Grannis pulls this all together, explaining that 2% job growth, boring as it may seem, implies higher P/E multiples and rising interest rates. The key? No recession in sight. That has been my theme since I noted the weakness in the ECRI method and replaced them in my forecasts, many months before their erroneous recession prediction.
I agree with Josh Brown that full year GDP forecasts will be lower, but only because the upbeat year-end data must blend the known negative data from Q1. The list of 26 worries is an essential part of the trek to Dow 20K, my forecast from four years ago.

