
It’s all about the Euro as Friday gets underway. The ECB was utterly and without any ambiguity much more dovish than the market had anticipated after it revealed a trifecta of measures (lower growth forecasts, push out of the forward guidance and a new TLTRO program).
Quick Take
It’s all about the Euro as Friday gets underway. The ECB was utterly and without any ambiguity much more dovish than the market had anticipated after it revealed a trifecta of EUR-negative measures (lower growth forecasts, push out of the forward guidance and a new TLTRO program).
One thing is to speculate on the ultimate outcome of what appears inevitable, that is, that sooner or later the ECB would fully cave in by recognizing there is no way in hell they can exit their unorthodox policies. Another thing very different, and that’s what makes trading financial market such a challenging endeavor, is timing when the domino pieces will start falling. Judging by the reaction of the Euro - lowest against the USD since mid-2017 -, the market was caught by surprise not expecting such boldness in the ECB rhetoric.
After the dust settled, we face a Euro battered, a Pound unable to find renewed demand on lack of Brexit breakthroughs, a USD and JPY being the safest houses as micro/macro ‘true risk off’ conditions settle in, while the commodity complex suffers fundamentally gloomy times, especially the AUD and CAD.
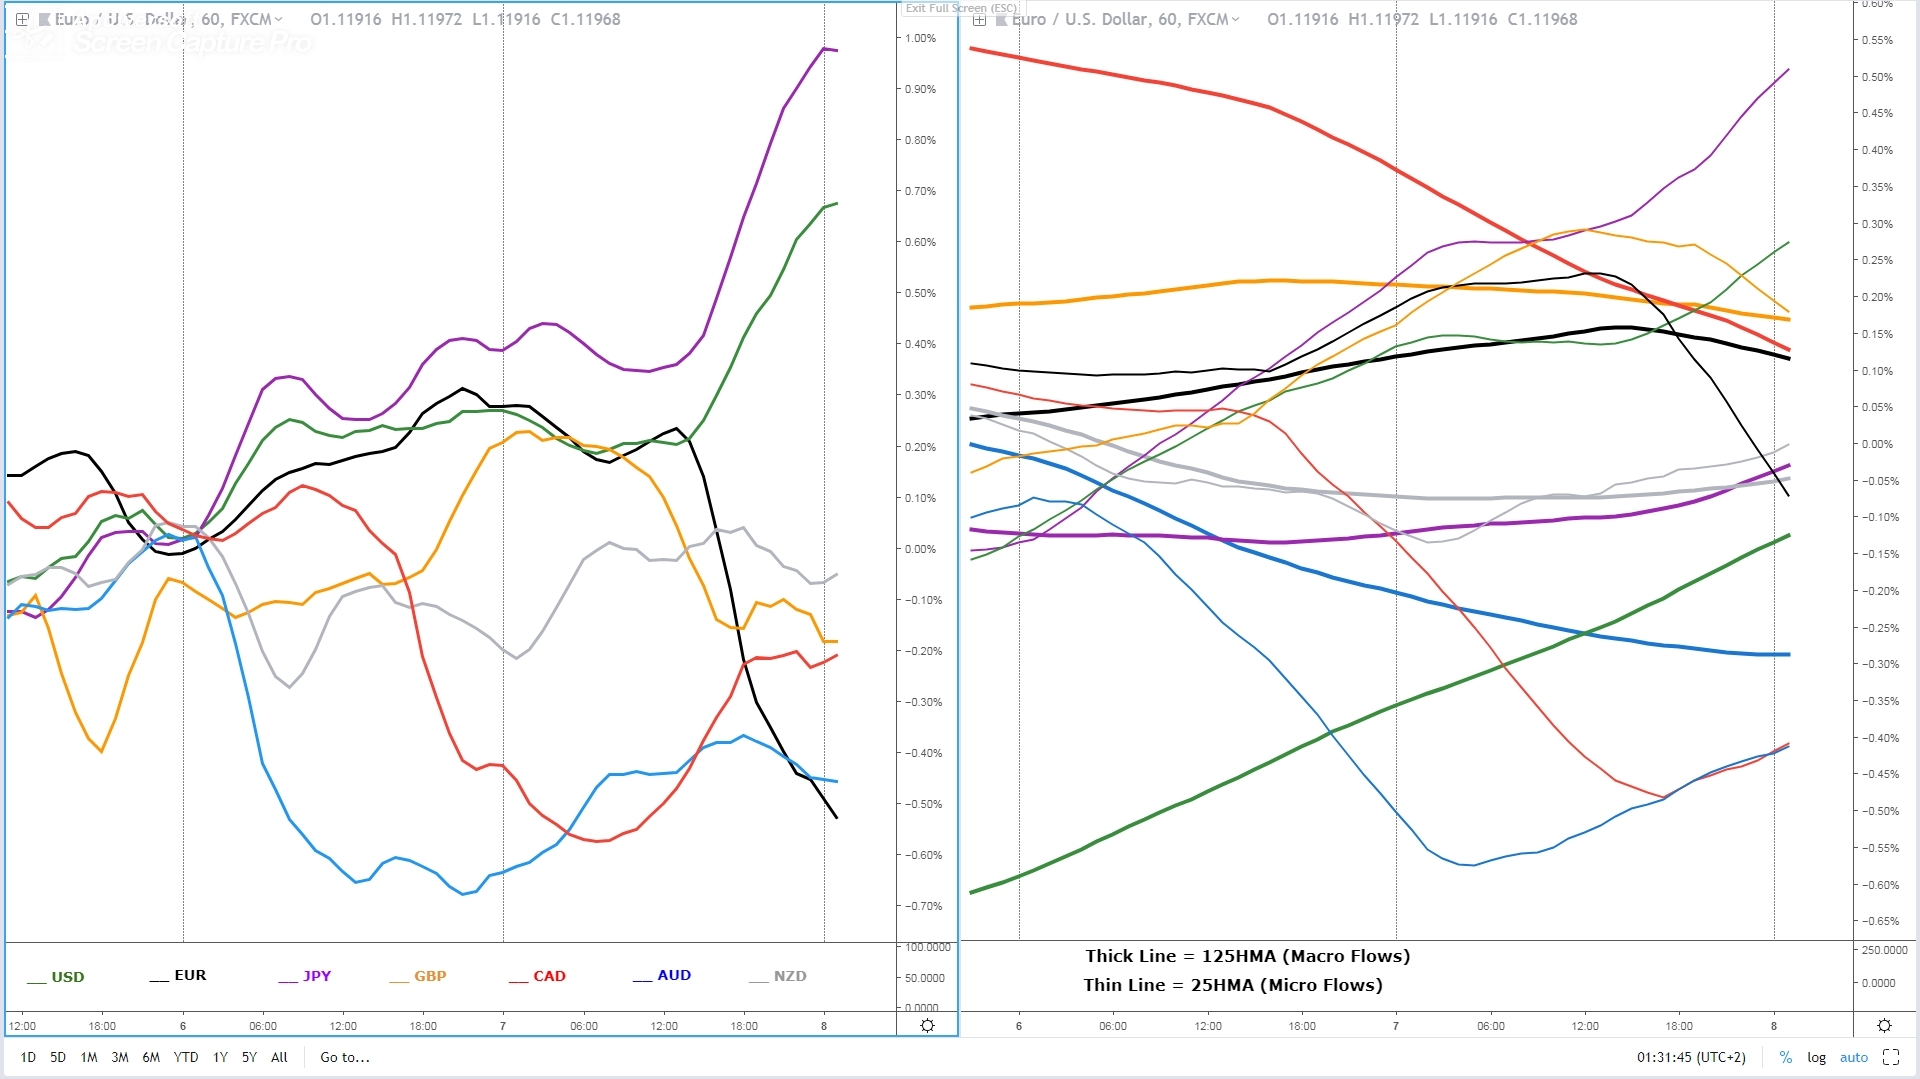
Currency Strength Meter
The Euro got hammered on the back of what’s coined in some reports I've been reading this morning as Draghi’s triple, that is, the admission that an exit from its negative rates settings won’t occur in 2019, the downgrade in growth and a new TLTRO. Meanwhile, on the other side of the spectrum, the Japanese Yen and the US Dollar were propelled to much higher levels on the combination of EUR weakness (by default DXY positive) and ‘true risk off’. Sandwiched in relatively confined ranges were the commodity currencies, while the Sterling also came under pressure as pessimism over a breakthrough in the UK-EU Brexit talks reign.
So, where does the latest fluctuation in currency prices leaves us from a trend-generation standpoint? Right off the bat, we can see the Euro is joining the Canadian Dollar in macro bearish dynamics as the thick lines in the 2nd chart below exhibit. Interestingly, the Pound has also lost enough steam to show bearish tendencies at a macro level (measured by the 5-DMA slope). On the contrary, the USD and the JPY have risen victorious courtesy of the latest deleveraging spell by projecting bullish dynamics, both from a micro and macro perspective. Lastly, we see the Oceanic currencies, finding enough pockets of demand, especially the Kiwi, to keep its micro and macro outlook mildly bullish.
Narratives in Financial Markets
- ECB President Draghi finally conceded defeat on its overly hawkish outlook of the European economy by revealing a new round of TLTRO (cheap funding for banks), downgrading the growth forecast and most importantly, pushing further out the forward guidance in rates. As a result, the Euro trades at the lowest since mid-2017 against the US Dollar.
- The majority of Brexit-related reports had a common denominator. There is no breakthrough in amending the divorce deal between the UK and the EU. There has been reports of a new offer made by the EU to the UK on the backstop which appears to fall short of UK demands. Reuters expanded on the story by noting nothing suggests anything will change in talks in the next 48h.
- According to a story by the NYT, Chinese officials are increasingly worried about any last minute changes in a trade deal between the US and China. As the NYT notes, “some of the biggest details like the enforcement mechanism and the timing for the removal of tariffs still haven’t been hammered out. China is worried that details may not be as favorable.”
- On the back of the dovish outcome during Wednesday’s BoC policy meeting, BOC Deputy Lynn Patterson presented the latest projections as part of the economic progress report. It turned out to be a reiteration of what the statements carried by the BOC statement. In a way, what this latest report shows is that their forecasts have been highly inaccurate and need more time to find out how bad things can get from here on out, which is a pattern among G10 Central Banks.
Recent Economic Indicators & Events Ahead
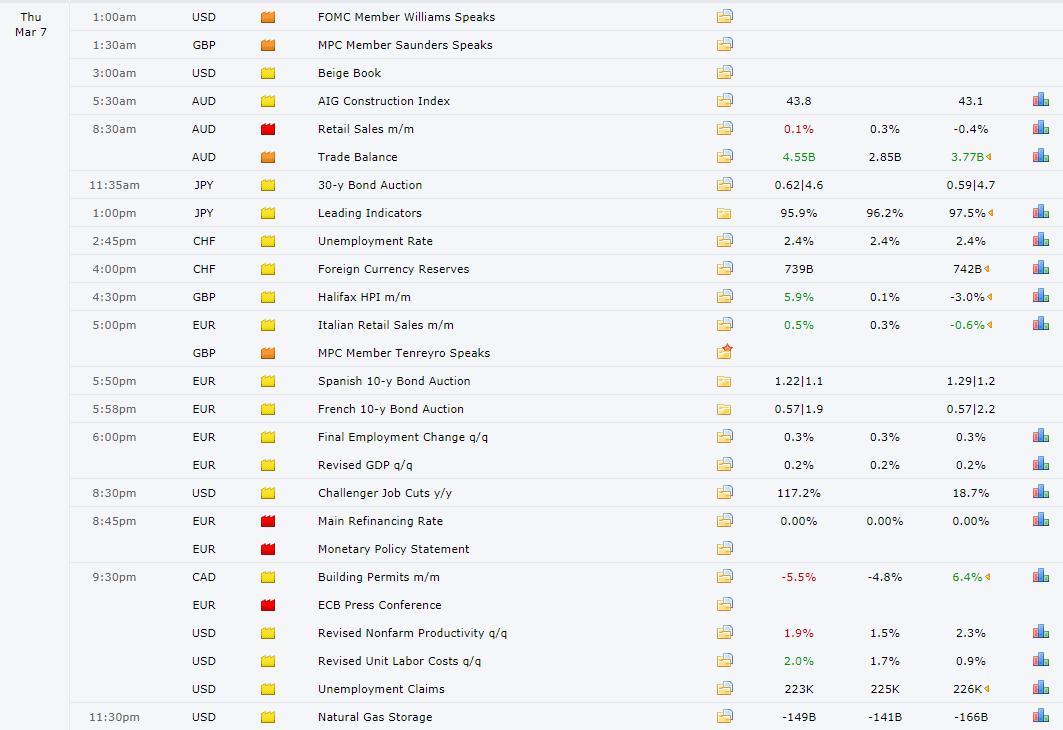
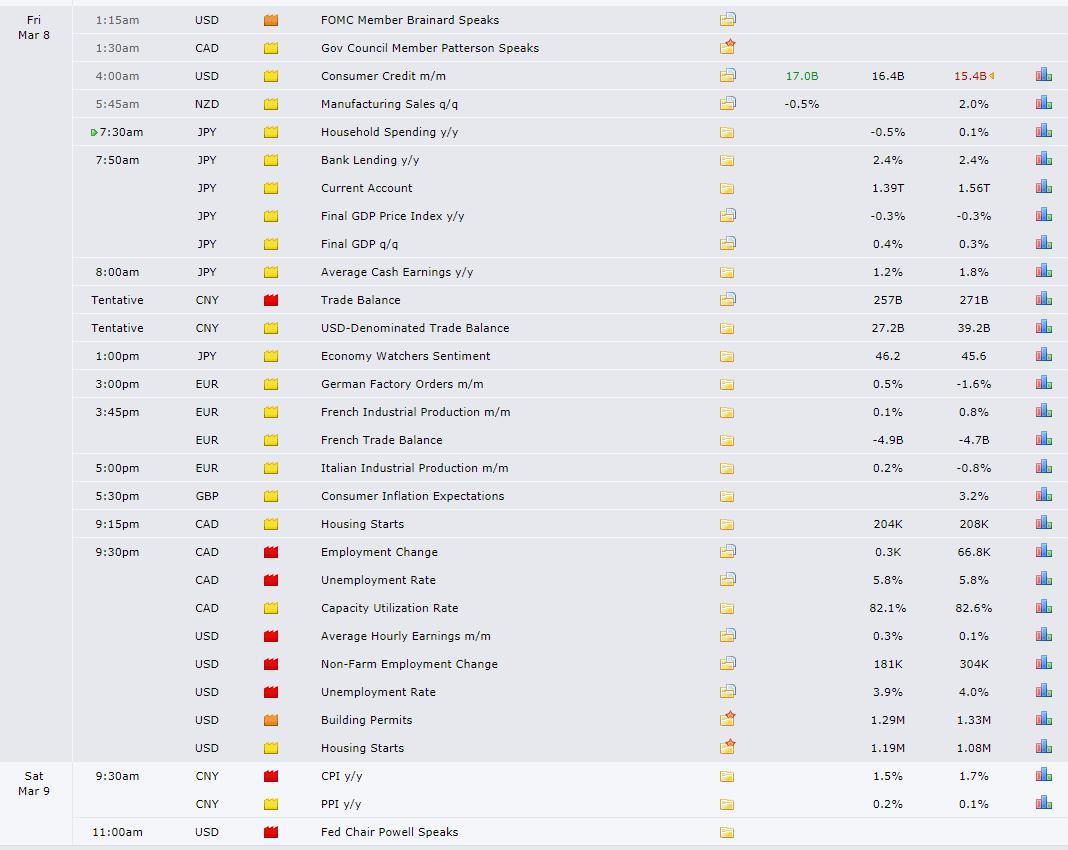
Source: Forexfactory
RORO - Risk On Risk Off Conditions
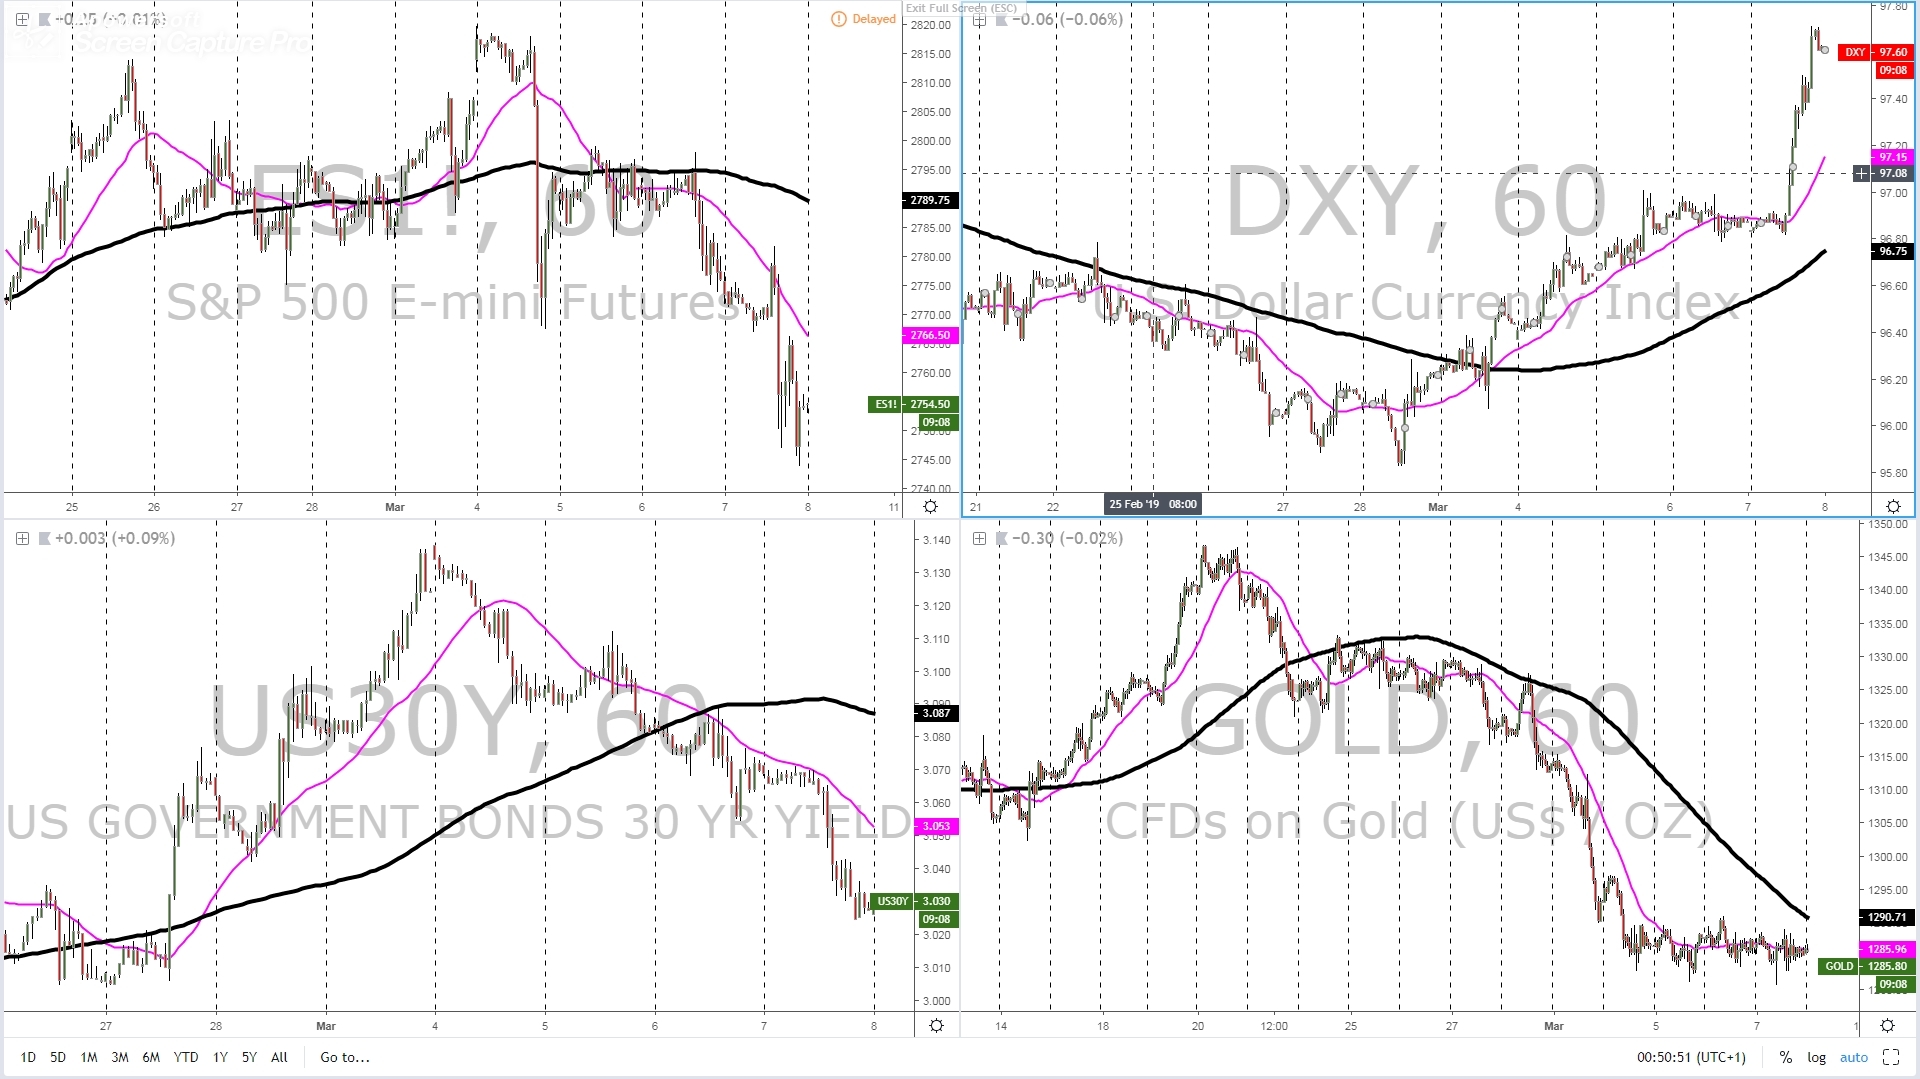
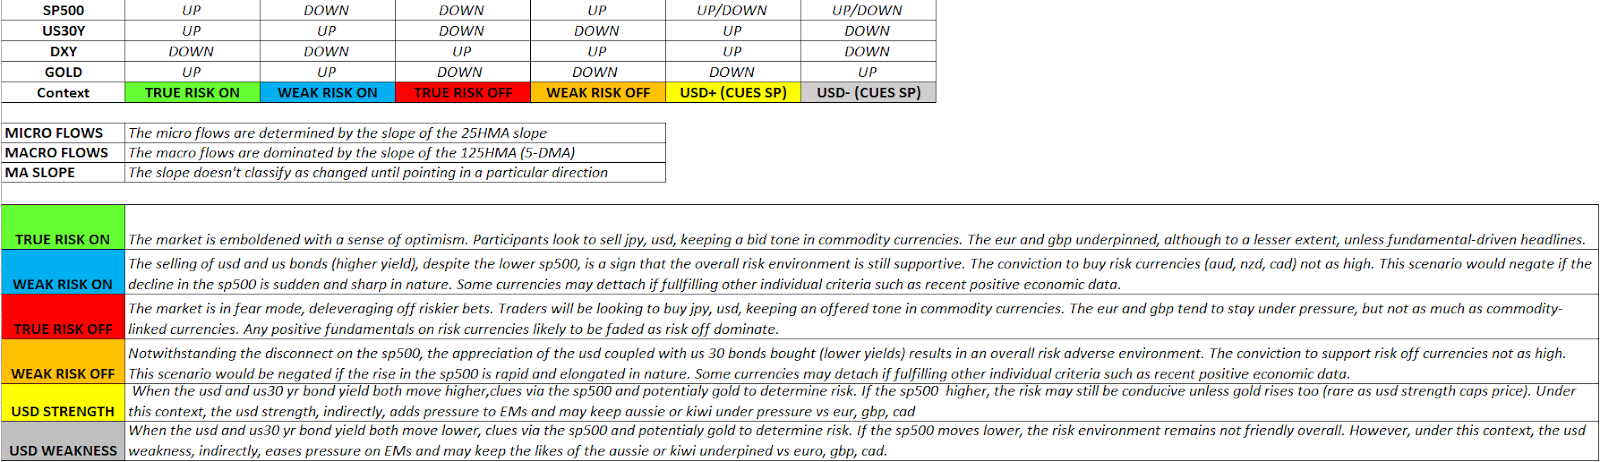
The pronounced downward angle of the 25-HMA slope states a clear fact, that is, the microenvironment has firmed up its ‘true risk off’ nature. But it gets worse, as we've also permuted into a macro ‘true risk off’ backdrop following the aggressive movements in equities (down), US bond yields (down) and the DXY (up). To top it off, gold has found very strong buy-side interest to counter-balance the strong rise in the DXY and keep the precious metal in a tight range.
As a reminder, a ‘true risk off’ environment is characterized by a market that is in fear mode, deleveraging off riskier bets. Traders will be looking to buy two currencies above all others (JPY and USD), keeping an offered tone in commodity currencies unless other currencies get hit by negative fundamentals/politics, as it’s the case of the Euro on the ECB dovish turnaround or the GBP on Brexit. This has caused the European currencies to suffer greater losses than commodity-linked currencies even in a ‘true risk off’ context.
Dashboard: Intermarket Flows & Technical Analysis
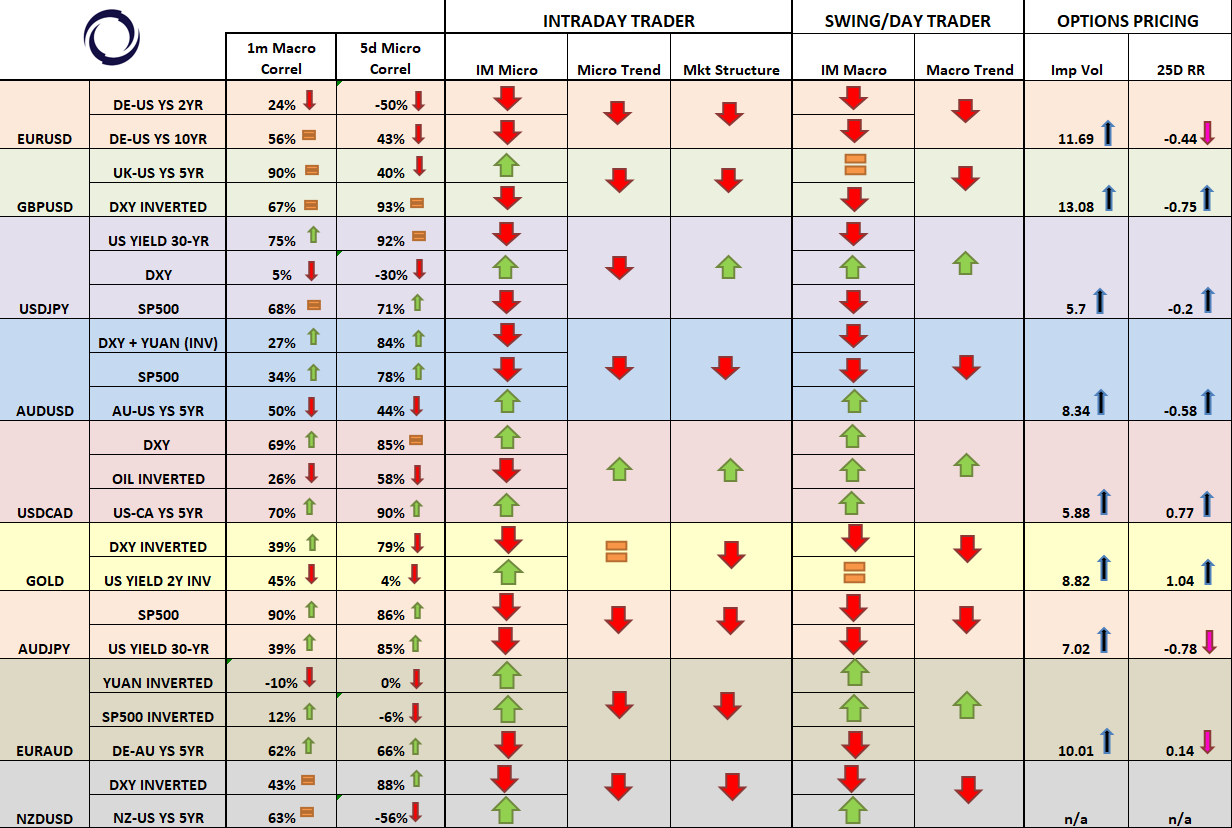
Summary: Intermarket Flows & Technical Analysis
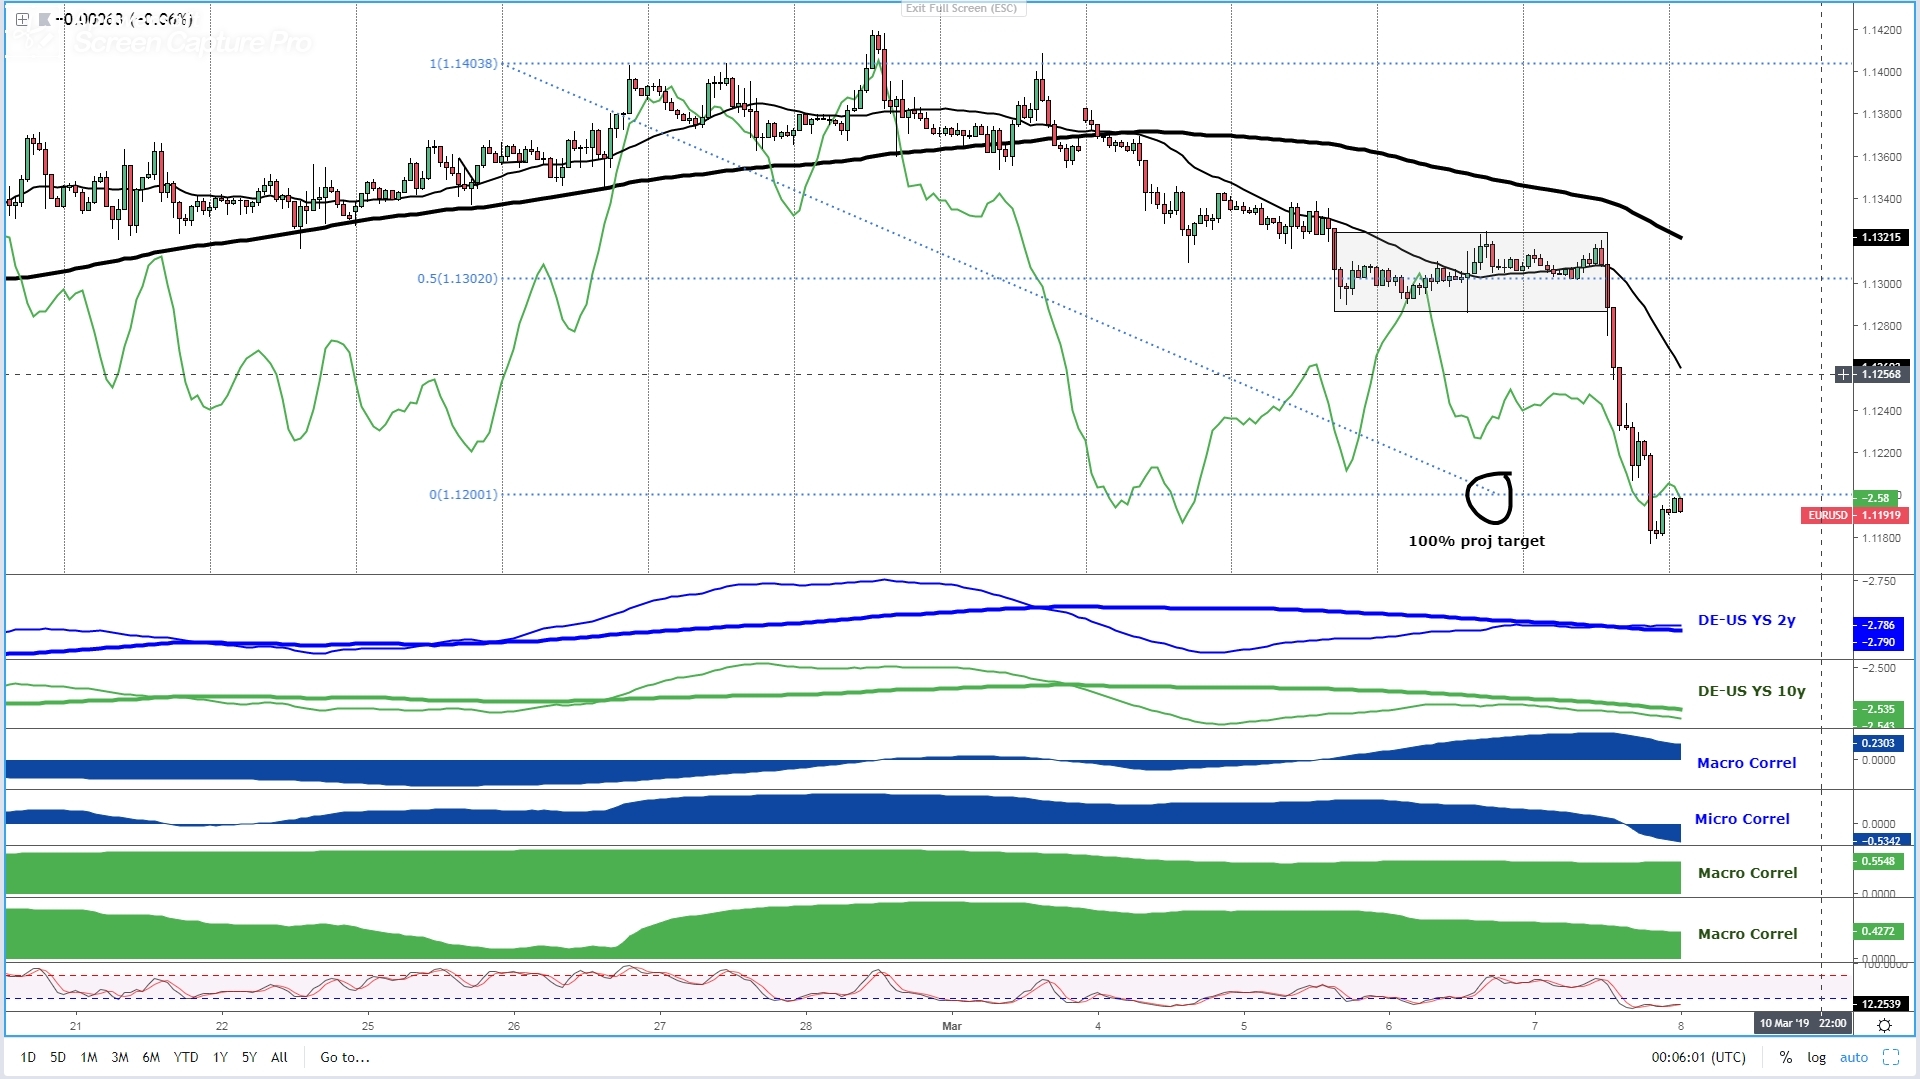
EUR/USD: Massive Mark Down As ECB Reveals Dovish Trifecta
- The triple news by the ECB included slashing growth, deferring exit of negative rates and the announcement of a new TLTRO, leading to a major re-adjustment of the Euro value.
- The next focal point includes the US NFP figures. One must be prudence if exposure heading into the high-impact volatile event. A headline number of 181k is expected.
- The breakout of the 1.12 could unravel a marked improvement in the low vol regime of the pair after many months of depressed market fluctuations.
- No signs of buying interest at the elongated lows, with the latest push by the sellers even breaking through a 100% projection target based on the last POC print.
- The combination of negative ECB-induced fundamental news, no progress in Brexit, risk-off tone has promoted increased supply imbalanced in the pair.
- The main ‘leading’ indicator of the EUR/USD continues to be, as per the macro/micro correlation coefficients, the 10-year yield differential between Germany and the US.
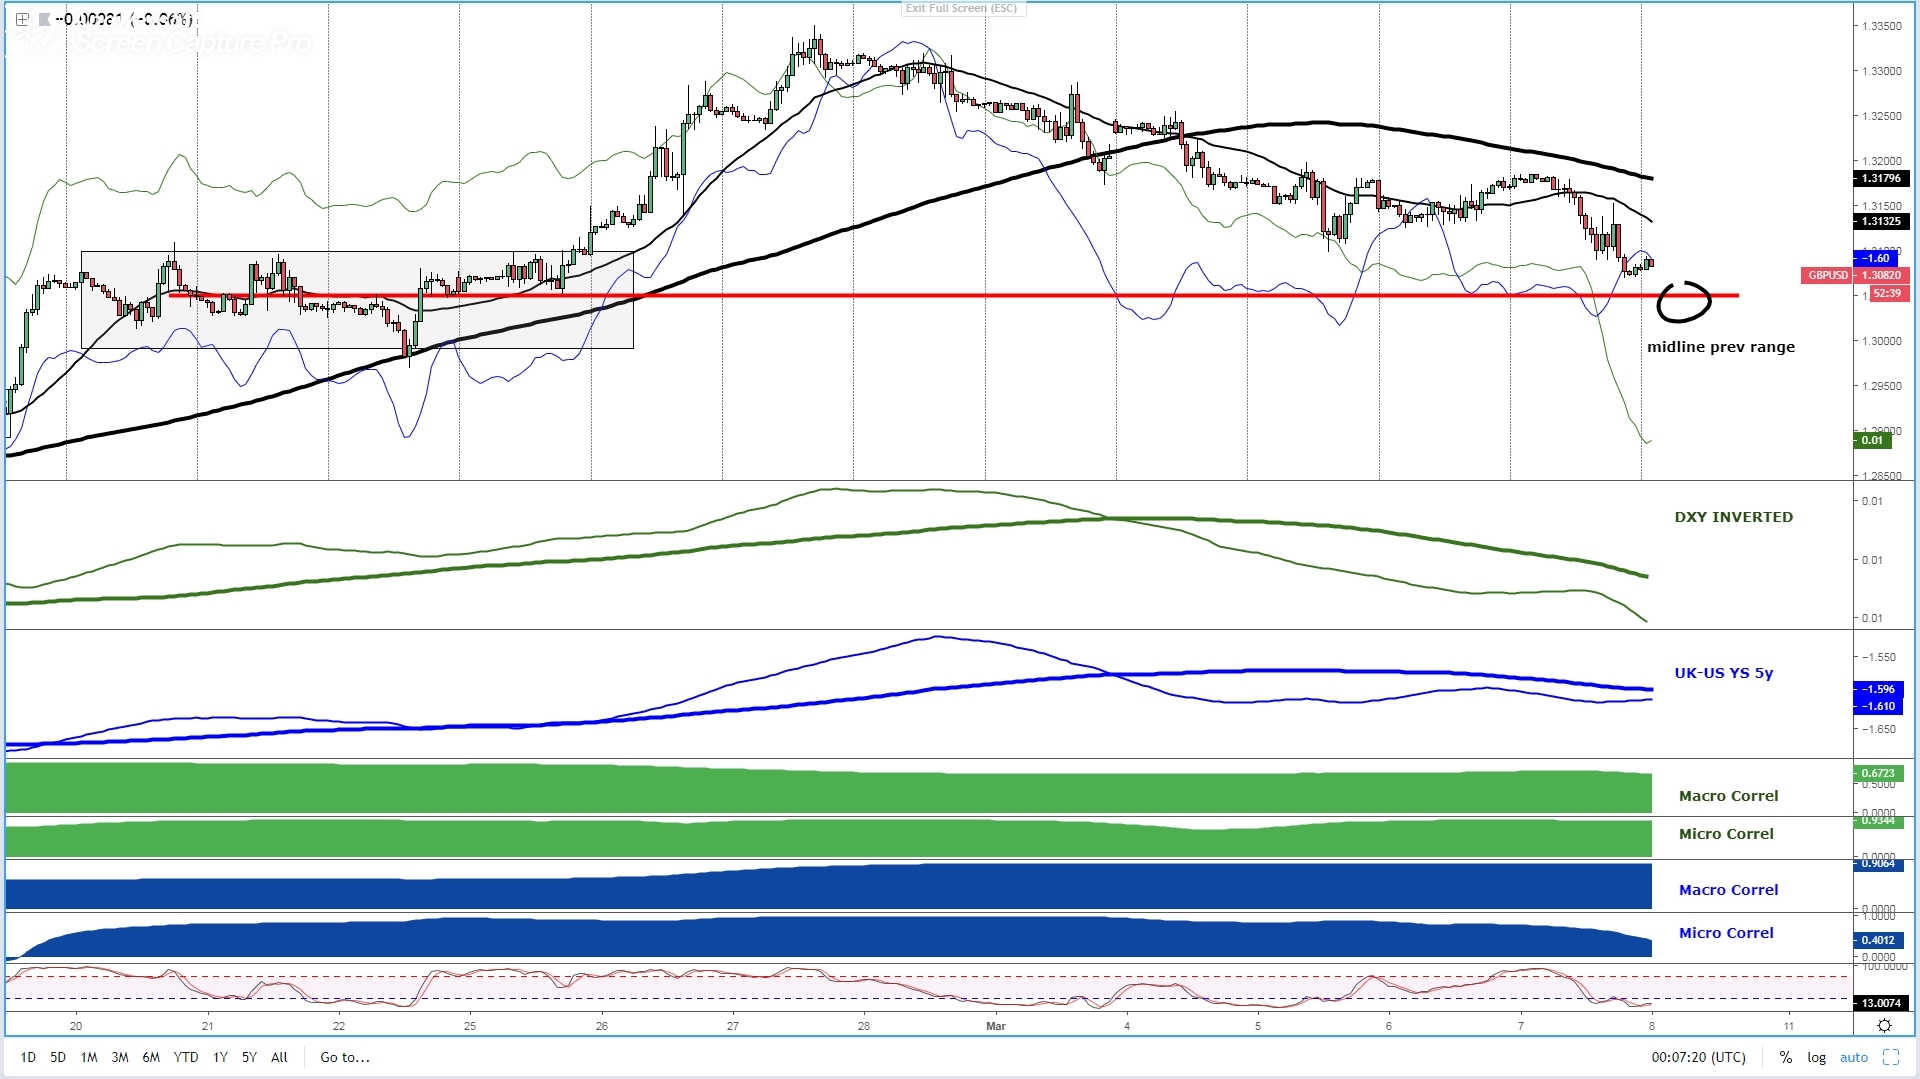
GBP/USD: DXY Strength Offsets Improvement in Yield Spread
- No Brexit breakthrough, DXY fortitude added further pressure on the Sterling, even if the slide in prices is starting to show a tepid divergence with a rising UK-US yield spread.
- The next focal point includes the US NFP figures. One must be prudence if exposure heading into the high-impact volatile event. A headline number of 181k is expected.
- The micro and macro cycles have turned bearish but the real test comes upon a breakout of the 1.3050/1.30 area (POC last range + round number).
- It’s going to take a deterioration in the Brexit headlines to see a further unwinding of longs as the run in DXY mainly a function of EUR weakness plus spells of risk-off.
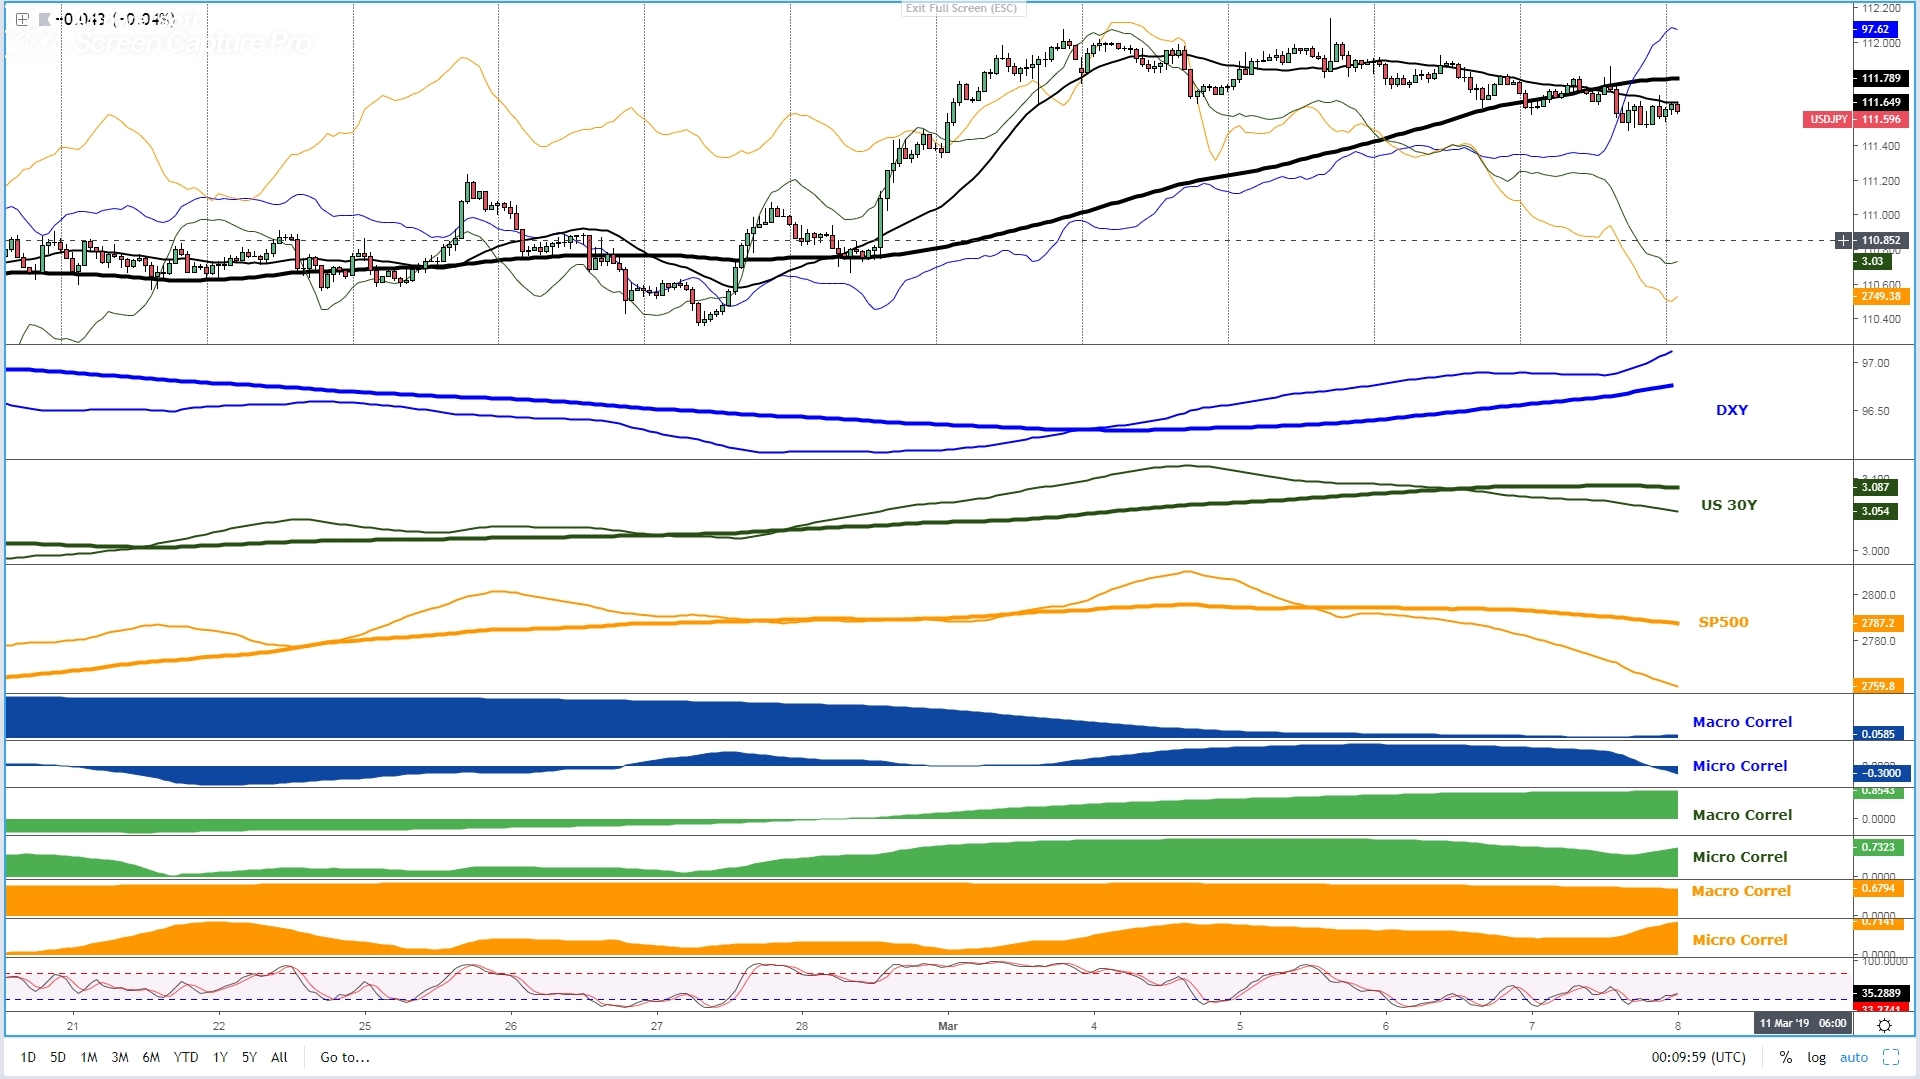
USD/JPY: Low Vol Gyrations As ‘True Risk Off’ Dominates
- Fairly balanced flows as both currencies benefit from cross-asset flows. The DXY spike post ECB offsets the textbook ‘true risk off’ move by equities and fixed income.
- The next focal point includes the US NFP figures. One must be prudence if exposure heading into the high-impact volatile event. A headline number of 181k is expected.
- The contained pullback at times of ‘true risk off’ bodes well for the pair conditioned to the benign outlook in the DXY. A recovery in equities and/or yields necessary to resume uptrend.
- The corrective nature of the price action in the last week vs impulsive rally from late Feb suggests the order flow is still very much constructive of higher prices.
- The loss of correlation between the pair and the DXY is simply a reflection of the ‘true risk off’ nature of the current market conditions, where the Yen tends to be king despite a rising USD.
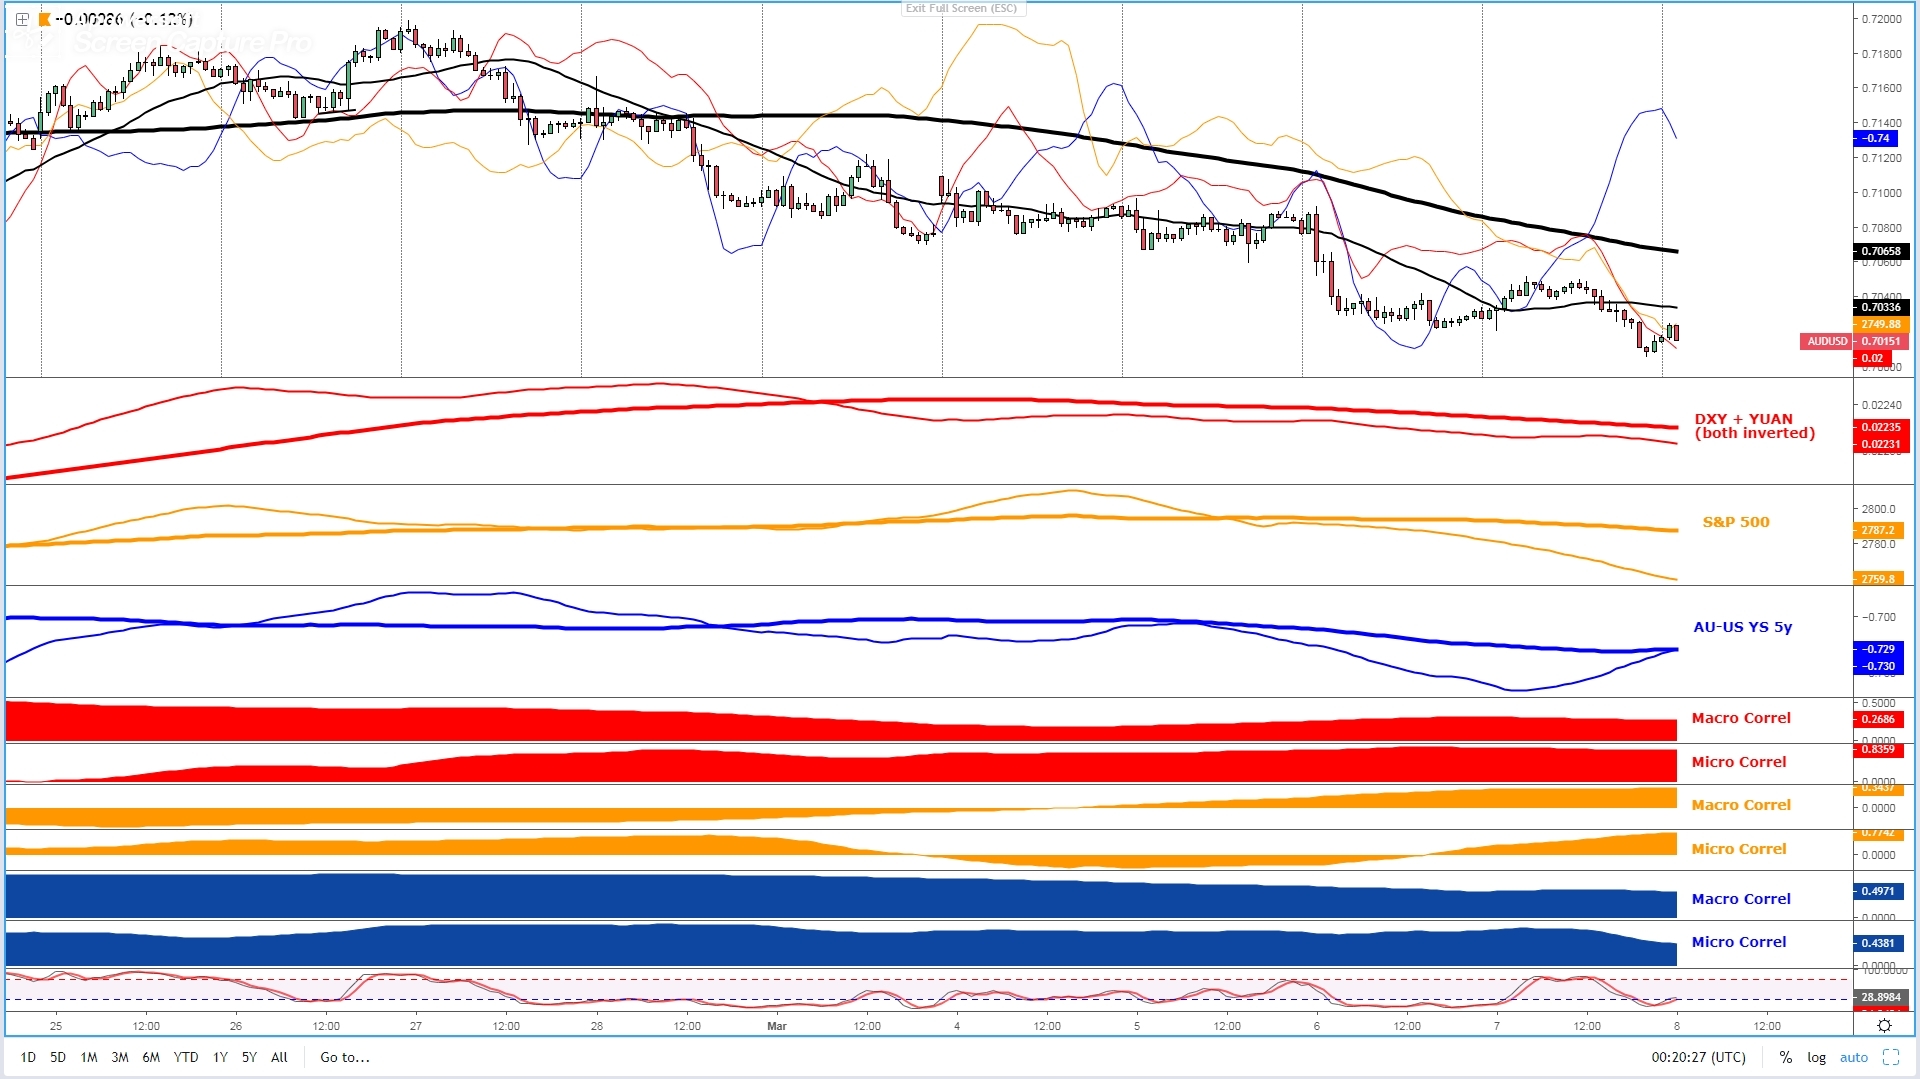
AUD/USD: Accentuated Divergence W/Yield Spreads Amid Risk-Off
- The Aussie is starting to look cheap if accounting for capital flows in search of yields as the bond yield differential between Australia and the US improves further…
- The next focal point includes the US NFP figures. One must be prudence if exposure heading into the high-impact volatile event. A headline number of 181k is expected.
- However, in an environment of ‘true risk off’, the drop in equities (rising correlation) alongside the strength in the DXY so far counterbalances the positive yield spread development.
- The micro and macro trend derived off price action still argues the path of least resistance remains lower even if major buy-side interest is expected at 0.70c.
- Any signs of strength in equities or fixed income that may relax the ‘true risk off’ conditions may provide a genuine buy-side opportunity around the round number, but remember US NFP.
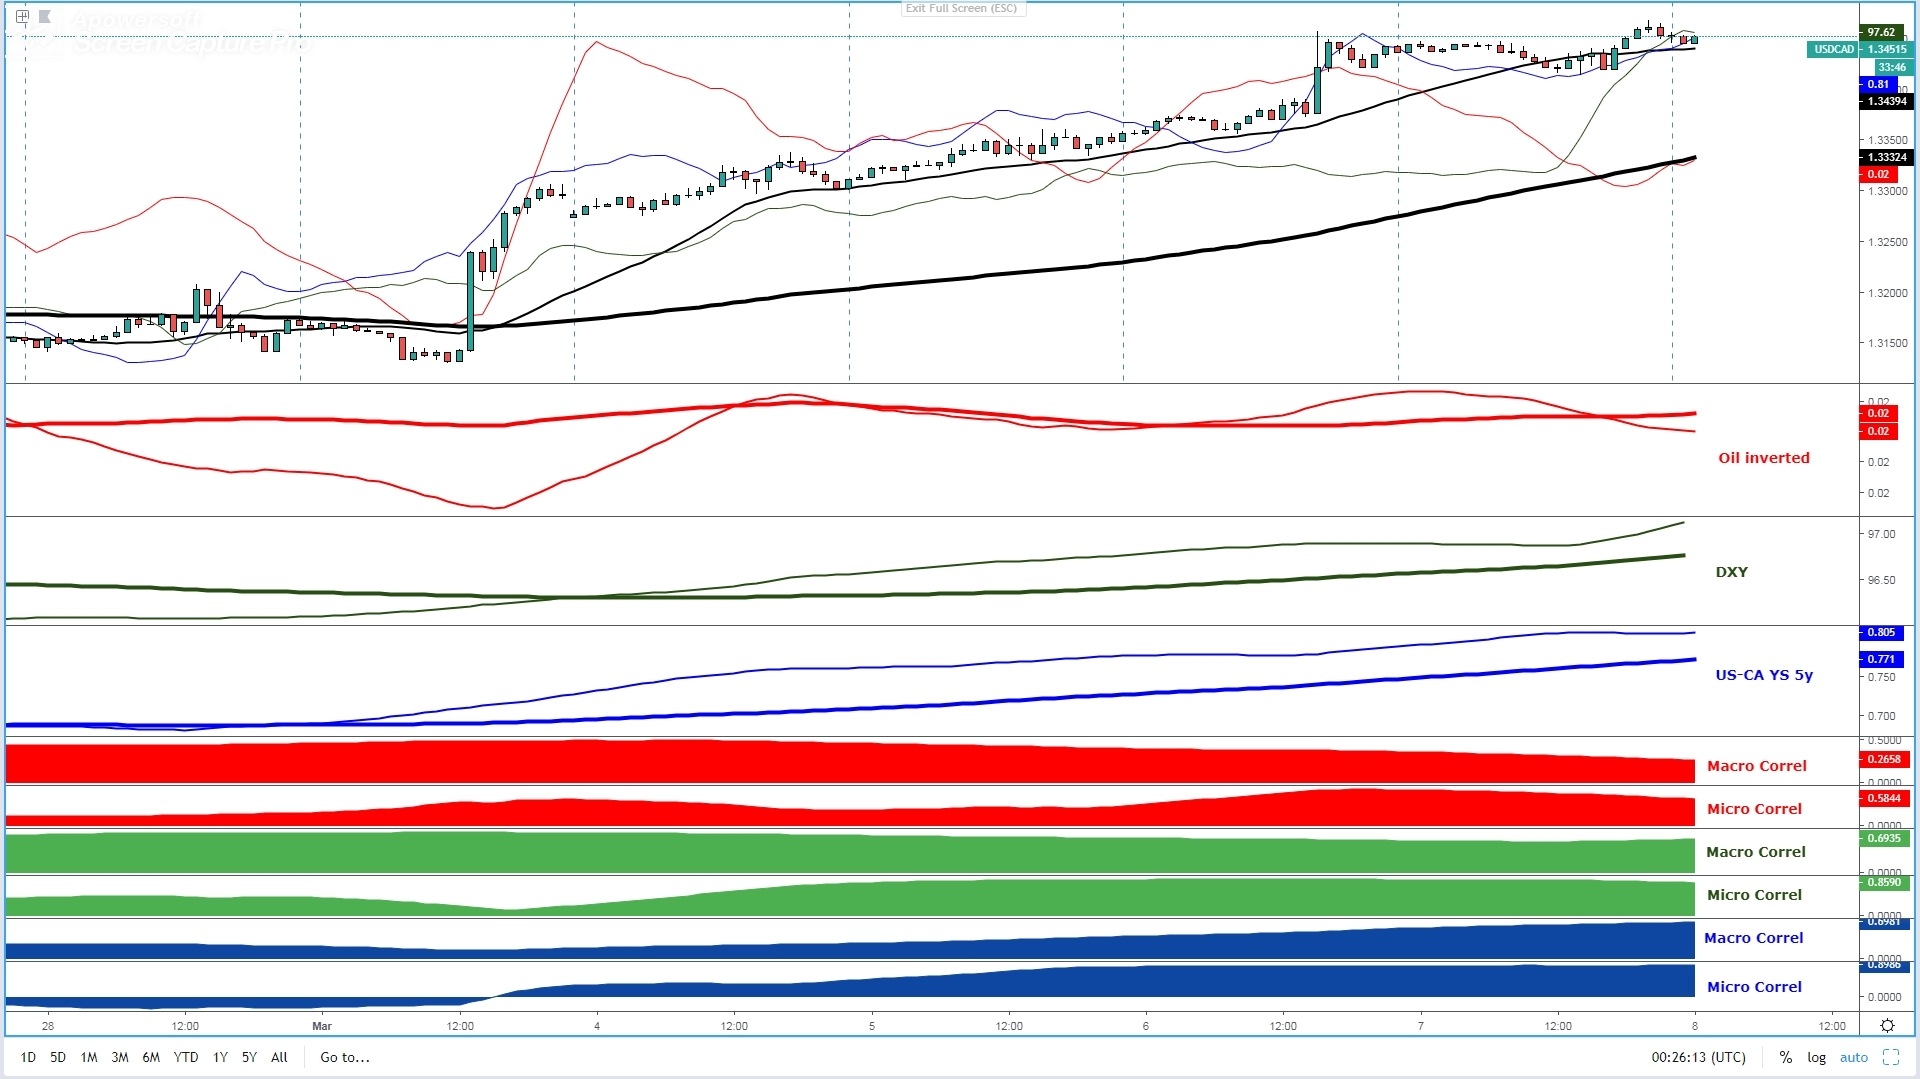
USD/CAD: Running Risk Of Long Liquidations After 3 Cents Rally
- Whenever we see a pair experience a 300 pips rally from bottom to top under the lowest vol regime in years, be wary of the risks of long liquidations near-term.
- The next focal point includes the US NFP + Canadian job figures. One must be prudence if exposure heading into the high-impact volatile events.
- Significant divergence with Oil but beware the energy instrument has been gradually decoupling as a reliable indicator with the DXY and bond yield spreads playing a greater role.
- Any pullback is seen as a buy-side opportunity at key decision points in what’s become one of the clearest trending markets ever since the miss in Canadian GDP, and then exacerbated by a dovish BOC and the transition into ‘true risk off’ conditions.
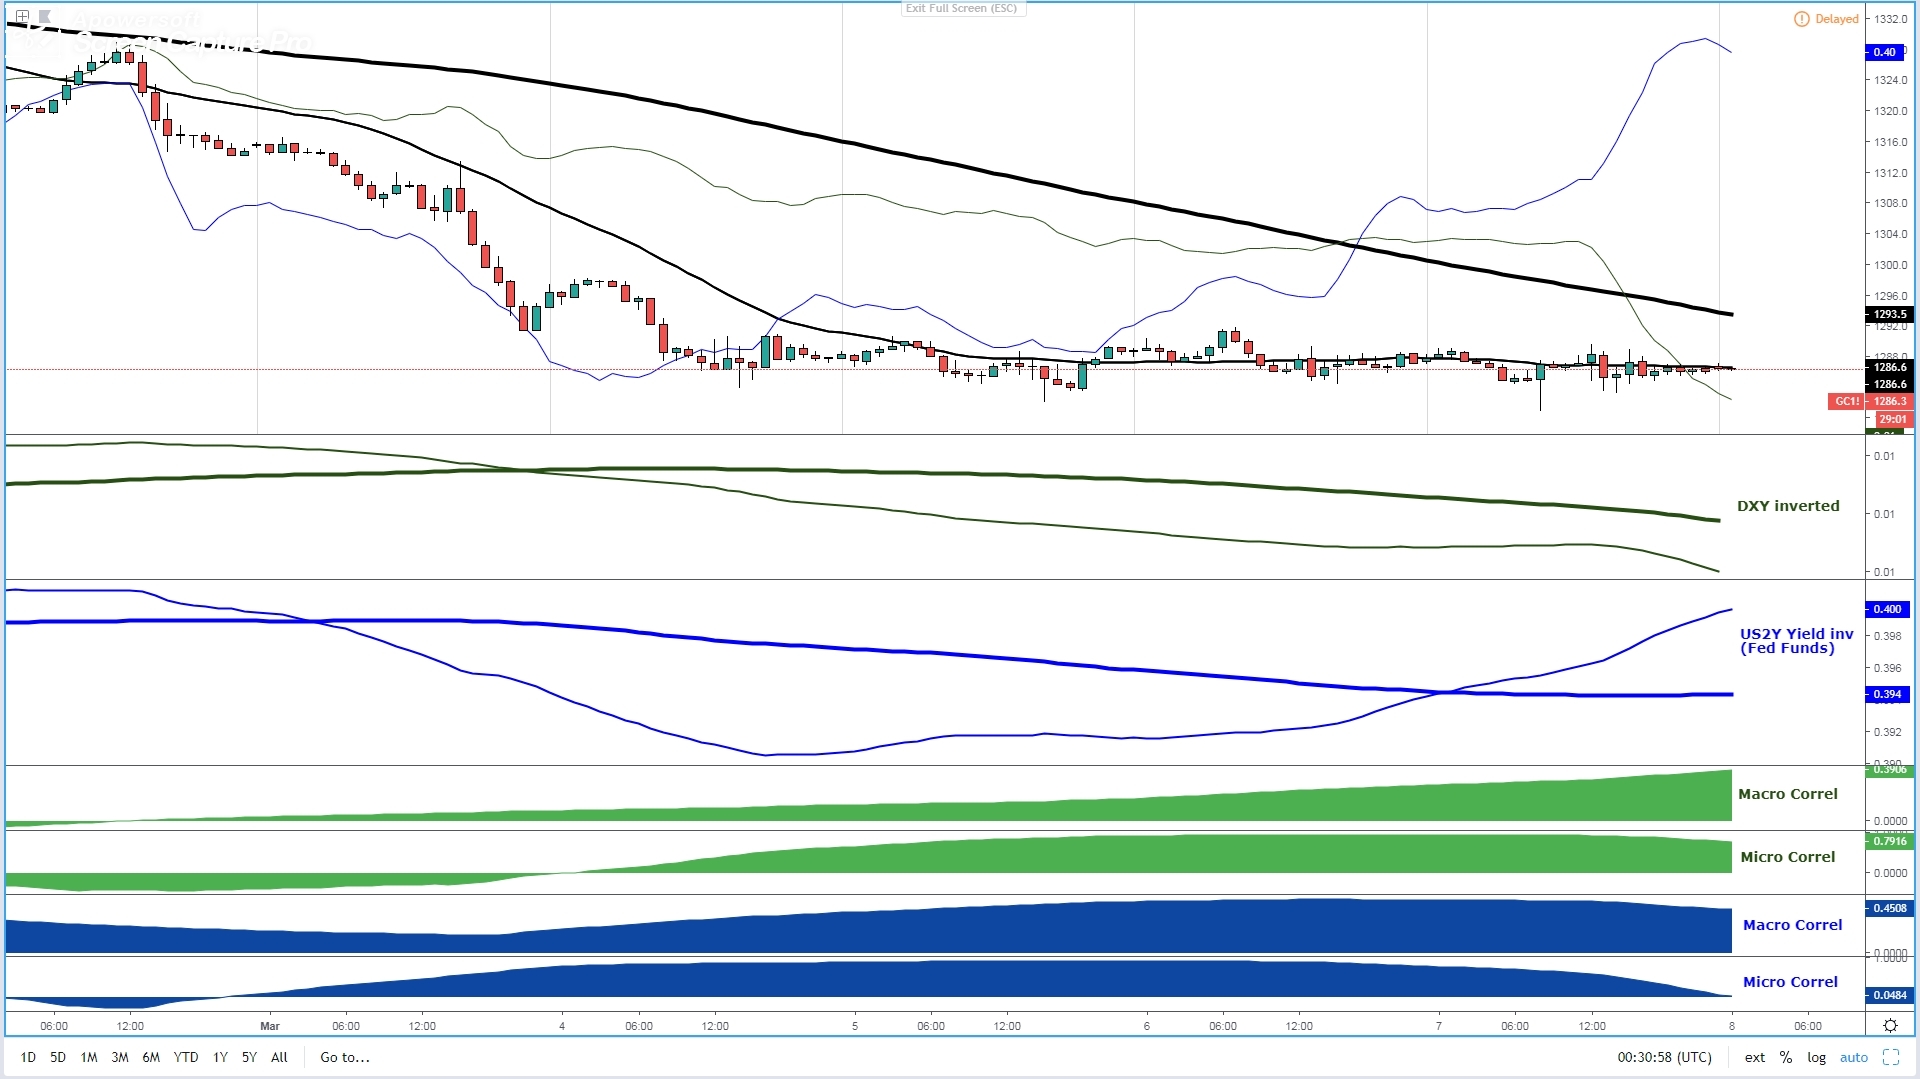
Gold: Low Interest As Conflicting Signals Emerge
- The two strongest correlated assets (DXY, US02y) driving the price of gold are moving in completely opposite directions, keeping the directional bias neutral.
- The next focal point includes the US NFP figures. One must be prudence if exposure heading into the high-impact volatile event. A headline number of 181k is expected.
- Break outside the current narrow range is a precondition to engaging away from the noise in anticipation of the next expansion in price after 4 days of consolidation.
- The consolidation of the price could be interpreted as absorption at a critical demand juncture with reference dating back Jan 21-24, when a strong demand originated.
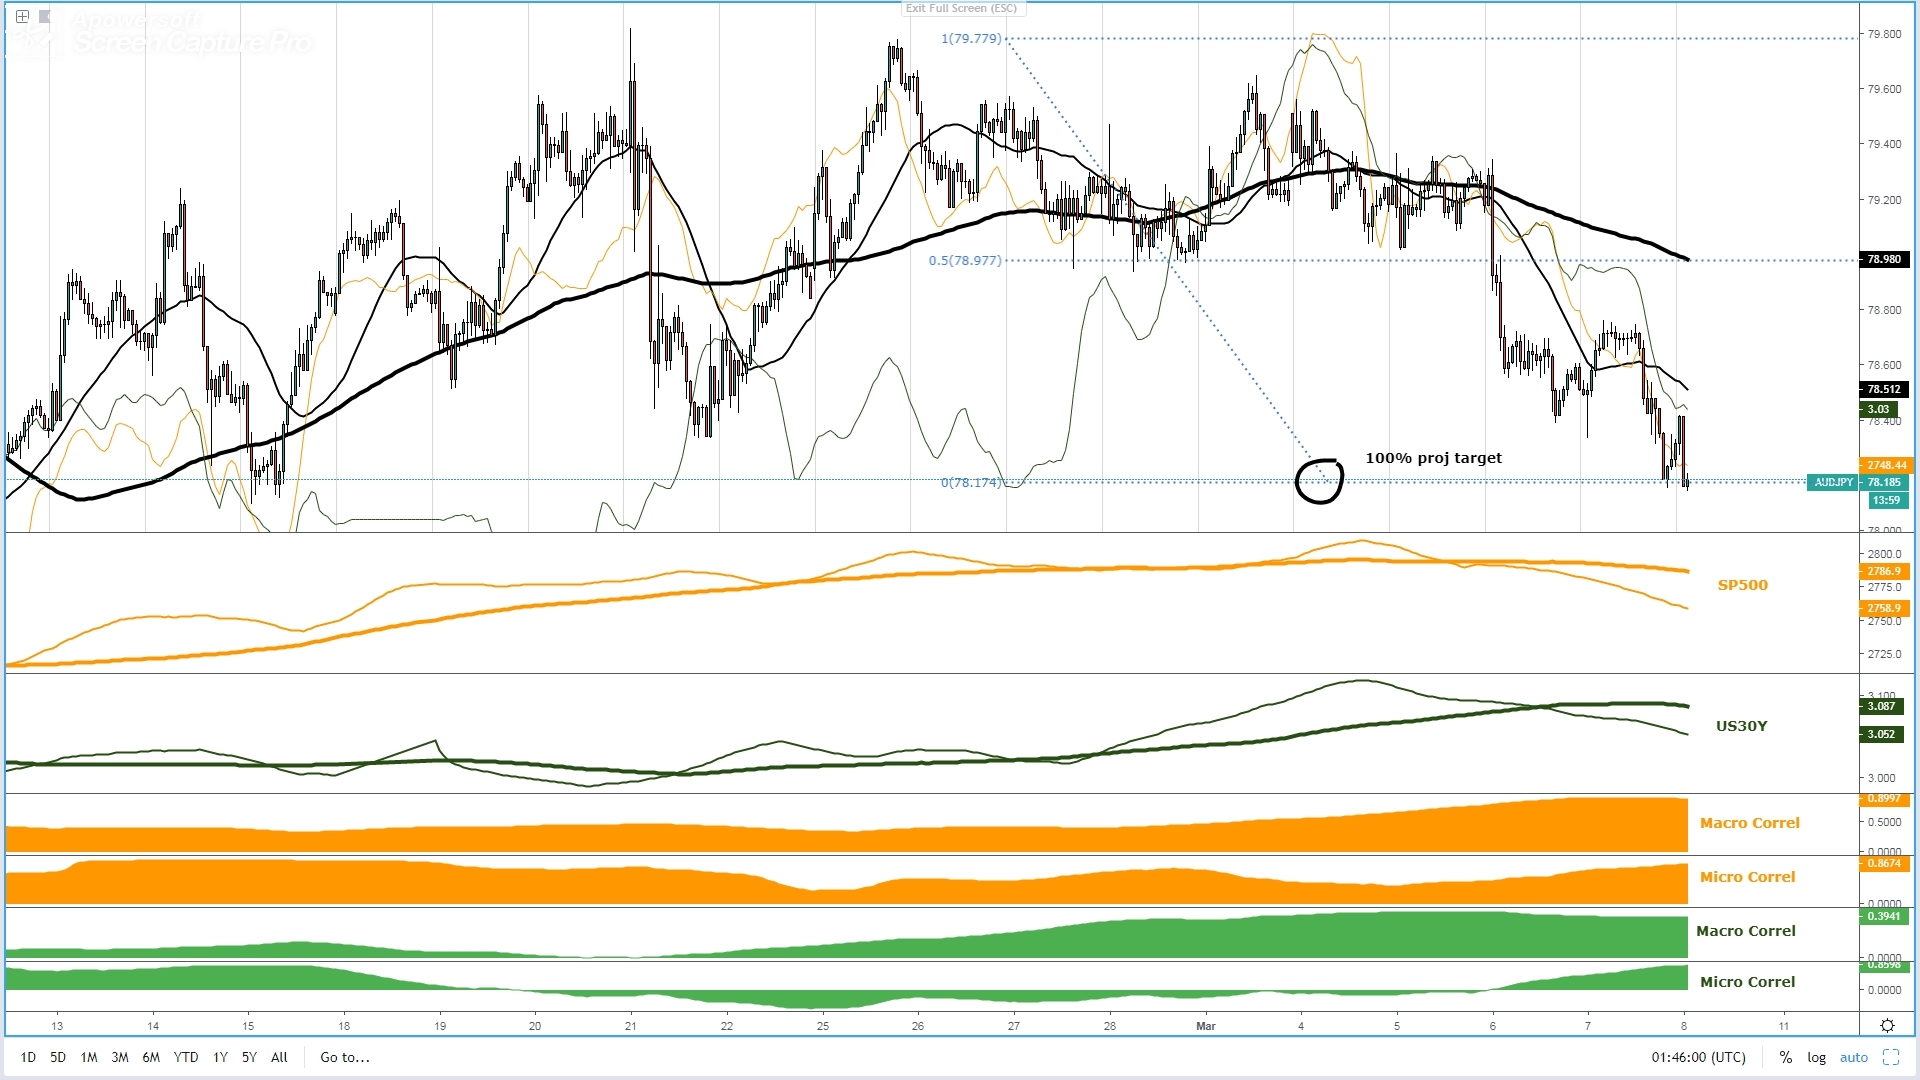
AUD/JPY: Perfect Bearish Storm This Week
- Not only the data out of Australia has come softer-than-expected (Q4 GDP, retail sales) but the ‘true risk off’ has exacerbated the pain in the Aussie vs Yen exchange rate.
- A cluster of bids is expected around the 78.20-78.00 vicinity where a 100% proj target off the 79.80-79.00 range meets with a psychological round number.
- The impulsivity of the selling flows vs the corrective nature of the buy-side action is a clear indication of a market fully dominated by sellers at this stage.
- The correlation between fixed income (US 30Y) , equities (SP500) and the pair have reached levels near a ratio of 1:1 as one would expect given the ‘true risk off’ context.
- With the pre-conditions of the fixed income and equities aligning in favor, this is a market with an increasing appeal to short of strength at key decision points.
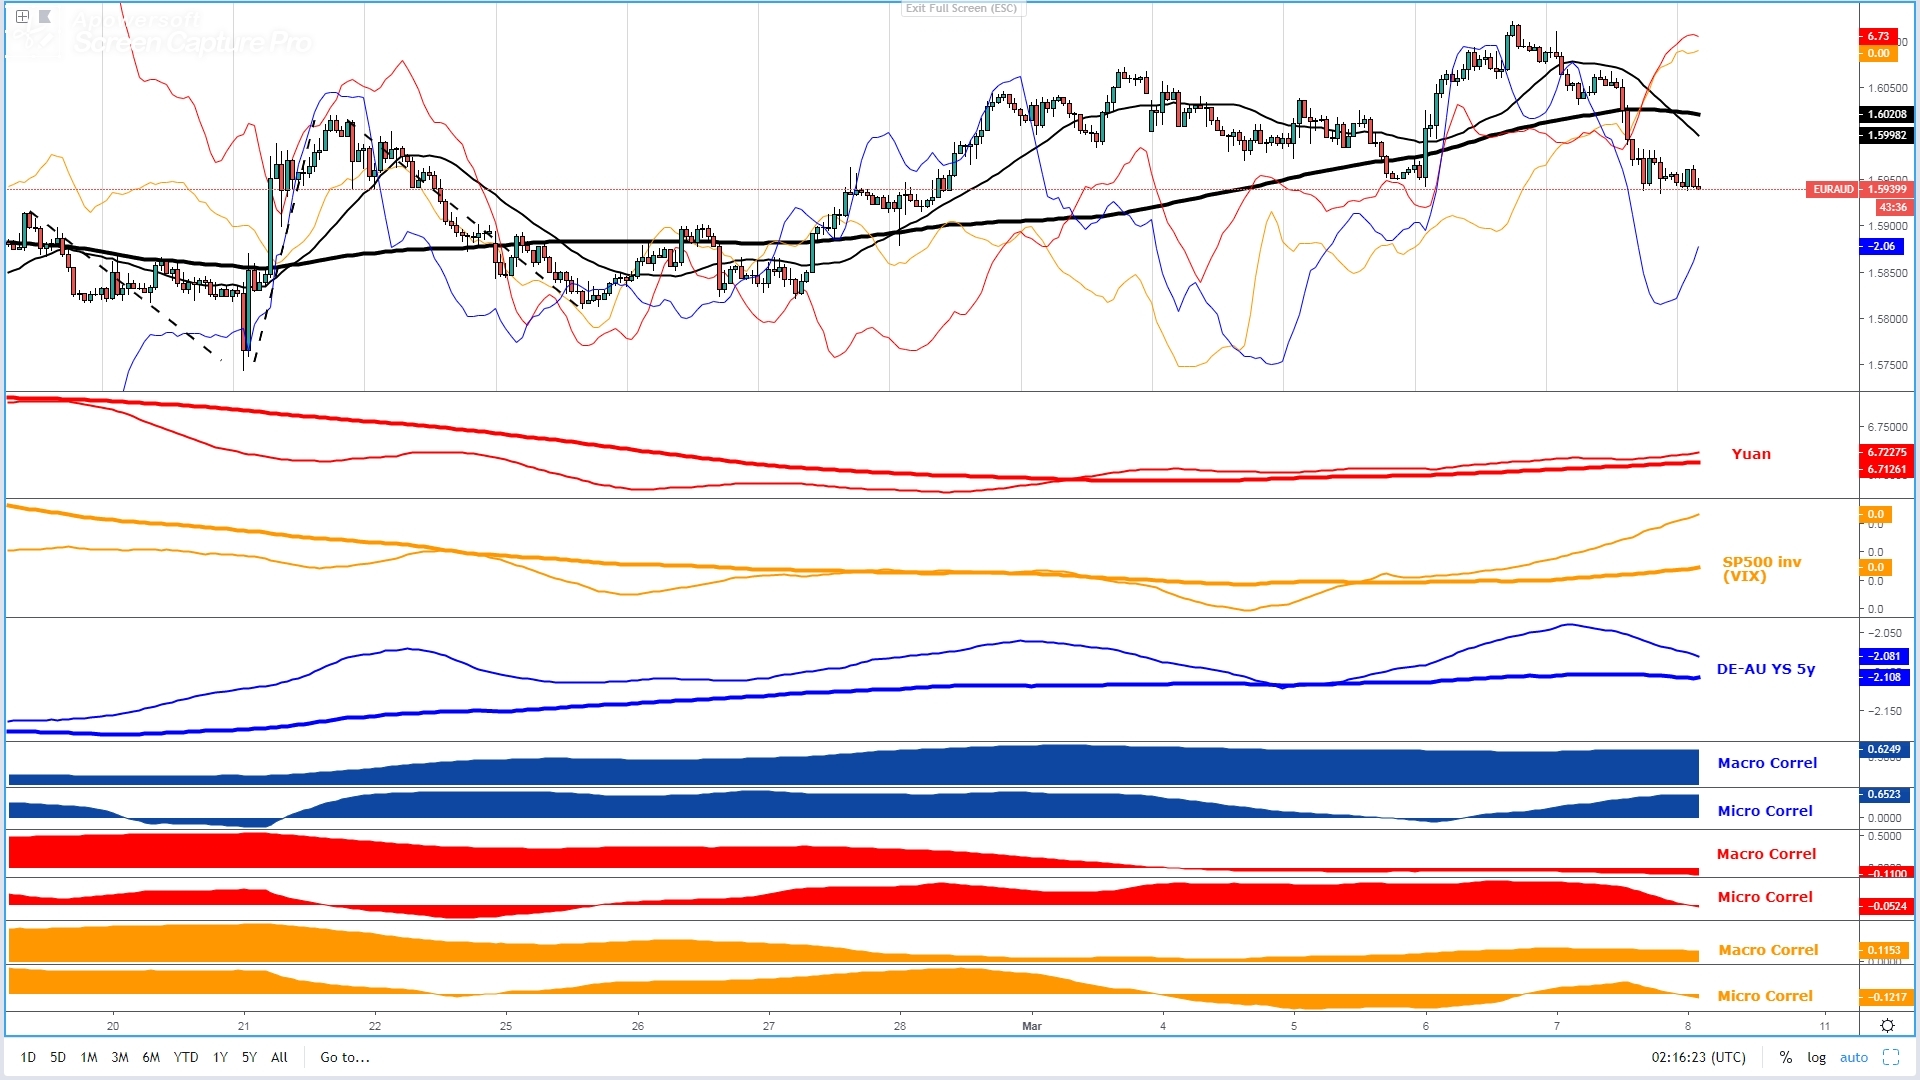
EUR/AUD: Follow The Yield Spread As True Leading Indicator
- The weakness in the Yuan and equities should act as a force to limit the downside scope in the market, even if the bond yield spread remains by far the most accurate indicator of flows.
- The ECB event, by itself, should be enough of a driver to keep the prospects of EUR supply imbalances firmly in place near term, even if AUD not best positioned to exploit EUR weakness.
- As the table above shows, this is a market that still shows fairly rotational credences as both currencies are suffering from deteriorating fundamentals in recent times.
- What this means is that any overextension of a move carries a bigger risk of a reversal as opposed to the same short EUR play against the likes of the USD or JPY.
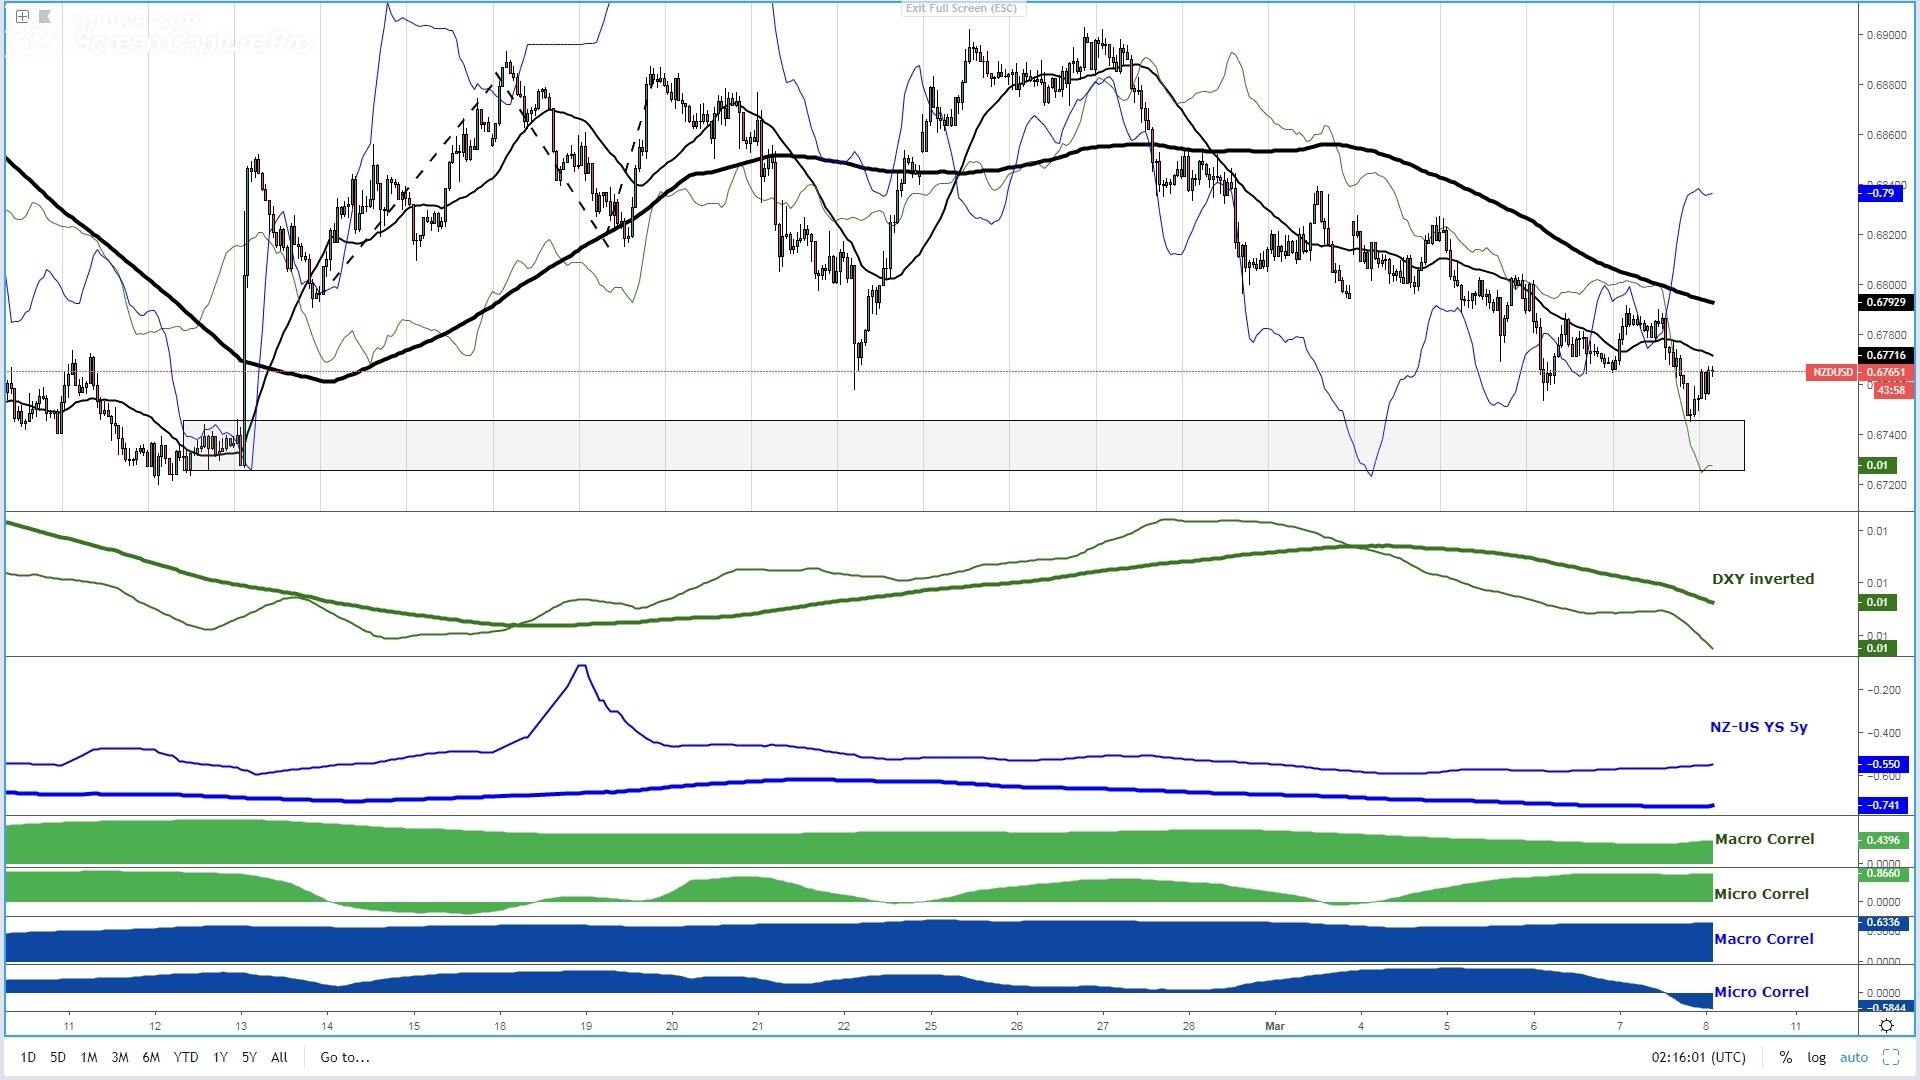
NZD/USD: Risk-Off Dictates Bearish Direction But Value Higher
- If ‘true risk off’ conditions can relax, watch for a potential recovery in the Kiwi as the bond yield spread keeps a bullish structure of higher highs and higher lows (blue line).
- Technicals remain suppressive for the interest of buyers due to the deleveraging of risky bets, of which the Kiwi is clearly part of, resulting in the highlighted divergences in yield spread.
- Be wary of being overly fixated in the yield spread (lower correlation) as long as the ‘true risk off’ nature of this market continues to play out, as that’s a period to stay defensive.
- The Kiwi found a pocket os strong buying interest originating off the spike in demand from the RBNZ-induced outcome from back on Feb 13th, making the area a temp bottom to be found.
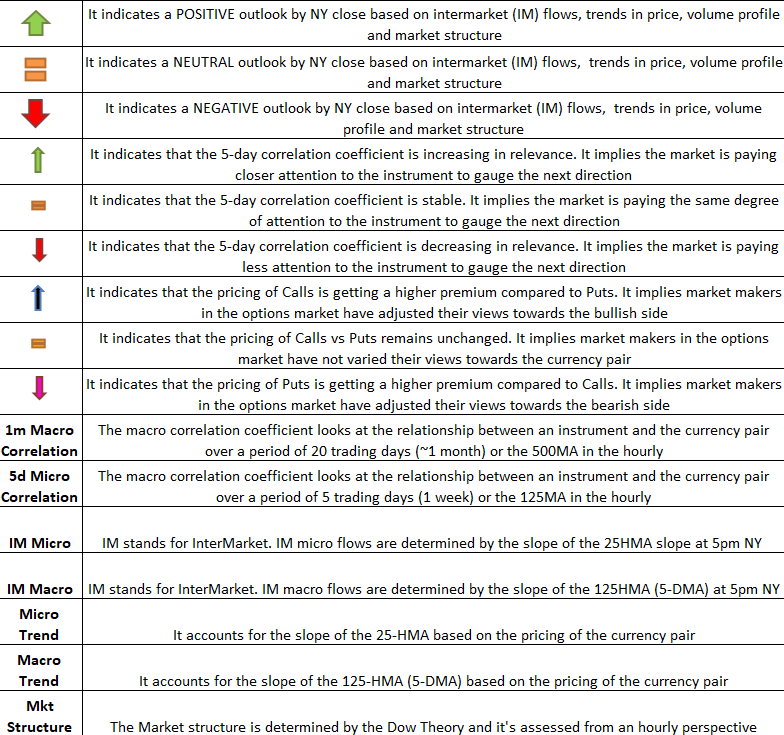
Important Footnotes
- Risk model: The fact that financial markets have become so intertwined and dynamic makes it essential to stay constantly in tune with market conditions and adapt to new environments. This prop model will assist you to gauge the context that you are trading so that you can significantly reduce the downside risks.
- Cycles: Markets evolve in cycles followed by a period of distribution and/or accumulation. The weekly cycles are highlighted in red, blue refers to the daily, while the black lines represent the hourly cycles.
- POC: It refers to the point of control. It represents the areas of most interest by trading volume and should act as walls of bids/offers that may result in price reversals. The volume profile analysis tracks trading activity over a specified time period at specified price levels. The study reveals the constant evolution of the market auction process.
- Tick Volume: Price updates activity provides great insights into the actual buy or sell-side commitment to be engaged into a specific directional movement. Studies validate that price updates (tick volume) are highly correlated to actual traded volume, with the correlation being very high, when looking at hourly data.
- Horizontal Support/Resistance: Unlike levels of dynamic support or resistance or more subjective measurements such as fibonacci retracements, pivot points, trendlines, or other forms of reactive areas, the horizontal lines of support and resistance are universal concepts used by the majority of market participants.
- Trendlines: Besides the horizontal lines, trendlines are helpful as a visual representation of the trend. The trendlines are drawn respecting a series of rules that determine the validation of a new cycle being created. Therefore, these trendline drawn in the chart hinge to a certain interpretation of market structures.
- Correlations: Each forex pair has a series of highly correlated assets to assess valuations. This type of study is called inter-market analysis and it involves scoping out anomalies in the ever-evolving global interconnectivity between equities, bonds, currencies, and commodities.
- Fundamentals: It’s important to highlight that the daily market outlook provided in this report is subject to the impact of the fundamental news. Any unexpected news may cause the price to behave erratically in the short term.
- Projection Targets: The usefulness of the 100% projection resides in the symmetry and harmonic relationships of market cycles. By drawing a 100% projection, you can anticipate the area in the chart where some type of pause and potential reversals in price is likely to occur, due to 1. The side in control of the cycle takes profits 2. Counter-trend positions are added by contrarian players 3.