The U.S. equities indexes future rates could rebound during the Asian session paring some of their scored losses yesterday and helping the Asian equities indexes to recover.
After the trade dispute between U.S. and China could easily take its toll this week over the market sentiment sending UST yields lower driving gold up again.
With lower UST yields, The greenback came under pressure across the broad expect the Japanese yen, which could get benefits from the risk aversion sentiment and put more pressure on Nikkei 225.
As The trade dispute escalating can revive the Fed's worries about the economy and drive it to lose its patience and cut rates as required by Trump's administration.
After FOMC had seen in the beginning of this month improvement and lower downside risks likely to drive the economic expansion down following higher than expected growth in the first quarter of this year, while the current inflation slowdown is likely to be transitory.
Now and after nearly 3 weeks, Most of the market participants realized that the Trade War between the 2 biggest economies can be prolonged for years with no sign of nearby continuation of the talks which are about to be trimmed.
The focus turned on the negative impact of this war which is considered now the biggest threat to the global economy, after President Trump escalated The war by blacklisting Huawei expecting it to be part of the trade pact.
Targeting Huawei several times seemed to be for isolating China and capping it from becoming the world superpower not just for cutting its trade benefits with US.
Previously during the trade talk, Trump decided to raise the levy on Chinese goods worth $200b from 10% to 25% and China retaliate by imposing tariffs from 5% to 25% to a total of $60B worth of US goods studying stop purchasing US agricultural products and reducing Boeing (NYSE:BA) orders.
Meanwhile, the main Chinese weapon in this war is buying time and Trump's administration knows that very well and this is making him nervous, as this dispute can be protracted to a democratic administration to end it with no or minimal benefits.
This Trade War intensifying can effect negative on the potential growth of the 2 biggest economies which can look for side ways to pass their trades and it can also dampen the demand for commodities and Energy and the economies depending on them Such as Canada, Australia which are considered the nearest commodities markets to these 2 big economies.
USD/CAD rose yesterday for 1.35 with WTI slide to $57.34 per barrel, while AUD/USD is trading now just below 0.69 waiting for interest rate cutting, if the labor market in Australia did not improve, as The Governor of the Reserve Bank of Australia Philip Lowe figured out this week.
GBP/USD could rebound this morning for trading near 1.2680, after coming under pressure this week by rumors about Theresa May's resignation as PM leading U.K. Conservative Party.

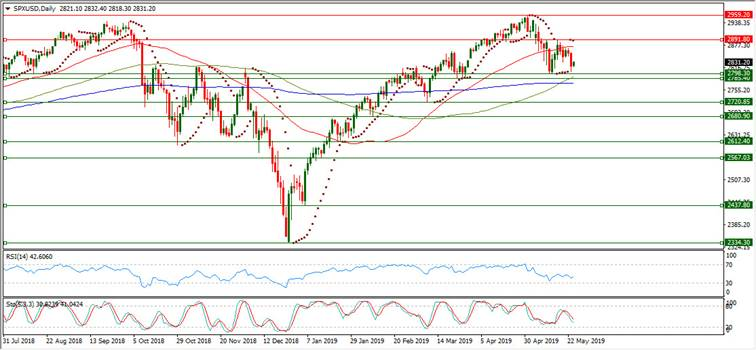
After 2891.80 capped the rebound of S&P 500 future rate from last week bottom 2798.30, the index came under increased downside pressure by forming a lower high below its formed all time high on May. 1 at 2859.20.
S&P500 future rate could rebound today for trading near 2830 after extending its slide from 2891.80 to 2085.10 yesterday
After yesterday slide extension, The index is now well below its daily SMA50 in its second day of being below its daily Parabolic SAR (step 0.02, maximum 0.2) which is reading today 2890.
S&P 500 Future rate is still underpinned over longer range by continued being above its daily SMA100 and above its daily SMA200.
S&P 500 Future daily chart shows that its RSI-14 is now in inside its neutral region at 42.606.
S&P 500 Future daily Stochastic Oscillator (5, 3, 3) which is more sensitive to the volatility is having now its main line inside its neutral area at 30.823 leading to the downside its signal line which is higher in the same area reading 41.042, after negative cross over inside the neutral region.
Important levels: Daily SMA50 @ 2873, Daily SMA100 @ 2790 and Daily SMA200 @ 2773
Experienced S&R:
- S1: 2798.30
- S2: 2785.40
- S3: 2720.85
- R1: 2891.80
- R2: 2959.20
- R3: 3000.00
