Below is an excerpt from our latest monthly review of the short and immediate term prospects for the US economy, published last week.
We think that last year’s US recession ended in June plus/minus one month, making it the shortest recession in US history. The latest data indicate that the recovery is well and truly intact.
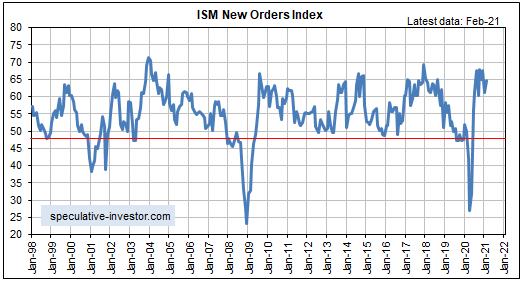
Of particular relevance, the following monthly chart shows that the ISM New Orders Index (NOI), one of our favorite leading economic indicators, remains near the top of its 20-year range following a pullback in January-2021 and a rise in February-2021.

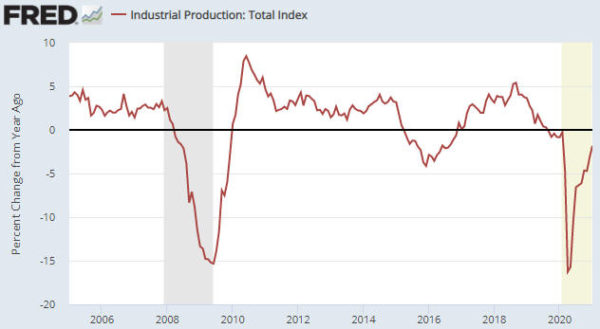
The ISM NOI leads Industrial Production (IP), so it isn’t surprising that the year-over-year percentage change in IP has experienced a rapid rebound from its Q2-2020 trough (refer to the following monthly chart for the details). More importantly, based on the latest NOI number, other leading indicators and the inevitability of additional stimulus from both the Fed and the government, IP’s rebound is set to continue. The IP number for March 2021 will (not might) indicate year-over-year growth.

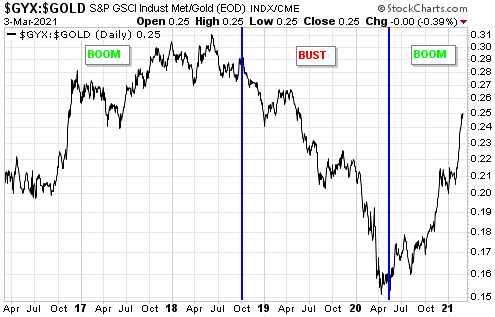
The performances of leading and coincident economic indicators show that we are well into the boom phase of the boom-bust cycle, meaning that the economic landscape remains bullish for industrial commodities and bearish for gold. Therefore, it’s reasonable to expect the continuation of the rising trend in the GYX/gold ratio (industrial metals relative to gold) clearly evident on the following chart. Be aware, though, that on a short-term basis this trend appears to be over-extended.

The economic strength that was predicted eight months ago by leading indicators and is starting to become apparent in coincident indicators is largely artificial. This means that it will evaporate soon after the Fed is forced—by blatant evidence—of an inflation problem to end the monetary stimulus.
Our thinking at this time is that the period of strong economic growth will be followed by a period of what is often called “stagflation”, that is, a period when “inflation” accelerates in parallel with slow or no economic growth. That's because the Fed is not going to stop creating new money at a fast pace and the US government is not going to stop spending at a fast pace anytime soon. If so, then during the post-boom period commodities could continue to do well but gold should outperform almost everything.
However, we’ve learned from bitter experience that during the boom it’s best NOT to look ahead to the inevitable economic denouement. Instead, the focus should be on “making hay while the sun shines.” Near the end of the boom there will be timely warnings in the real-time data, but at the moment such warnings are conspicuous by their absence. This means that the boom should continue for at least another three months and could continue for much longer than that.
