Most people don’t realize it, but there are 500 funds out there paying massive dividends: I’m talking rich 7% payouts on average.
That’s five times more than index funds pay! And many of these 500 criminally overlooked funds clobber their benchmarks, too.
I’m talking about closed-end funds (CEFs), which are run by real human beings, not algorithms. And despite what most advisors will tell you, the stock-pickers running CEFs beat the market on the regular.
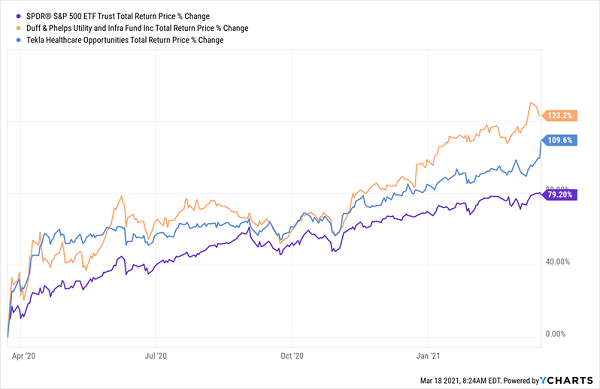
To see what I mean, consider two CEFs: the Duff and Phelps Global Utility Income Closed Fund (NYSE:DPG), which holds utility stocks like NextEra Energy (NYSE:NEE) and Dominion Energy (NYSE:D), and the Tekla Healthcare Opportunities (NYSE:THQ), holder of major drug firms likeJohnson & Johnson (NYSE:JNJ) and Abbott Laboratories (NYSE:ABT).
I mention these two because utilities are known for stability, not beating the market, the pharma sector has trailed the S&P 500 in the last year. But no matter. Both of these CEFs handily beat the S&P 500 in the last 12 months with dividends included.
Human-Run CEFs Beat Back the Machine
CEF Dividends Do More Than Provide Income
These CEFs’ dividends are impressive: THQ boasts a 6.3% payout (and pays dividends monthly), while DPG pays an outsized 10.4%. Payouts that big are vital in a wild market like the one we’ve seen over the last 12 months. THQ holders, for example, got 14% of their return as dividends in the last year; dividends accounted for 25% of DPG investors’ overall profit.
Put another way, these returns were 14% and 25% less volatile than those of the market! Because while most folks were on pins and needles wondering if we were going to get a W-, V-, K- or—my favorite—bathtub-shaped recovery, THQ and DPG owners already had a healthy slice of their profits in the hopper in cash.
CEF Discounts: Our Profit Early Warning Signal
That’s the difference CEFs’ huge dividends can make, and they’re the first reason why these funds should have a place in your portfolio. The other is discounts, and it’s here that CEFs have a not-so-secret way of telling us when they’re about to soar.
That indicator would be a CEF’s discount to NAV, which is the gap between the fund’s share price and the per-share value of its portfolio.
This discount exists because CEFs can’t issue new shares to new investors (except in rare circumstances) after their IPO. As a result, their market prices often trade at different levels, and often lower, than their NAV.
And you can see this indicator on any CEF screener.
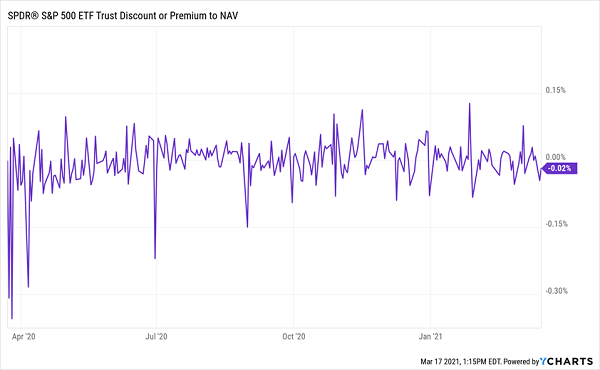
ETFs, on the other hand, never go on sale, as you can see in this chart of the discount to NAV on the popular SPDR® S&P 500 (NYSE:SPY).
Index Funds: Enjoy Your 0.35% Discount
Heck, even at the depths of last year’s selloff, SPY’s discount only dropped to 0.35%!
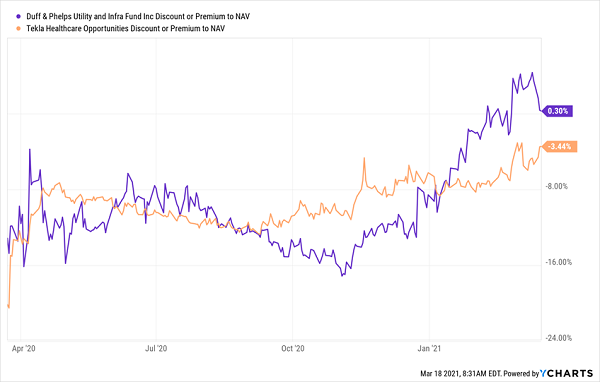
Our CEFs, however, are a different story: a year ago, in the teeth of the selloff, DPG traded at an absurd 13% discount that’s since flipped to a slight premium. THQ, for its part, went from a 20% discount to a 3% discount. These closing discount windows delivered the kick these funds needed to blow past the market:
CEFs Go From Cheap to Pricey—and Their Shares Follow Suit
The upshot with CEFs, then, is twofold. We’re looking for:
- Big dividends with a history of stability, so you get a big slice of your gains in cash, and …
- Unusual discounts you can ride higher, grabbing price upside as you do.
And there’s another way CEFs’ discounts and dividends work in your favor, because a cheap CEF actually has a safer dividend than a more expensive one.
How a CEF’s Discount Makes Its Dividend Safer
This is something investors in regular stocks just don’t get. After all, there’s little connection between valuation measures, like a stock’s P/E ratio, and its ability to pay dividends.
What you’re interested in there is the payout ratio, or the percentage of the last 12 months of earnings (or better yet, free cash flow, a clearer picture of the money a company is generating) the dividend accounts for. For most stocks (outside of real estate investment trusts), I demand a ratio of 50% or less.
Disclosure: Brett Owens and Michael Foster are contrarian income investors who look for undervalued stocks/funds across the U.S. markets. Click here to learn how to profit from their strategies in the latest report, "7 Great Dividend Growth Stocks for a Secure Retirement."
