Get 40% Off
🚨 Volatile Markets? Find Hidden Gems for Serious OutperformanceFind Stocks Now

The Stock Market's Record Run May Only Be Starting

Published 04/26/2019, 04:10 AM
Updated 09/20/2023, 06:34 AM

This post was written exclusively for Investing.com

After the Christmas Eve massacre that sent stocks plummeting, the astonishing recovery that followed has kept investors guessing, as a series of on-again/off-again recession fears and geopolitical wrangles sent yoyo-ing signals to a market that scrabbled to make sense of them. In the meantime, though, the S&P 500 continued its spectacular rally. And guess what? It's not finished climbing.

The S&P 500 set a new closing high on April 23, at 2,933.68. It was nearly four months after the December 24 rout that left the index at 2,351.10. Since then the S&P 500 has risen by over 582 points, or 24%. It's slipped marginally over the past two sessions, closing yesterday at 2,926.17, but the strongest signs are indicating that the ascent will continue.

The landscape for the stock market has improved dramatically over the past four months, with interest rates plunging and a global economy that is performing better than expected. Now, earnings are pouring in and, based on early indications, those earnings are outperforming too, due to sales growth and margin expansion. It is a stew of positive news brewing, which is a recipe for higher stock prices and more record highs.
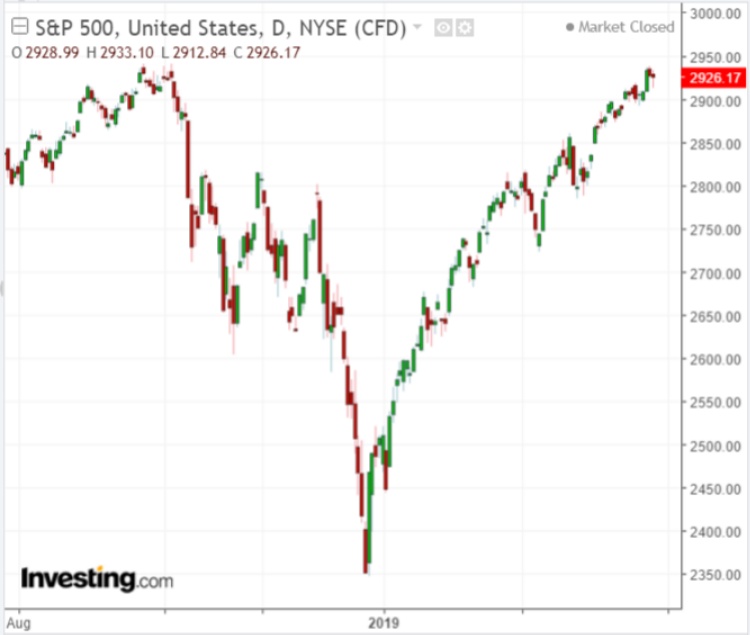
S&P 500

Low Rates May Lead To Multiple Expansion

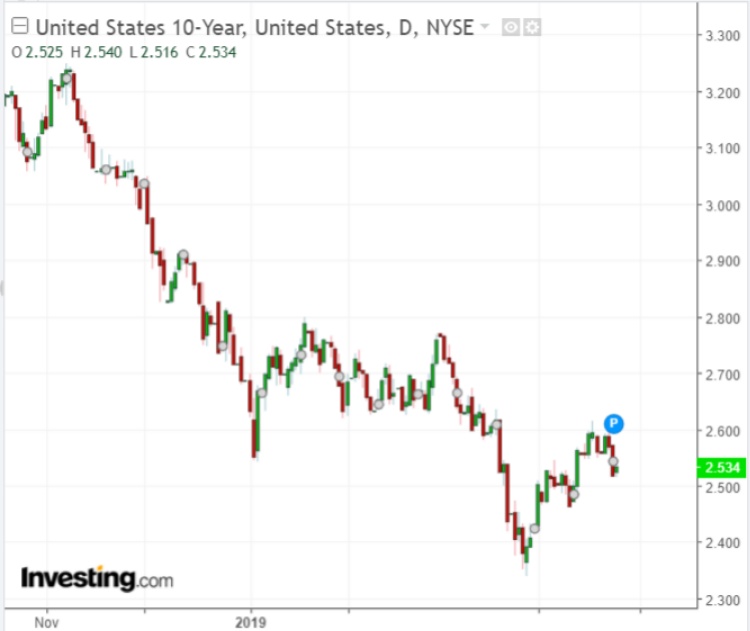
With the backdrop of low interest rates, which may be going even lower, the S&P 500 could continue to see its earnings multiple expand. Since December the U.S. 10-year Treasury yield has fallen by roughly 50 basis points to 2.5%. The lower rates are likely to push investors further out on the risk curve in search of higher returns. It would likely suggest that the S&P 500 can see its PE ratio rise, pushing equity prices higher.
3rd party Ad. Not an offer or recommendation by Investing.com. See disclosure here or remove ads .

U.S. 10-year Treasury yield

Using data from Dow Jones S&P Indices, the average one-year earnings multiple for the S&P 500 comes to roughly 17.5. The current multiple based on 2020 earnings estimates is around 15.7. Even since 2012, the average PE ratio has been around 17, at 16.7. It could all lead to the S&P 500 rising towards 3,200.

Better Earnings

Earnings have been coming in better than expected this quarter. According to Dow Jones S&P, through April 18, 77% of the S&P 500 companies have already reported results, with 75.3% of them beating earnings estimates. Meanwhile, just 16.8% have missed, and about 7.8% have met forecasts. Although it is still early into earnings season, that is better than the average of approximately 70% beating estimates and 21% missing estimates since 2012. If this trend continues throughout the quarter, it would suggest earnings estimates may need to be adjusted higher, further helping to lift equity prices.

It isn't just earnings that are growing: revenues for these companies have risen too. According to the data, revenue for the first quarter is up over 4% versus last year. Meanwhile, margins have improved by 90 basis points sequentially to 11%. The better revenue and higher margins are helping to drive the better than expected earnings season. It would also suggest that companies are increasing prices and passing on rising costs to the consumer, a positive sign for the overall economy.

Better Economic Growth

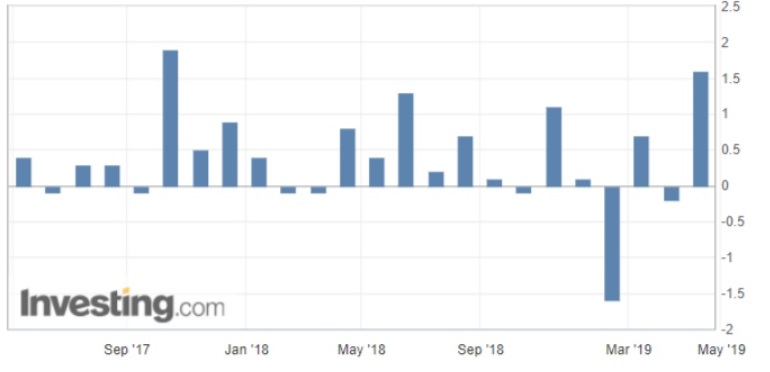
Even economic growth has proven to be better than some have feared. For example, China reported better than expected GDP growth for its first quarter coming in at 6.4% versus estimates for growth of just 6.3%. And the U.S. has shown just how strong its consumer continues to be. Last month retail sales were up 1.6% versus forecasts of 0.9%—their biggest jump in nearly 2-years.
3rd party Ad. Not an offer or recommendation by Investing.com. See disclosure here or remove ads .

U.S. retail sales

Upward Growth Revisions?

If earnings and the global economy continue to grow at a pace faster than previously forecast, it may very well lead to upward growth revisions for the rest of 2019. That would provide a powerful boost for the equity market, helping to push stock prices further into record territory.

And the icing on the cake? Little has been said so far of how easing trade tensions between the U.S. and China could benefit global growth. A trade deal would likely be a big positive for stocks—couple that with all the above, and stocks may soar to levels thought to be nearly impossible just four months ago.

Latest comments

3048 end of the race.Then -38.2% or -50%.
At least 3 questions I have with your analysis: 1. all previous rallies were led by YM and fully supported by RUT; both are laggard this time, esp RUT. Why? 2. There's a marked global slowdown and being accepted by most CBs (ECB, Fed, BoE, BoC, BoJ et al). We all know how reliable Chinese numbers can be (though I agree market aren't concerned with veracity of reports for now). 3. Political and geopolitical risks are still hovering: a. US Elections are about 18 months away b. US vs World trade deals are still hitting snags c. Iran war is a risk [see latest statement of Javad Zariff]; $GC price jump last week also supports this argument d. Brexit and Scotland are still unresolved e. Russia/Ukraine is just heating up.  Factor all of these (which market will soon) and you don't expect another blowout bull run
3048 is the 261.8 Fibonacci.492 stocks on 500 in the S&P are now overbought.A hhuge bubble lihe housing in some countries like US,UK,HK ,Australia,NZ ,CAD and other ones.
Be calm, at.3048 is game over.Just a +3.5 % that will be long to join.This to catch more bulls as possible for the slaughter.
How are all these Zombie debt ridden companies being kept alive, even Drunckenmiller is sick of them!
Living in Asia, I am seeing a pronounced slump in the economy. The upscale restaurants are mostly empty. The real estate sales are plummeting and the name brand stores are cutting back on their inventory. The malls are semi-full but no one is buying unless the discounts are over 50% off. US growth might be good, but forget Asia!
No wonder gold is going up.
That's not a double top on all of the major's is it? Oh hold on, yes it is. Doh!
that's not how it works.
Probably not. Good earnings and great GDP.
the fed raised rates in June of last year maybe they will see that same need again this year
say you're correct, companies are raising prices and passing that inflation on to consumers. That INCREASES the probability of a hike, which undermines your entire argument which is dependent on a low interest debt fueled rally.
Dear Mr. Kramer, there's a 95 percent chance that you are wrong
"Better earnings"? Right, after reductions in estimates of 10-20% since December a slug could surpass consensus numbers. Enough with the puff pieces please.
That's just laughable. How about the crashing PMIs, factory orders, manipulated earnings "expectations", enormous debt levels?
Why should we buy them at record high prices?
How About 3.2% GDP Growth
Inventory buildup, government spending...
Risk Disclosure: Trading in financial instruments and/or cryptocurrencies involves high risks including the risk of losing some, or all, of your investment amount, and may not be suitable for all investors. Prices of cryptocurrencies are extremely volatile and may be affected by external factors such as financial, regulatory or political events. Trading on margin increases the financial risks.
Before deciding to trade in financial instrument or cryptocurrencies you should be fully informed of the risks and costs associated with trading the financial markets, carefully consider your investment objectives, level of experience, and risk appetite, and seek professional advice where needed.
Fusion Media would like to remind you that the data contained in this website is not necessarily real-time nor accurate. The data and prices on the website are not necessarily provided by any market or exchange, but may be provided by market makers, and so prices may not be accurate and may differ from the actual price at any given market, meaning prices are indicative and not appropriate for trading purposes. Fusion Media and any provider of the data contained in this website will not accept liability for any loss or damage as a result of your trading, or your reliance on the information contained within this website.
It is prohibited to use, store, reproduce, display, modify, transmit or distribute the data contained in this website without the explicit prior written permission of Fusion Media and/or the data provider. All intellectual property rights are reserved by the providers and/or the exchange providing the data contained in this website.
Fusion Media may be compensated by the advertisers that appear on the website, based on your interaction with the advertisements or advertisers.
© 2007-2024 - Fusion Media Limited. All Rights Reserved.