Get 40% Off
🚨 Volatile Markets? Find Hidden Gems for Serious OutperformanceFind Stocks Now

The S&P/ASX200 Rebound Could Appeal To Bears; JBH, GXY Update

Published 10/08/2019, 03:47 AM
Updated 12/14/2017, 05:25 AM

The S&P/ASX 200 is on track for its third consecutive bullish session. Yet this may not be enough to keep bears at bay, given the depth of the prior decline.
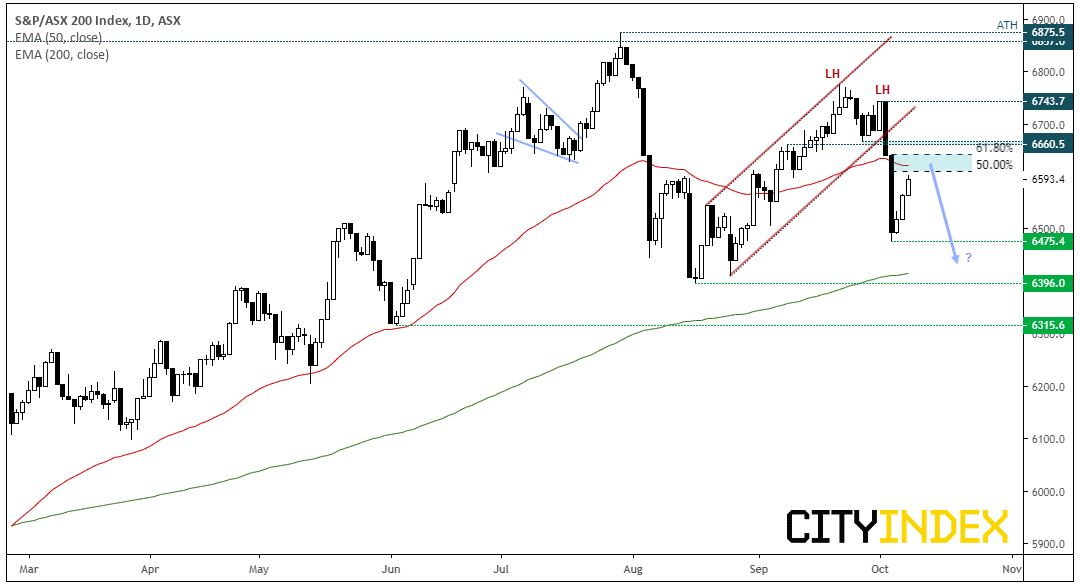
S&P/ASX 200 Index Daily Chart

  • Last week we outlined the potential for ASX200 to mean revert on the weekly charts and Wednesday’s -2.3% decline only reaffirms this view. Now trapped between the 50 and 200-day eMA’s, bears have made a half-hearted attempt to lift the index from its lows – which is something bearish swing traders would be prudent to keep a close eye on.

    We remain bearish below 6,600, the 50-day eMA sits between the 50% and 61.8% retracement levels to provide an additional zone of resistance.
  • From here, we’d like to see a bearish candle such as a hammer or 20bar reversal pattern to suggest the swing high is in.
  • The 6,475.4 low is the initial target ahead of 6,400 where the 200-day eMA and August low reside.
  • A break above 6,600 invalidates the bearish bias.
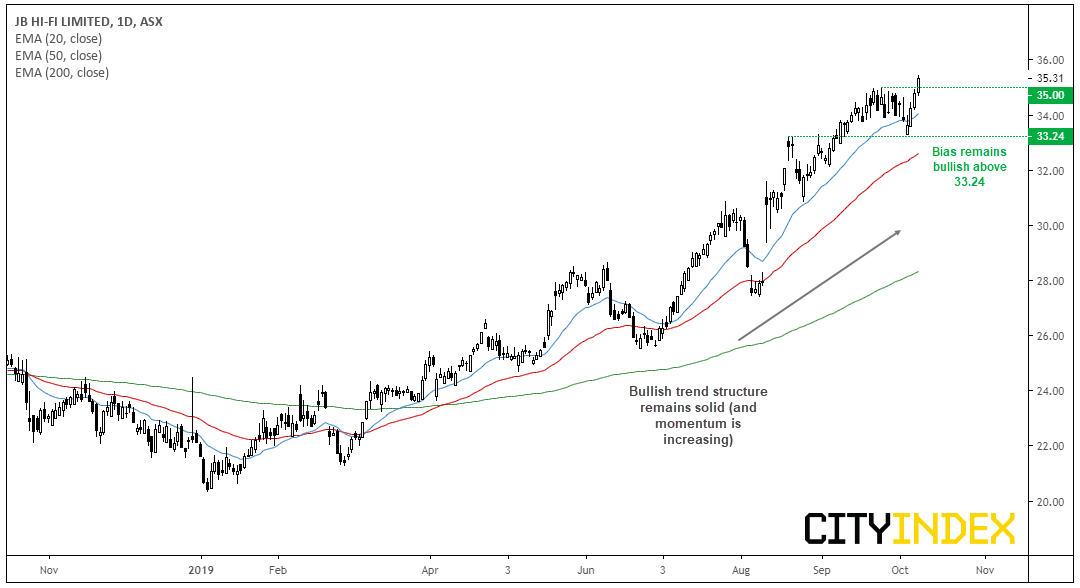
  • JB Hi-Fi Ltd Daily Chart

    JB Hi-Fi (ASX:JBH) has been a strong performer this year, rallying nearly 75% since January’s low. Prior resistance around 33024 has been confirmed as support and acted as a springboard ahead of its breakout from a bull flag. It closed to record highs so there is potential for over-extension over the near-term, but it is difficult to argue with the bullish trend.
  • The trend remains bullish above 33.24, so traders who prefer to buy the dip could seek bullish setups above this key level
  • 3rd party Ad. Not an offer or recommendation by Investing.com. See disclosure here or remove ads .

  • Intraday bulls could wait to see if 35 (prior resistance) holds as support
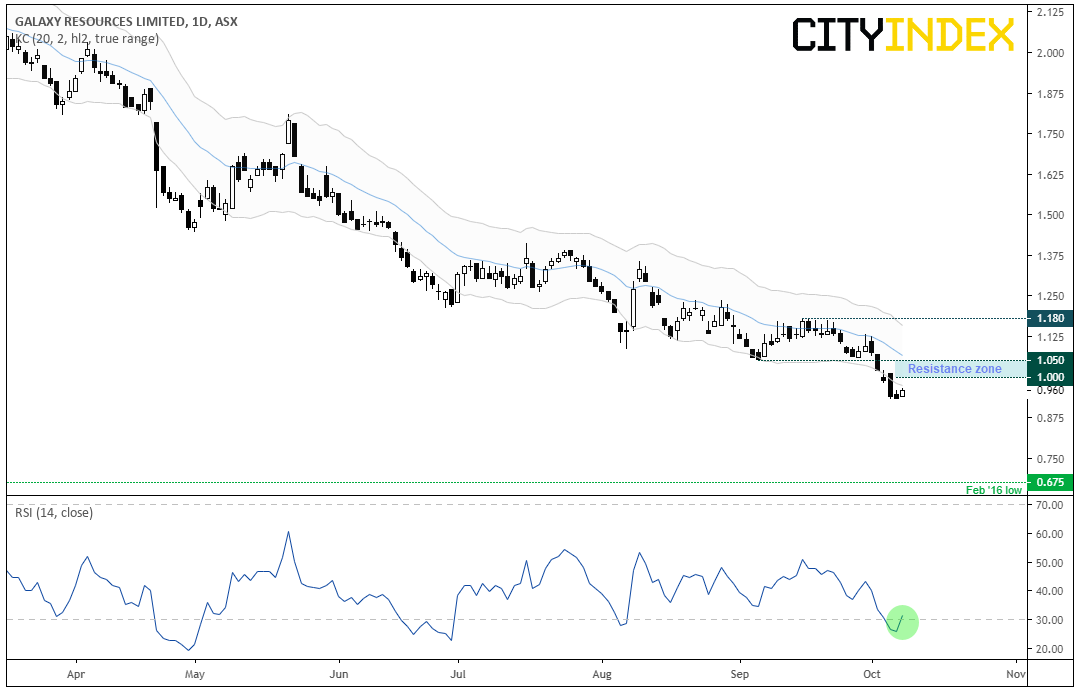
  • Galaxy Resources Ltd Daily Chart

    Galaxy Resources (ASX:GXY) has been the bearish trend that has kept on giving. The market topped in January 2018 and has been in a steep decline ever since. Now trading at its lowest level since March 2016, we’re seeing the potential for a short and for it to head towards the Feb 2016 low.

  • The daily trend remains bearish below 1.18, although there’s the potential for mean reversion given RSI dipped into oversold yesterday and prices closed beneath their lower Keltner band for a third consecutive session.
  • Bears could consider fading into minor rallies below the 1.00 – 1.05 area, or wait for bearish reversal candles (such a hammers, pinbars or 2-bar reversals etc) to form below 1.05, before assuming a swing high in in place.
  • Original Post

    Latest comments

    Risk Disclosure: Trading in financial instruments and/or cryptocurrencies involves high risks including the risk of losing some, or all, of your investment amount, and may not be suitable for all investors. Prices of cryptocurrencies are extremely volatile and may be affected by external factors such as financial, regulatory or political events. Trading on margin increases the financial risks.
    Before deciding to trade in financial instrument or cryptocurrencies you should be fully informed of the risks and costs associated with trading the financial markets, carefully consider your investment objectives, level of experience, and risk appetite, and seek professional advice where needed.
    Fusion Media would like to remind you that the data contained in this website is not necessarily real-time nor accurate. The data and prices on the website are not necessarily provided by any market or exchange, but may be provided by market makers, and so prices may not be accurate and may differ from the actual price at any given market, meaning prices are indicative and not appropriate for trading purposes. Fusion Media and any provider of the data contained in this website will not accept liability for any loss or damage as a result of your trading, or your reliance on the information contained within this website.
    It is prohibited to use, store, reproduce, display, modify, transmit or distribute the data contained in this website without the explicit prior written permission of Fusion Media and/or the data provider. All intellectual property rights are reserved by the providers and/or the exchange providing the data contained in this website.
    Fusion Media may be compensated by the advertisers that appear on the website, based on your interaction with the advertisements or advertisers.
    © 2007-2024 - Fusion Media Limited. All Rights Reserved.