Breaking News
Investing Pro 0
Cyber Monday Deal: Up to 55% off CLAIM SALE

The S&P 500 Gets Closer To Reaching 3030, Potentially As Soon As May 15

By Michael KramerStock MarketsMay 03, 2019 02:35AM ET
www.investing.com/analysis/the-sp-500-may-hit-3030-over-the-next-two-weeks-200416347
The S&P 500 Gets Closer To Reaching 3030, Potentially As Soon As May 15
By Michael Kramer   |  May 03, 2019 02:35AM ET
Saved. See Saved Items.
This article has already been saved in your Saved Items
 
 
US500
+0.10%
Add to/Remove from Watchlist
Add to Watchlist
Add Position

Position added successfully to:

Please name your holdings portfolio
 

This post was written exclusively for Investing.com

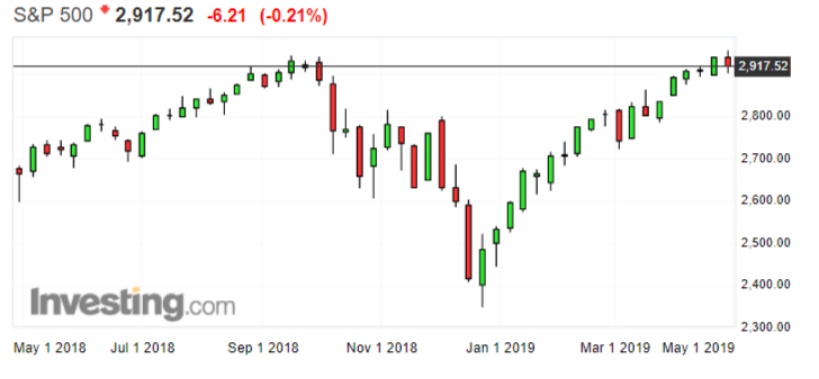
The stock market has been on a resilient rise since the December lows, with the S&P 500 mechanically marching higher, to the tune of almost 25%. It has been perfect, almost too perfect, practically robotic. When digging deeper into the technical charts, some patterns emerge, suggesting the recent rise isn’t over. Those patterns would indicate that the S&P 500 may be on a pace to increase to around 3,030 over the next couple of weeks.

Economic data continues to support the recent rise in the stock market. Couple that with earnings that have been coming in better than expected, along with strong revenue growth, and it's no wonder there's been a continual bid to the market. Thus far, every pullback in the market appears as if it's being used by investors as a buying opportunity.

Even the latest Fed meeting revealed the FOMC is in no rush to cut interest rates despite the fact that low inflation couldn’t derail the rally. The market fell briefly following the announcement but managed to hold technical support around 2,900 on Thursday, May 2.
S&P 500
S&P 500

Chart powered by TradingView

Higher-Highs

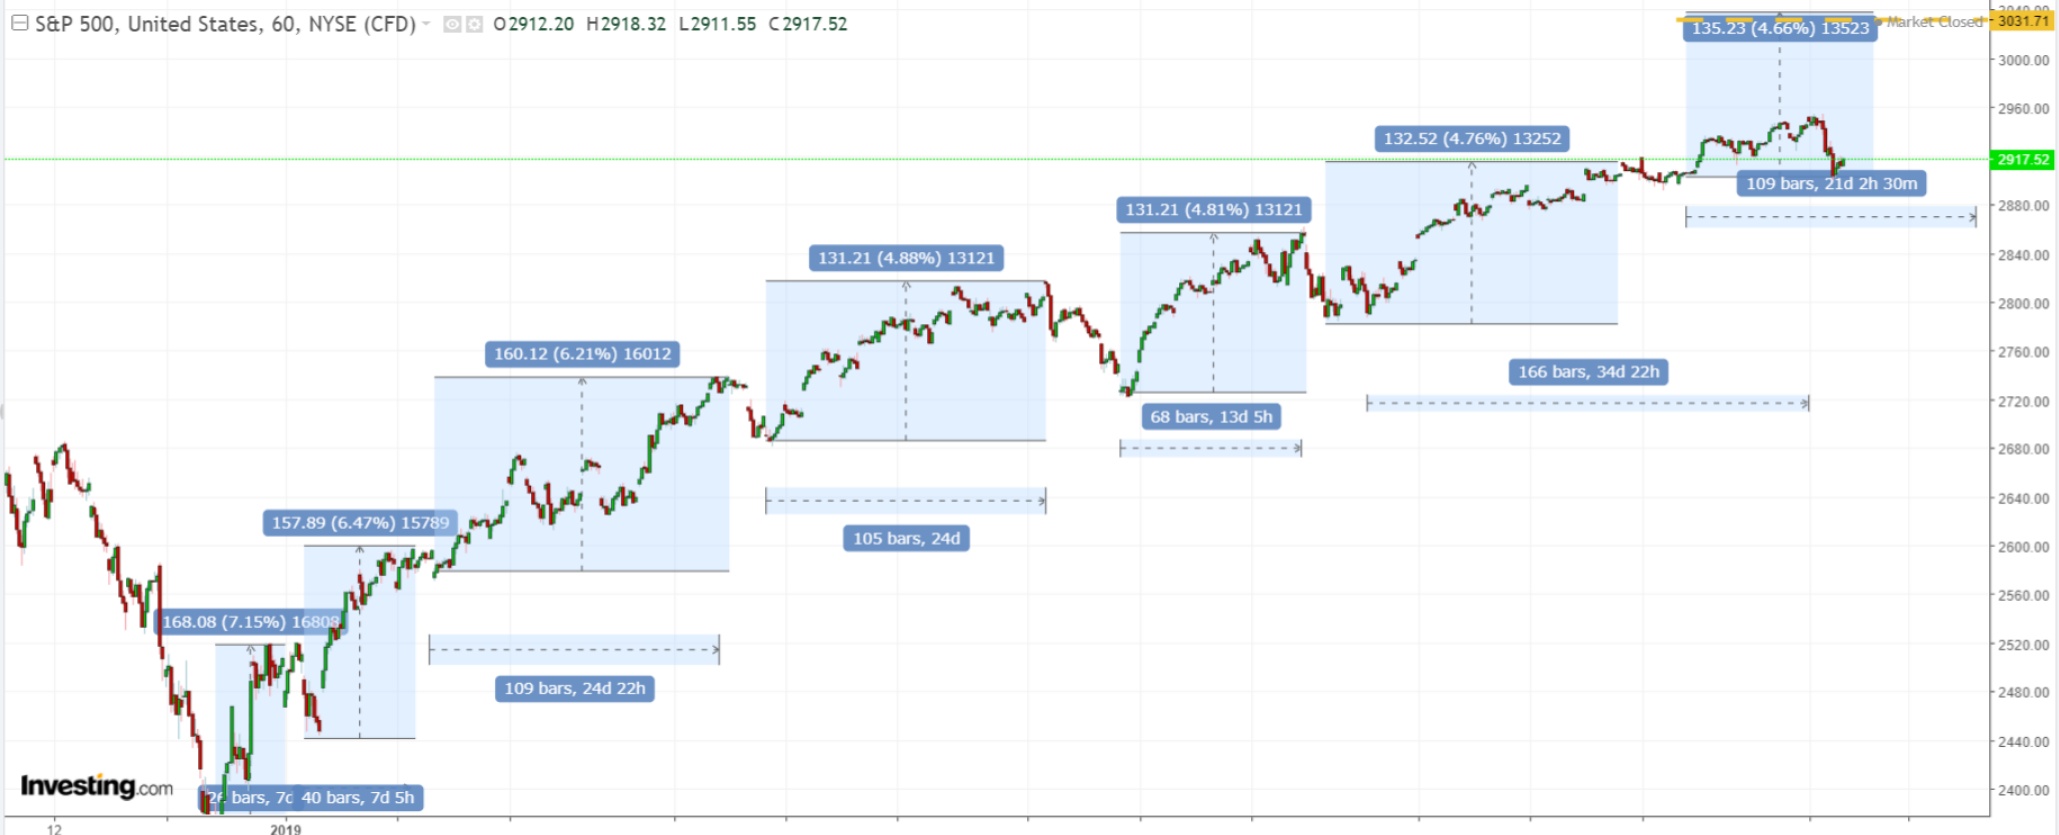
The S&P 500 has been making a series of higher highs, and higher lows. Why is this interesting? Because the S&P 500 rose in three increments of about 160 points from Dec. 26 through Feb. 5. That pace slowed somewhat, rising in three increments of nearly 130 points from Feb. 8 through April 17. The chart below shows how mechanical the rise has been, and is what one would consider algorithmically driven.

2 to 3 Week Increments

Even more impressive is that, each time the index has rallied, paused, and resumed, the move higher has lasted for a period of 2 to 3 weeks. Currently, the S&P 500 appears to be in the middle of its next advance. This puts the index on a pace to reach 3,030 by roughly May 15, should the advance last 2 to 3 weeks along with an increase of around 130 points, like the previous 3 moves higher.
S&P 500
S&P 500

Chart powered by TradingView

Fundamental Underpinnings

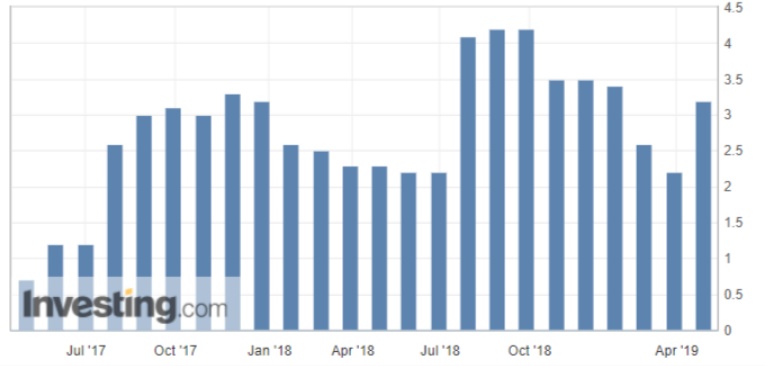
However, there is no doubt that the recent rise to the market is due to improving fundamentals. The views of an economic slowdown that swirled during the stock market meltdown of the fourth quarter have eased. That is because the global economy may never have been as dire as some feared. For example, last week it was revealed that first quarter GDP grew in the U.S. at an annualized pace of 3.2%. Meanwhile, the most recent U.S. manufacturing PMI survey suggests the manufacturing sector is still in expansion.
U.S. GDP
U.S. GDP

Chart powered by TradingView

Earnings data continues to come in better than feared as well. Through April 30, the latest data from S&P Dow Jones shows 211, or 73%, of the S&P 500 companies have beaten analysts’ estimates. Additionally, only 53, or 18% have missed; while 25, or 9% have met. That is much better than the 68% of companies that beat in the fourth quarter. Additionally, revenue has increased by 5%, on par with the fourth quarter. Meanwhile, operating margins have expanded to over 11% in the first quarter from 10.1% in the fourth quarter.

If it feels like there has been an underlying bid to the market. The charts can confirm it. Even more impressive is how orderly and evenly the stock market has increased. If this current pace continues, then it seems likely that the S&P 500 is on a course to reach 3,000 and beyond very soon.

The S&P 500 Gets Closer To Reaching 3030, Potentially As Soon As May 15
 

Related Articles

The S&P 500 Gets Closer To Reaching 3030, Potentially As Soon As May 15

Add a Comment

Comment Guidelines

We encourage you to use comments to engage with other users, share your perspective and ask questions of authors and each other. However, in order to maintain the high level of discourse we’ve all come to value and expect, please keep the following criteria in mind:  

  •            Enrich the conversation, don’t trash it.

  •           Stay focused and on track. Only post material that’s relevant to the topic being discussed. 

  •           Be respectful. Even negative opinions can be framed positively and diplomatically. Avoid profanity, slander or personal attacks directed at an author or another user. Racism, sexism and other forms of discrimination will not be tolerated.

  • Use standard writing style. Include punctuation and upper and lower cases. Comments that are written in all caps and contain excessive use of symbols will be removed.
  • NOTE: Spam and/or promotional messages and comments containing links will be removed. Phone numbers, email addresses, links to personal or business websites, Skype/Telegram/WhatsApp etc. addresses (including links to groups) will also be removed; self-promotional material or business-related solicitations or PR (ie, contact me for signals/advice etc.), and/or any other comment that contains personal contact specifcs or advertising will be removed as well. In addition, any of the above-mentioned violations may result in suspension of your account.
  • Doxxing. We do not allow any sharing of private or personal contact or other information about any individual or organization. This will result in immediate suspension of the commentor and his or her account.
  • Don’t monopolize the conversation. We appreciate passion and conviction, but we also strongly believe in giving everyone a chance to air their point of view. Therefore, in addition to civil interaction, we expect commenters to offer their opinions succinctly and thoughtfully, but not so repeatedly that others are annoyed or offended. If we receive complaints about individuals who take over a thread or forum, we reserve the right to ban them from the site, without recourse.
  • Only English comments will be allowed.
  • Any comment you publish, together with your investing.com profile, will be public on investing.com and may be indexed and available through third party search engines, such as Google.

Perpetrators of spam or abuse will be deleted from the site and prohibited from future registration at Investing.com’s discretion.

Write your thoughts here
 
Are you sure you want to delete this chart?
 
Post
Post also to:
 
Replace the attached chart with a new chart ?
1000
Your ability to comment is currently suspended due to negative user reports. Your status will be reviewed by our moderators.
Please wait a minute before you try to comment again.
Thanks for your comment. Please note that all comments are pending until approved by our moderators. It may therefore take some time before it appears on our website.
Comments (8)
Lam gol
Lam gol May 03, 2019 4:15PM ET
Saved. See Saved Items.
This comment has already been saved in your Saved Items
LOL, 75% of released earnings so far clearly point  to  3 quarters of negative profits compared to last year(i.e. profits recession ), but  yeah, fundamentals are strong....
Francis Drake
Francis Drake May 03, 2019 11:08AM ET
Saved. See Saved Items.
This comment has already been saved in your Saved Items
The area from 3048 to 3124 is full of Fibonacci .It's like with a simple gun facing a tank.
Francis Drake
Francis Drake May 03, 2019 11:07AM ET
Saved. See Saved Items.
This comment has already been saved in your Saved Items
If true on 15/5 we'll se the absolute high in area 3030 ( i think 3048) or 1 month late in the area 3048-3124.Then the crash to 1883-1931.
Francis Drake
Francis Drake May 03, 2019 11:04AM ET
Saved. See Saved Items.
This comment has already been saved in your Saved Items
4.618x666(absolute low in 2009 on S&P500) =3076  Fibonacci 2x1552(absolute high 2008)=3124. (3124+3076)/2=3100. . Selle before area 3048-3124.Market wil crash to 1883-1931.
Tim Boyd
Tim Boyd May 03, 2019 10:32AM ET
Saved. See Saved Items.
This comment has already been saved in your Saved Items
Thank you for the puff piece.
Da Plumber
Da Plumber May 03, 2019 7:46AM ET
Saved. See Saved Items.
This comment has already been saved in your Saved Items
I stopped reading at: Couple that with earnings that have been coming in better than expected
Da Plumber
Da Plumber May 03, 2019 7:46AM ET
Saved. See Saved Items.
This comment has already been saved in your Saved Items
Take a look at the number of revisions made to earnings estimates prior to the releases. The earnings were gamed like they always have been. Of course mist companies will beat.
jim boblooch
jim boblooch May 03, 2019 7:41AM ET
Saved. See Saved Items.
This comment has already been saved in your Saved Items
Fantastic! thanks.
Mike Mike
Mike Mike May 03, 2019 7:06AM ET
Saved. See Saved Items.
This comment has already been saved in your Saved Items
Outstanding DD
 
Are you sure you want to delete this chart?
 
Post
 
Replace the attached chart with a new chart ?
1000
Your ability to comment is currently suspended due to negative user reports. Your status will be reviewed by our moderators.
Please wait a minute before you try to comment again.
Add Chart to Comment
Confirm Block

Are you sure you want to block %USER_NAME%?

By doing so, you and %USER_NAME% will not be able to see any of each other's Investing.com's posts.

%USER_NAME% was successfully added to your Block List

Since you’ve just unblocked this person, you must wait 48 hours before renewing the block.

Report this comment

I feel that this comment is:

Comment flagged

Thank You!

Your report has been sent to our moderators for review
Continue with Google
or
Sign up with Email