Get 40% Off
🚨 Volatile Markets? Find Hidden Gems for Serious OutperformanceFind Stocks Now

The S&P 500 Can Climb Higher, Potentially Reaching 3,540 In 2020

Published 01/19/2020, 03:49 AM
Updated 09/20/2023, 06:34 AM

With earnings season quickly approaching, it is perhaps a good time to look at the S&P 500 from a valuation perspective over the longer-term. Recently we have been focusing on the market’s steady advance and ever-mounting sign that the market is getting a bit overheated at current levels. However, over the longer-term, the outlook continues to suggest that the market can rise to even higher levels.

First off earnings growth is expected to see a significant bump in 2020, rising by around 11% to about to $175.30 per share based on estimates from S&P Dow Jones. Then in 2021, it is forecast to grow by roughly 9% more to $191.22 per share.
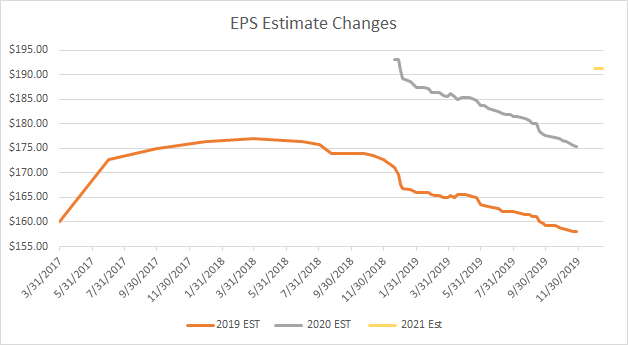
EPS Estimate Change

Present Values

It leaves the index trading at roughly 19 times 2020 earnings and around 17.5 times 2021 earnings estimates. Which mostly leaves the index trading at fairly valued levels based on the historical average.(S&P Dow Jones)
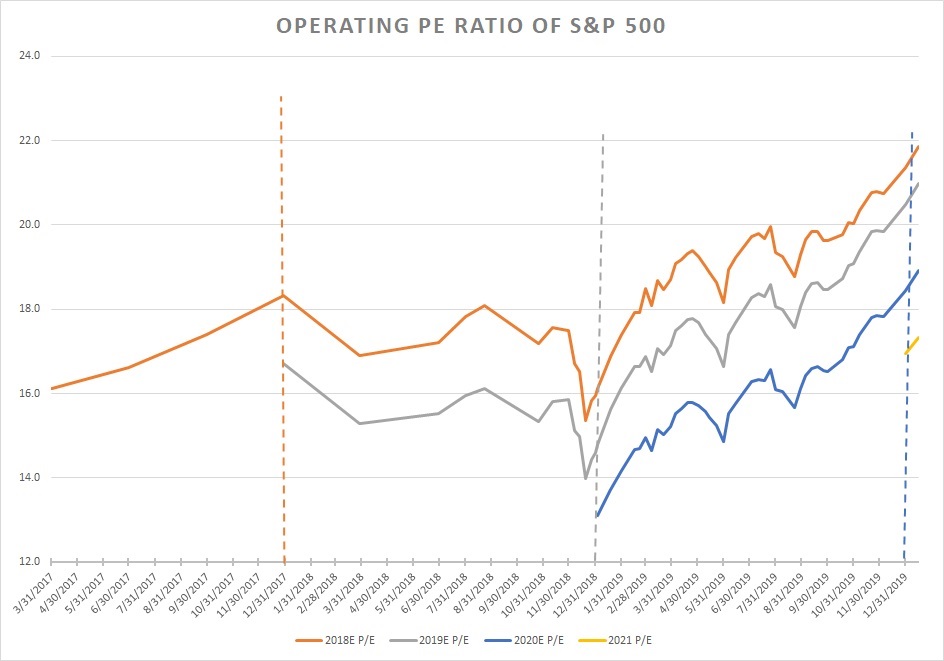
Operating PE Ratio Of S&P 500

Low Rates

But again, one could easily argue that in a world where the dividend yield of the S&P 500 is basically on par with that of the 10-year Treasury, investors would likely be in a mood to take on some additional risk to generate higher returns.
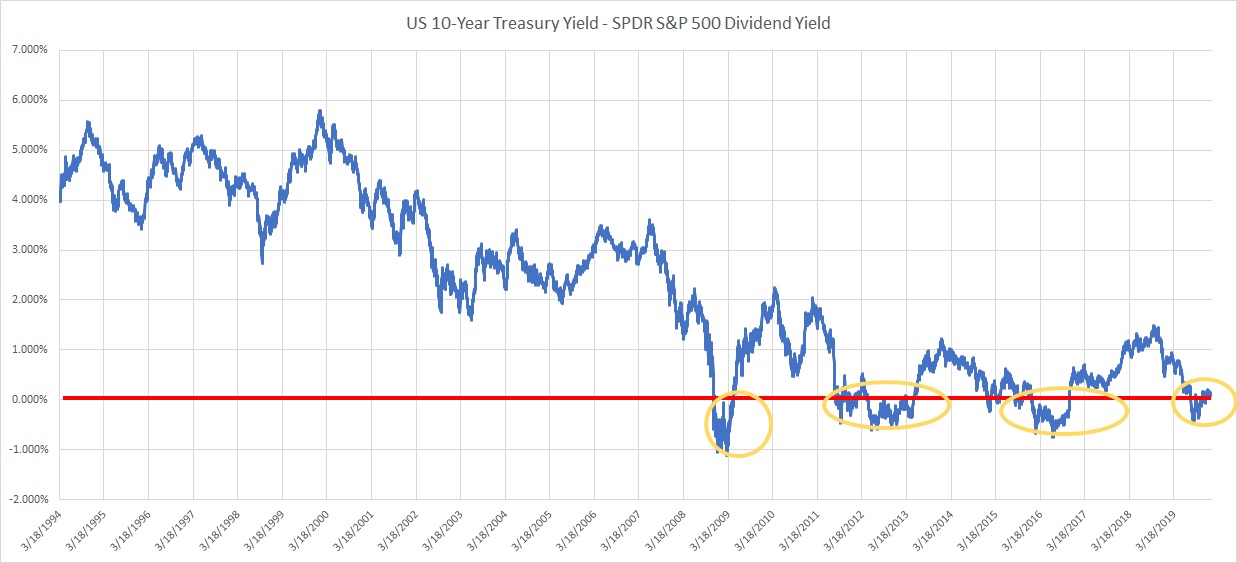
US 10 Yr Treasury Yield - SPDR SP 500 Dividend Yield

The Range

I think it is fair to say in this low-interest-rate environment; the S&P 500 could see its earnings multiple move up to something closer to that of 18 or even 18.5 times one-year forward earnings. At 18 times 2021 earnings estimates, one could get a valuation of 3,441, and at 18.5, it comes to roughly 3,537. It could amount to a gain of as much as 6% from its current levels of 3,329.

3rd party Ad. Not an offer or recommendation by Investing.com. See disclosure here or remove ads .

Reasonable? Sure. Over the last 20 quarters, the average P/E ratio has been 17.4, with a standard deviation of 1.11, meaning that the S&P 500 could trade with a PE ratio in a range of 16.28 to 18.51, a trading range of 3,112 to 3,539.

Of course, we know that overtime earnings estimates have a tendency to decline, and should we shave 5% off current the forecast of $191.22, we could have earnings of $181.66, reducing the range to 2,956 to 3,362.

So, in this interest rate environment, the Fed on the sideline, and the potential for an improving economy, I’d be willing to bet the upside risk in the stock market, is greater than the downside risk. But of course, pullbacks will occur and will likely happen often during the march higher.

Original Post

Latest comments

thanks to the other Cramer With a K.
Risk Disclosure: Trading in financial instruments and/or cryptocurrencies involves high risks including the risk of losing some, or all, of your investment amount, and may not be suitable for all investors. Prices of cryptocurrencies are extremely volatile and may be affected by external factors such as financial, regulatory or political events. Trading on margin increases the financial risks.
Before deciding to trade in financial instrument or cryptocurrencies you should be fully informed of the risks and costs associated with trading the financial markets, carefully consider your investment objectives, level of experience, and risk appetite, and seek professional advice where needed.
Fusion Media would like to remind you that the data contained in this website is not necessarily real-time nor accurate. The data and prices on the website are not necessarily provided by any market or exchange, but may be provided by market makers, and so prices may not be accurate and may differ from the actual price at any given market, meaning prices are indicative and not appropriate for trading purposes. Fusion Media and any provider of the data contained in this website will not accept liability for any loss or damage as a result of your trading, or your reliance on the information contained within this website.
It is prohibited to use, store, reproduce, display, modify, transmit or distribute the data contained in this website without the explicit prior written permission of Fusion Media and/or the data provider. All intellectual property rights are reserved by the providers and/or the exchange providing the data contained in this website.
Fusion Media may be compensated by the advertisers that appear on the website, based on your interaction with the advertisements or advertisers.
© 2007-2024 - Fusion Media Limited. All Rights Reserved.