Few securities hold the mystical lure that gold stocks seem to possess. The seeming never ending allure of gold as the ultimate “store of value” (whatever that means) and the volatile nature of gold stocks themselves create a combination that draws in traders and speculators – often not unlike a moth to the flame.
The History
Figure 1 displays a 5-stock index that I created as a proxy to track the gold stock sector. Whether this is the “definitive” gold stock index or not (it’s not) is not the point. The point is that, clearly, if you get on the right side of a big move there is money to be made.
Figure 1 – Gold stocks have a history of making big moves; currently coiling in a relatively tight range (Courtesy AIQ TradingExpert)
The Here And Now
As you can also see in Figure 1 at the far right is the fact that gold stocks are mired in an exceptionally tight range. The obvious question is, “will the breakout be to the upside or the downside?” I don’t claim to know, but based on what I wrote about here my expectations for commodity prices in the next several years, I might be willing to bet that the breakout will ultimately be to the upside.
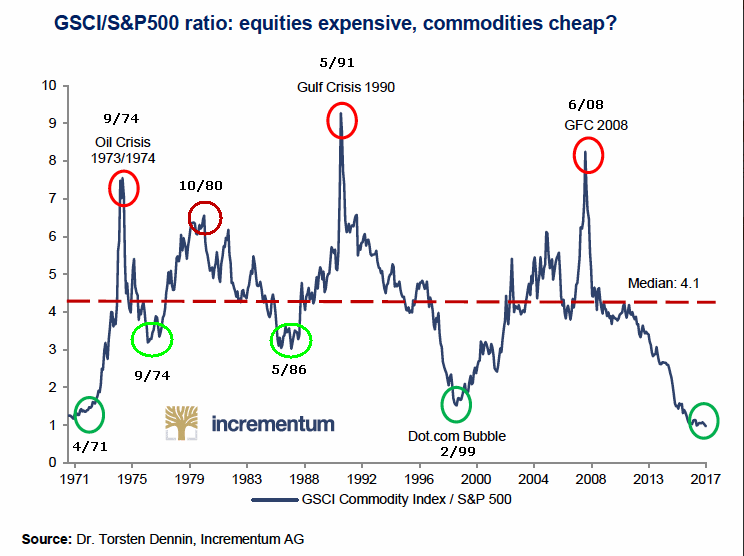
The key item in the linked article is the chart in Figure 2 below that shows the ratio between the Goldman Sachs (NYSE:GS) Commodity Index (GSCI) and the S&P 500 (SPX). Commodity prices were recently about as low as they have ever been in relation to stock prices. This type of extreme is typically followed by a major advance in commodity prices.
Figure 2 – GSCI/SPX Ratio (Source: Dr. Torsten Dennin, Incrementum AG
One Way To Play
So let’s assume someone wants to play the bullish side in the months ahead. The most straightforward approach would be to buy 100 shares of ticker GDX (a gold stock ETF). As I write 100 shares of GDX would cost $2,197. Let’s consider a less costly alternative. For the record – and as always – the position highlighted below is not a “recommendation” only an “example” for educational purposes. This example trade involves:
*Buying 2 Jun2018 22 calls @ 1.61
*Selling 3 Jun2018 25 calls @ 0.62
*Buying 2 Jun2018 28 calls @ 0.26
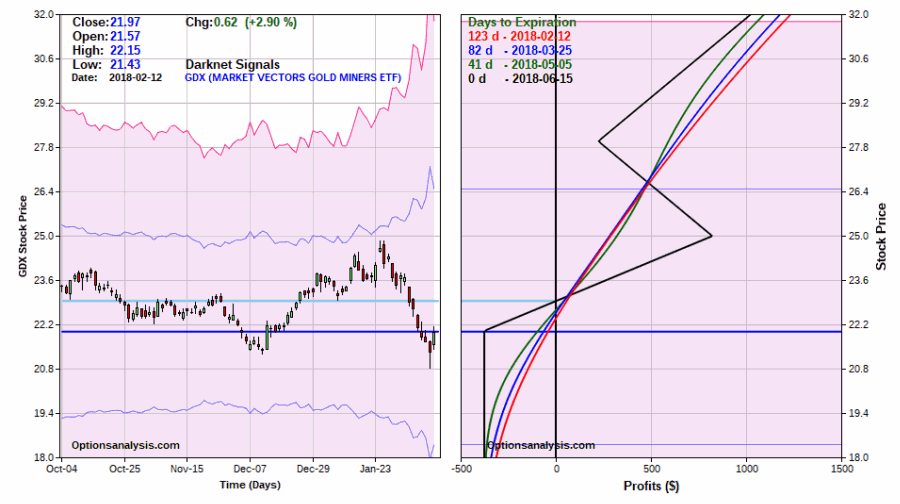
The particulars appear in Figure 3 and the risk curves in Figure 4.
Figure 3 – GDX Directional Butterfly Spread (Courtesy www.OptionsAnalysis.com)
Figure 4 – GDX Directional Butterfly Spread Risk Curves (Courtesy www.OptionsAnalysis.com)
As you can see this trade has:
*123 day left until expiration
*Unlimited profit potential
*Maximum risk of -$388. A trader could choose to cut his or her loss if support is taken out near $20.20 a share.
*A “delta” of 96 – which means that the trade will behave roughly like a position that involves holding 96 shares of GDX.
Summary
Once again I must reiterate that this trade is not a recommendation. It is intended solely as an example of one way to:
*Play a bullish outlook (assuming you have one) for gold stocks over the next four months (so note that if no up move unfolds in the next four months this trade could lose 100%).
*While investing and risking less than it would cost to buy 100 ETF shares.
Addendum
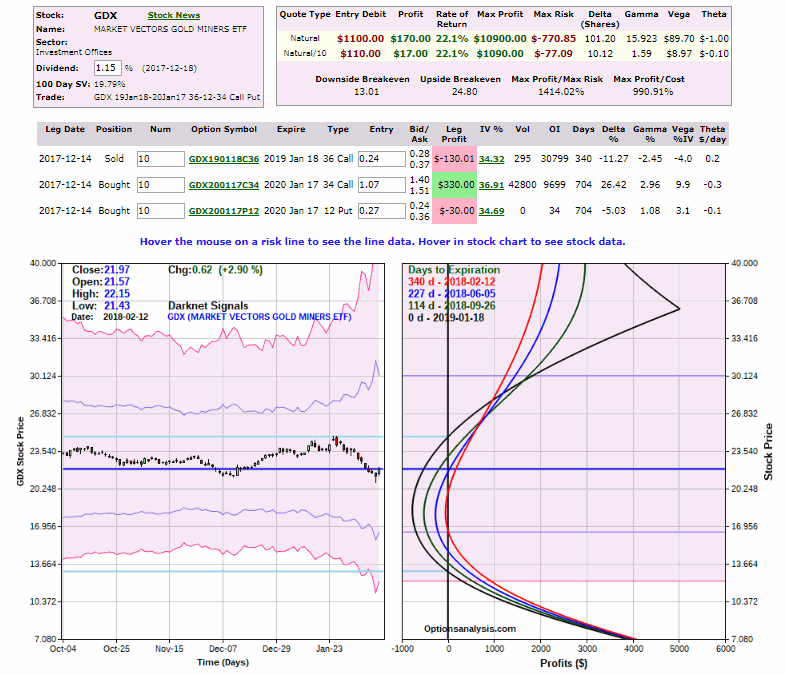
The latest risk curve for the example trade I wrote about here appears below. This trade can benefit from either a big price move up, a big price move down and/or an increase in volatility.
Figure 5 – GDX “Volatility Bomb” example trade
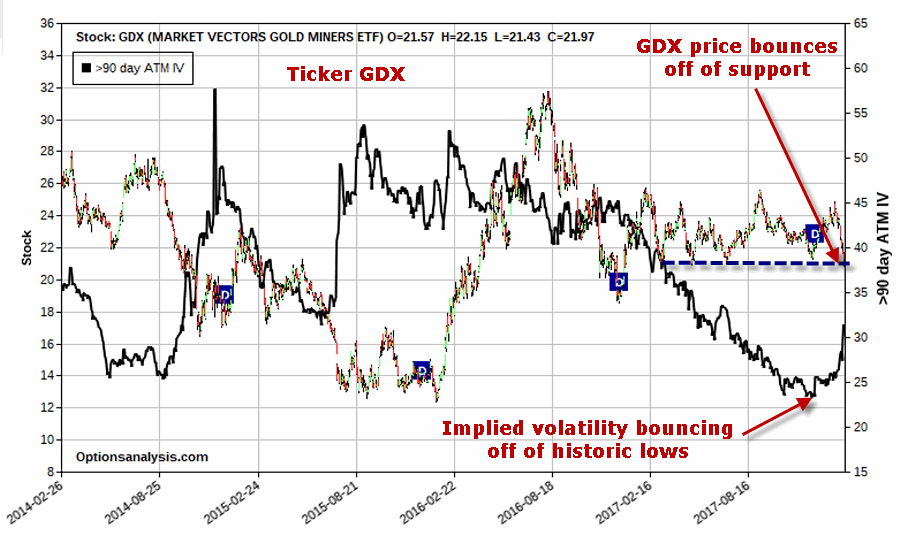
As you can see in Figure 6, implied volatility or options on GDX (black line) rose sharply in recent days (which actually pushed this example traded into profitable territory). There is still plenty of “upside” left for volatility and GDX just reversed back to the upside at support.
Figure 6 – Ticker GDX with implied option volatility (black line) (Courtesy www.OptionsAnalysis.com)


