On the heels of a weak PMI number out of China, the S&P 500 (ESU15:CME) on the cash session opened lower yesterday at 1923.00, down 38 handles from Monday’s close, and up nearly 10 handles from the globex low. The index tried to push higher on the open trading up to 1939.00, up 16 handles from the open, to make an early high at 9:00 CST before chopping lower much of the day and into the final hour where it made the low of day at 1898.75, at that point down over 60 handles on the day, on a small market-on-close (MOC) imbalance of about $150 million to sell. The futures did push up from the lows to close the regular session at 1915.75, down 45 handles on the day but up 17 handles from it’s low.
Let’s face the truth, it was a dirty way to start any month. In fact it was the worse start to a month since November 2011, the most recent prior correction year, and it was the worst start to a September since 2002.
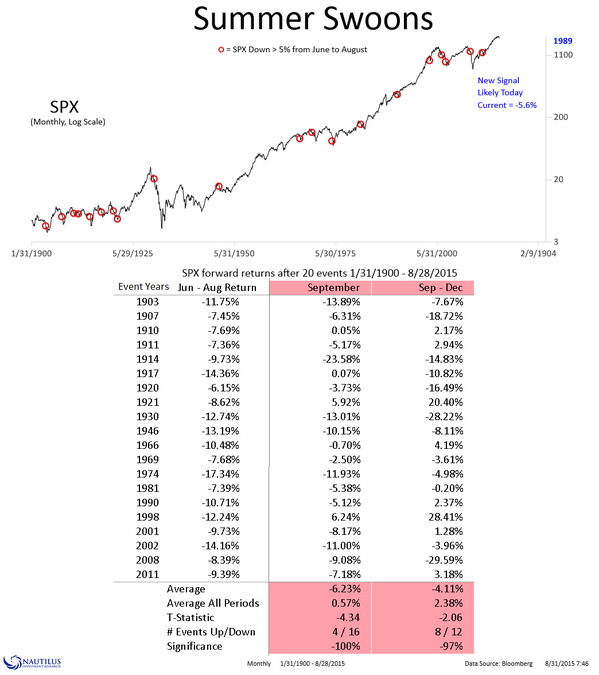
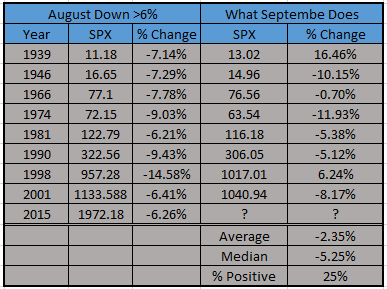
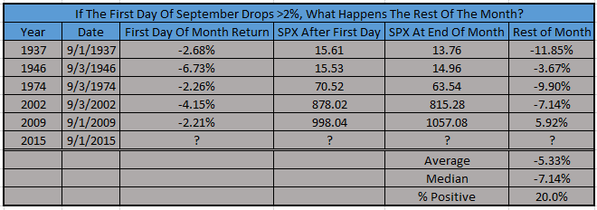
September has been the weakest month for the equity markets since 1950, however it is up the 7 of the last 10 years. The last 8 times since 2009 a month opened down more than 2% in all occurences that month closed higher. However, this was the fifth time since 1958 that the S&P 500 was down more than 2% to open September, and four of those five times the remainder of the month was down on average 7.5%, with 2009 being the lone exception. Next there have been eight times that August closed down greater than 6% since 1939, six of those eight occasions September close lower as well.
(note: a HUGE thank you to Ryan Detrick for these images used with permission)
S&P 500 FUTURES TAKE A BEATING BUT KEEP TICKING
The S&P has taken a beating since last week. You can see that as the volume picked up, so did the level of MOC selling. One of the things we have constantly written about is how the MOC buying switched to selling on the last trading days of the March or the last trading day of the first quarter.
High Low Close Volume MOC
Monday Aug 17 2100.50 2074.75 2099.25 1,292.404 $720 Mil to Sell
Tuesday Aug 18 2103.75 2090.25 2090.25 1,333,037 $730 Mil to Sell
Wednesday Aug 19 2098.00 2066.50 2072.25 2,287,294 $725 Mil to Sell
Thursday Aug 20 2077.75 2024.50 2025.50 2,577,298 $1.6 Bil to Sell
Friday Aug 21 2029.00 1967.25 1971.50 4,160,367 $2.9 to 3.3 Bil to Sell
Monday Aug 24 1964.75 1831.00 1871.20 5,243,619 $1.6 Bil to Sell
Tuesday Aug 25 1948.50 1860.00 1872.75 3.652.394 $2.9 Bil to Sell
Wednesday Aug 26 1943.00 1850.00 1938.00 3,652,294 $600 Mil to Sell
Thursday Aug 27 1990.25 1944.25 1989.30 2,933,144 $1.5 Bil to Buy
Friday Aug 28 1992.75 1967.25 1986.25 1,968,178 $300 Mil to Sell
Monday Aug 30 1987.75 1959.25 1969.25 1,862,948 $1.2 Bil to Buy
Tuesday Sept 1 1966.25 1898.75 1915.75 2,806,420 $150 Mil to Sell
Here is what I told the room yesterday: “There was a lot of protection put on over night and into today drop. My concern is that we maybe just looking at the beginning of this decline, we have all of Sept and at least the first 2 weeks of October. You guys know me; I’m a bull but I got a very bad feeling about the next few weeks, if the ESU15 goes out at or near its low of the day I think we go to 1880 then down to 1830. There is a ton of nervousness in the market place, China dumping US bonds”
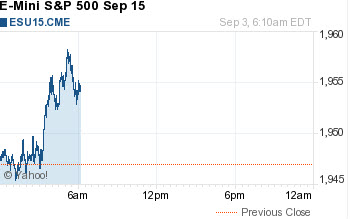
Last night the ESU15 opened little changed at 1913.15 and traded higher throughout the Asian session making it’s high around the Asian close of 1939.00 up nearly 25 handles before coming off some after the Euro close down to 1919.75 nearly 20 handles from the high and is currently trading at 1926.00 up 10 handles from yesterday’s close at 6:00 a.m. CST.
Yes, I have been worried, however I realize that yesterday brought in a new round of shorts. I noted earlier in the week that after last Monday’s crash volume was lower every consecutive day while the markets were going back up, this was until yesterday when volume had a higher day. I have often said the algo’s have to feast on both sides of the market and they took out many of the weak longs down all the below 1900.00 and now it’s stacking to the short side again and buy stops are building. I expect for the lows last week to be tested but I don’t think its going to go straight down in September, as indicated by the 2011 correction comparison I have been showing since last week.
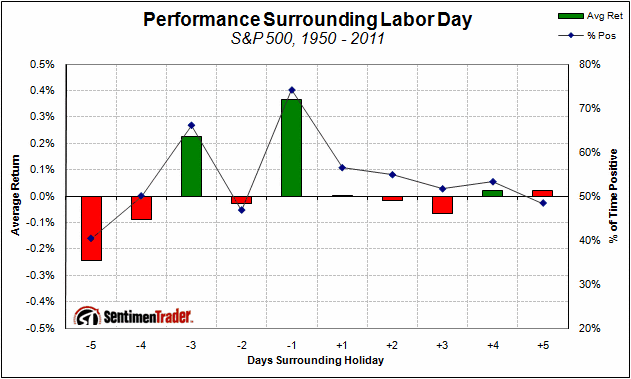
Today, the Wednesday of pre Labor Day week, which has closed higher 10 of the last 11 years, and the stats begin to look solid into the weeks close and I would not be surprised to see at least a retest of 1950.00 before traveling lower. Traders I have been saying repititiously the last few days that even while there have been violent moves it has still been a two sided market and there is little room for error right now, we cannot fall in love with our convictions or our positions, and must be willing to play both side without trying to call bottoms or tops. Keep your stops tight and take some profits when you have them.
In Asia, 8 out of of 11 markets closed lower (Nikkei 225. -0.39%), and in Europe 6 out 12 of markets are trading higher (DAX +0.13%). Today’s economic calendar consists of: MBA Mortgage Applications, Bank Reserve Settlement, ADP Employment Report, Productivity and Costs, Gallup U.S. Job Creation Index, Factory Orders, EIA Petroleum Status Report, Beige Book, and earnings from Vera Bradley Inc (NASDAQ:VRA), G-III Apparel Group Ltd (NASDAQ:GIII), Navistar International Corporation (NYSE:NAV), Five Below Inc (NASDAQ:FIVE), NCI Building Systems Inc (NYSE:NCS), Verint Systems Inc (NASDAQ:VRNT), ABM Industries Incorporated (NYSE:ABM), Oxford Industries Inc (NYSE:OXM), SeaChange International Inc (NASDAQ:SEAC), Culp Inc (NYSE:CFI), Crossroads Systems Inc (NASDAQ:CRDS), Isle of Capri Casinos Inc (NASDAQ:ISLE), Catalent Inc (NYSE:CTLT), Mitcham Industries Inc (NASDAQ:MIND), China Nepstar Chain Drugstore Ltd (NYSE:NPD), and Fenix Parts Inc (NASDAQ:FENX).
Our View: The futures have been up as much as 40 handles from yesterdays low, but are somewhat fizzling out at 6:30 a.m. CST. Over the last two weeks, bears have been able to put together strong days that include 50+ handle closes lower, and have controlled the final hour often closing near or at the lows. And while it’s natural for any market to revert to it’s mean, as we expect for buy stops to be run at the same time, bulls are not controlling anything at this point. Physics tell us that what goes up must go back down, and this we saw yesterday as the index futures dropped sharply, and today it is again up. I have expressed my concern over this price action and have been saying all along that we lean to selling rallies, and for now we maintain the sell rallies viewpoint. At this point it’s much easier to trade with the trend than it is to pick bottoms and pick up nickels in front of highway traffic. We will leave it at that.
And always remember to use stops when trading futures and options…
- In Europe 6 out of 12 markets are trading higher (6:30 am CT) : %, DAX +0.13%, FTSE 100 +0.05% at 6:00 am CT
- Fair Value: S&P -2.04, NASDAQ Composite -1.35, Dow -15.99
- Total Volume: 2.8 mil ESU and 4k SPU traded
- MBA Mortgage Applications, Bank Reserve Settlement, ADP Employment Report, Productivity and Costs, Gallup U.S. Job Creation Index, Factory Orders, EIA Petroleum Status Report, Beige Book, and earnings from VRA, GIII, NAV, FIVE, NCS, VRNT, ABM, OXM, SEAC, CFI, CRDS, ISLE, CTLT, MIND, NPD, and FENX.
- E-mini S&P 5001947.50+0.50 - +0.03%
- Crude Oil
- Shanghai Composite
- Hang Seng20934.94-250.49 - -1.18%
- Nikkei 22518232.52+137.12 - +0.76%
- DAX10048.05+32.48 - +0.32%
- FTSE 1006083.31+24.77 - +0.41%
- Euro 1.1227
- In Asia 8 out of 11 markets closed lower : Shanghai Comp. -0.20%, Hang Seng -1.18%, Nikkei -0.39%
- Original post
