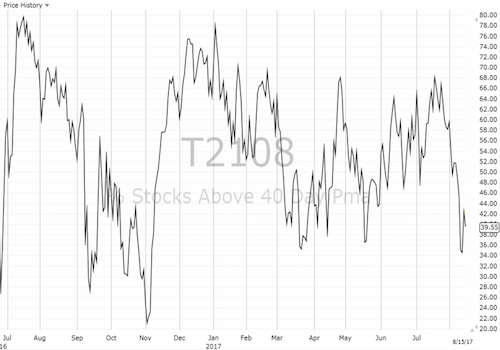
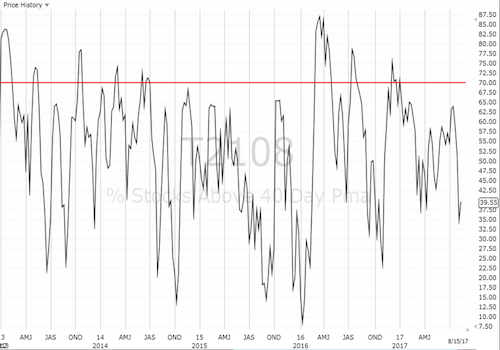
AT40 = 39.5% of stocks are trading above their respective 40-day moving averages (DMAs)
AT200 = 50.4% of stocks are trading above their respective 200DMAs
VIX = 12.0
Short-term Trading Call: bullish
Commentary
Urban Outfitters (NASDAQ:URBN) notwithstanding with its 19.5% after hours surge, Tuesday, August 15, 2017 was a signature day for the weakness engulfing retailing stocks. Despite my short-term bullish call for the S&P 500 and general stock market, I am devoting most of this Above the 40 post to the on-going ugliness that is retail.
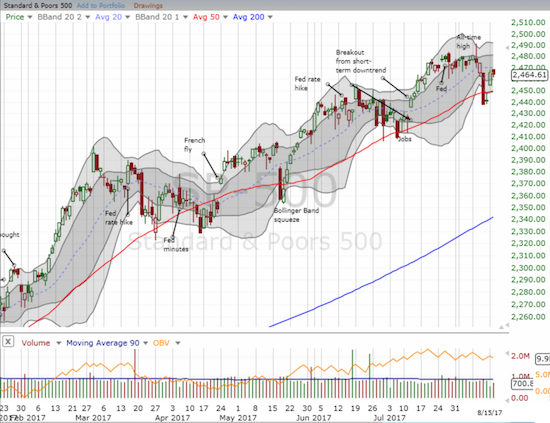
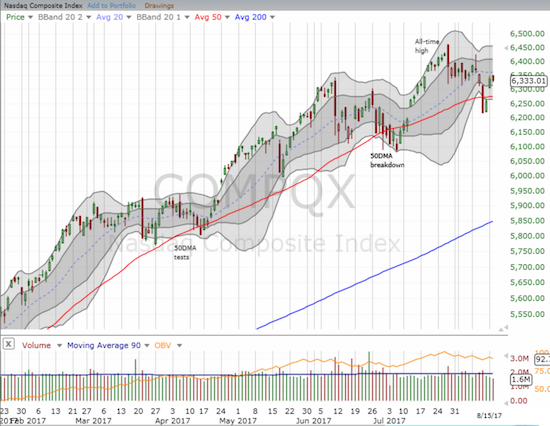
Tuesday was a “day of rest” from Monday’s fantastic and bullish rally. The S&P 500 (SPDR S&P 500 (NYSE:SPY)) tried to rally but ended the day essentially flat – ditto with the tech-laden NASDAQ. The PowerShares QQQ Trust (NASDAQ:QQQ) managed to end up on the green side of flat largely thanks to the 1.1% rally in Apple (NASDAQ:AAPL) (I took this opportunity to lock in profits on my AAPL call options).
The S&P 500 (SPY) took a break from the previous day’s bullish gap up.
The NASDAQ also took a break.
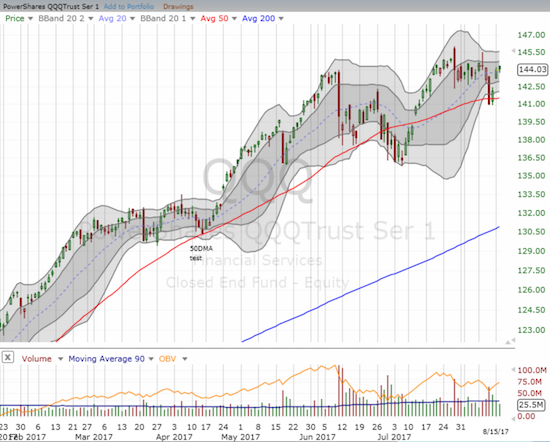
The PowerShares QQQ Trust (QQQ) managed to stay in the green.
The volatility index gapped down but managed to hold onto its declining 200-day moving average (DMA). Still, the implosion from last week’s spike continued.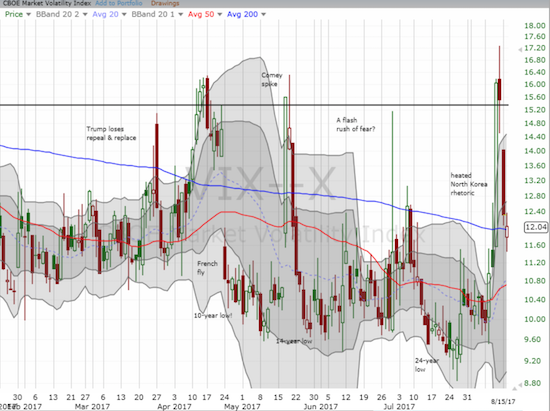
The volatility index (the VIX) continued its latest implosion.
AT40 (T2108), the percentage of stocks trading above their respective 40DMAs, confirmed the day of rest with its own pullback from 42.5% to 39.6%. AT200 (T2107), the percentage of stocks trading above their respective 200DMAs, closed at 50.4% which was below the previous 2017 low from May. So there remains a lingering longer-term concern emanting from this indicator.
Moving on to the big story of the day (for me), the SPDR S&P Retail (NYSE:XRT) dropped 2.7% to set a new 18-month low. Traders can be forgiven for missing the headline that retail sales jumped in July by the largest monthly percentage since the days of Christmas cheer.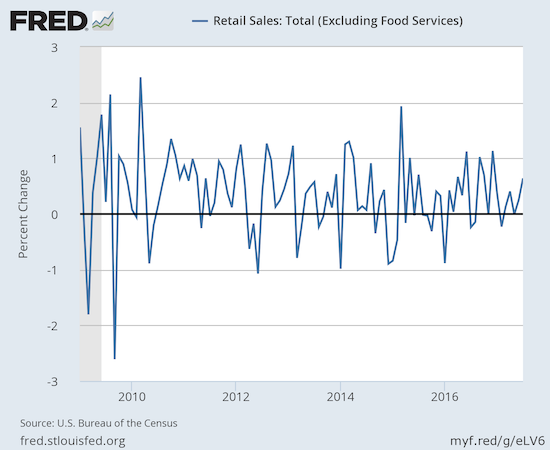
Retail sales (excluding food services) put on its best monthly show of the year…
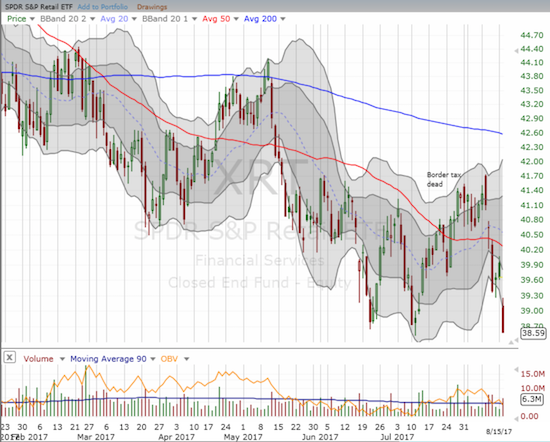
…but the economic data failed to do anything for SPDR S&P Retail ETF (XRT) which plunged to a fresh 18-month low.
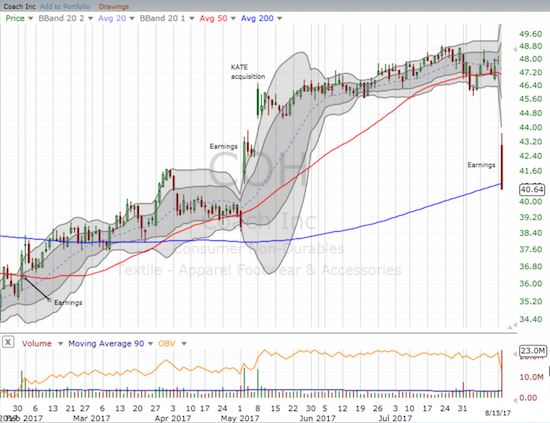
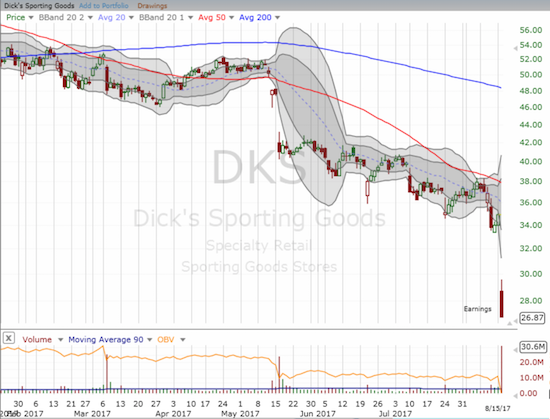
The carnage in retail was widespread, starting with key names that reported earnings: Advanced Auto Parts (NYSE:AAP) with a nasty 20.3% drop and a near 4-year closing low, Coach (NYSE:COH) with a 15.2% decline that punctured 200DMA support, and Dick’s Sporting Goods (NYSE:DKS) rounded out the disaster trio with a whopping 23.0% plunge that ended at the low of the day and a fresh SEVEN year low. Ouch. (Note I speculated on COH by first flipping shares for a small intraday profit and then ended the day with call options to play 200DMA support).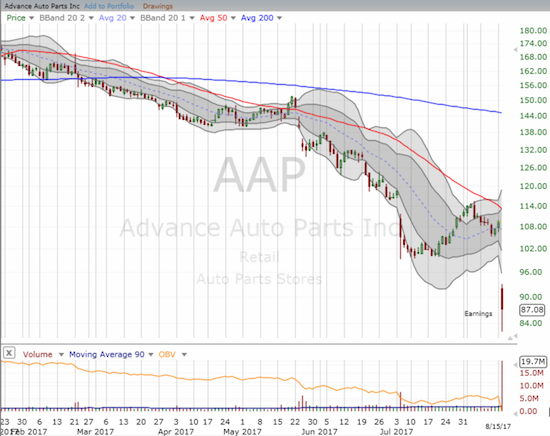
Advanced Auto Parts (AAP) continued the pain in the auto parts sector.
Coach (COH) was a rare retail comeback story until this earnings report.
Dick’s Sporting Goods (DKS) continued the pain in sporting gear. Has everyone stopped playing sports and hitting the outdoors?!?!
Target Corporation (NYSE:TGT)
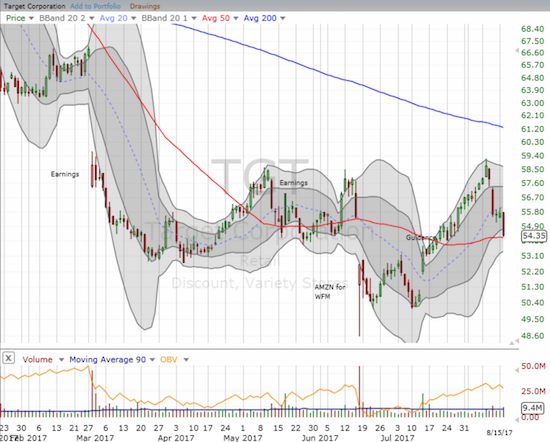
TGT took it on the chin for a 2.6% loss and a tempting test of its 50DMA. I recently bought shares for a longer-term play, but I like doing another short-term round of call options around these levels.
Target (TGT) has erased most of its gains from July’s strong guidance
Nordstrom (NYSE:JWN)
I am surprised JWN has made no progress since news about the likelihood of the company going private. In last week’s sell-off, I looked the stock up and started a new position on the dip. There should be at least 10% potential upside from current levels just measuring the current trading range.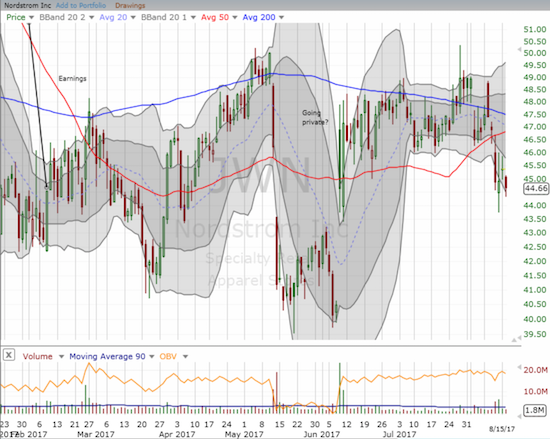
The retail sell-off brought Nordstrom (JWN) down to the bottom of its post-going-private trading range. Looks like a buying opportunity for now.
Ulta Beauty Inc (NASDAQ:ULTA)
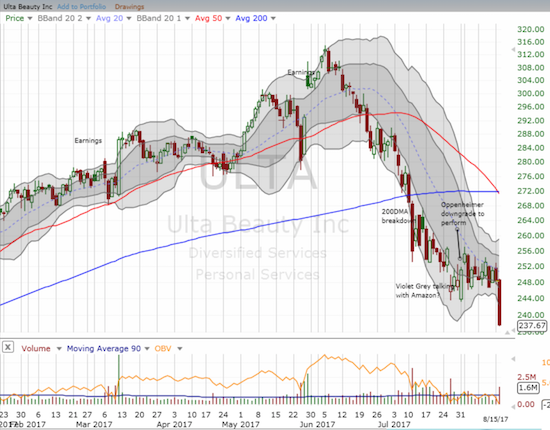
Regular readers know that I have been eyeing ULTA ever since it broke down below 200DMA support. Today’s 4.4% plunge broke the recent logjam and further confirmed the bearish turn of events for this former momentum stock. Again, ULTA has all the characteristics of a stock where big players are trying their best to abandon ship in an orderly fashion. I was positioned to keep playing the recent tight range from the bearish side and sold my latest put option on Monday for minimal profit. I clearly regret that I let Monday’s stock market rally dissuade me from continuing to hold onto the put option.
The exit from Ulta Beauty (ULTA) took another step lower with a high-volume loss and a new 9-month low.
The Childrens Place Retail Stores (NASDAQ:PLCE)
PLCE is one of the few apparel retailers that continues to pump out strong results. The stock is doing its best to pivot around an uptrending 200DMA. However, Monday’s severe under-performance along with a combined 50/200 DMA breakdown is a big red flag. I want to buy this dip, but the technicals are waving me off. I want to see a close above the moving averages before I consider it. I do not want to short PLCE given I think the business remains quite strong…granted a short interest that is 32% of float suggests a much different conclusion!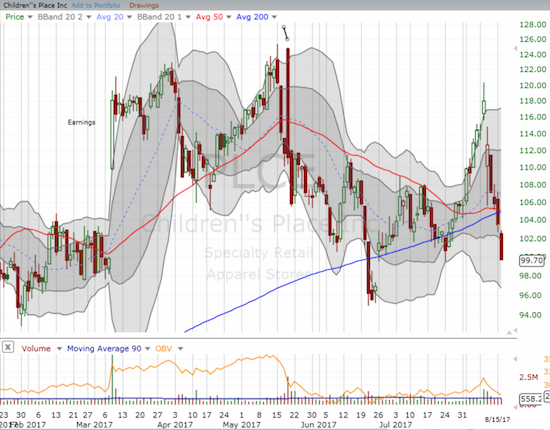
Children’s Place (PLCE) is struggling to hold onto its 200DMA uptrend.
Domino’s Pizza Group Plc (NYSE:DPZ)
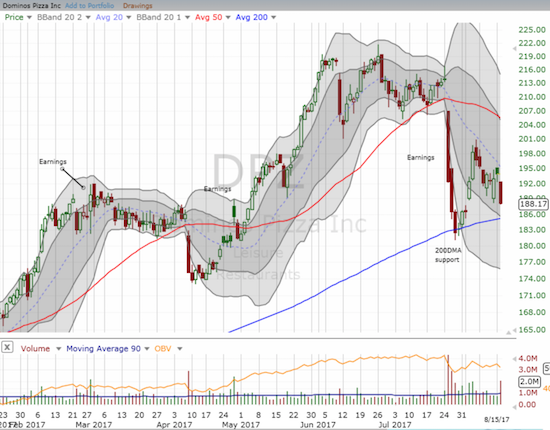
I am glad I took profits when I did. DPZ has pulled back since I sold. The stock looks ready for another test of 200DMA support. I am ready to buy again, but I will exercise a little more patience as it is very possible now that DPZ is in the middle of a major breakdown: the stock is still in the middle of post-earnings weakness.
Is Domino’s Pizza (DPZ) in the middle of a major breakdown initiated by a very negative reaction to the last earnings report?
The Cheesecake Factory (NASDAQ:CAKE)
I used to love Cheesecake Factory “back in the day.” I have made it there just twice in the last year and both times I have been astounded by the sheer number of options on the menu. Clearly, the abundance of options and delicious desserts are somehow insufficient these days. CAKE the stock is down sharply from the all-time high just three months ago. Tuesday it closed at a fresh near 3-year low. Shorts are eating their cake on this one to the tune of 18% of float.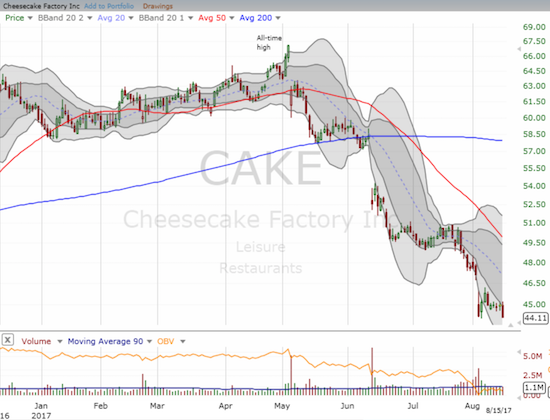
The Cheesecake Factory (CAKE) has suddenly and sharply fallen from favor in just three months.
Chipotle Mexican Grill (NYSE:CMG)
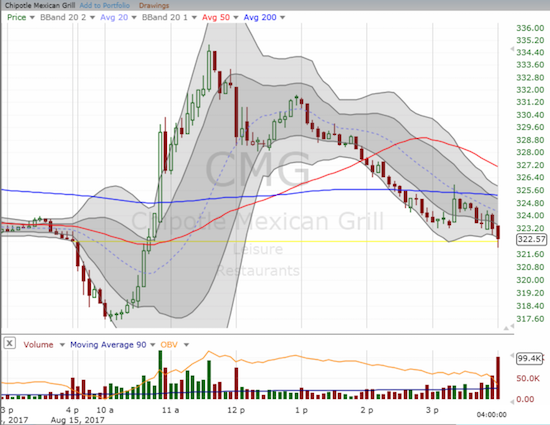
CMG has suffered mightily for a while now. In today’s trading, “something” dramatic happened. Sellers took early control only to be overrun starting right at 10am (Eastern). However, when buyers went to lunch, they apparently never returned. CMG ended the day flat. The 5-minute chart shows the intraday drama, and the daily chart shows the resulting stalemate in high relief. I typically think of such moves as a turning point where the last of the panicked sellers finally shake out. Yet, the buyers were not very convincing. Still, I jumped aboard soon after the dramatic turn-around. Time will soon tell whether I am next to get shaken out! Continuing the theme: shorts are 17.9% of CMG’s float.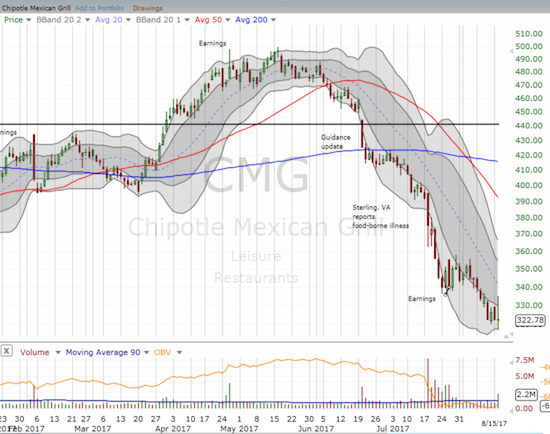
Chipotle Mexican Grill (CMG) confirmed a rounded top when it broke down in June. The latest breakdown to a new 4+ year low may mark an overdue turning point.
Buyers swiftly swooped in at the lows for Chipotle Mexican Grill (CMG), but they lost interest after two hours. The flat close suggests that the next push past the day’s extreme will dominate the next phase of trading.
International Business Machines (NYSE:IBM)
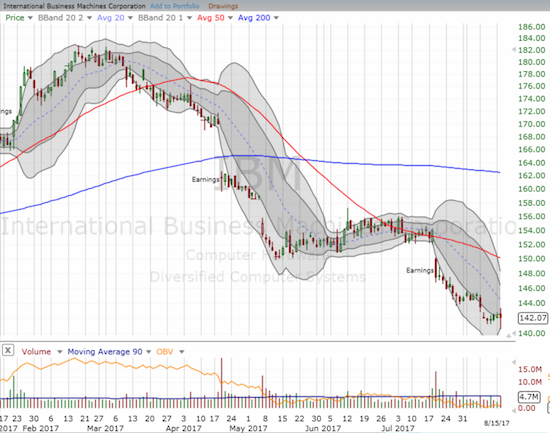
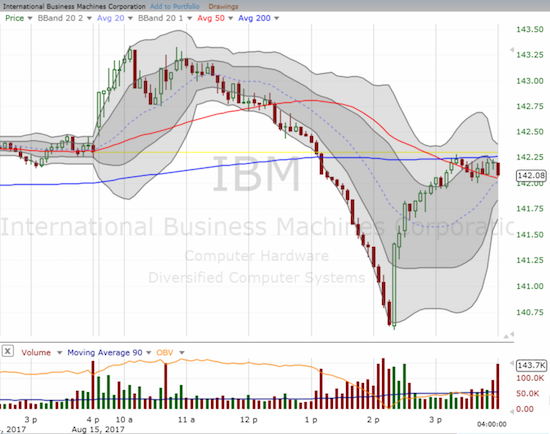
IBM also had a dramatic bear/bull intraday battle. Unlike CMG, the buyers made a lasting statement and had the last word on the day. A Bollinger Band (BB) squeeze is even developing around the stock. Unlike CMG, I was betting on a continuation of the breakdown. I became emboldened after Warren Buffet started to capitulate on his position back in May. I will quickly switch to a buyer if IBM makes more progress from here.
International Business Machines (IBM) briefly made a 17-month low before buyers came to the rescue.
This 5-minute chart reveals the dramatic way in which buyers rushed in to flatten out International Business Machines (IBM) for the day.
Eastman Kodak Co (NYSE:KODK)
I was rooting for KODK after it emerged from bankruptcy and started trading again almost 4 years ago. Back in 2012, the original stock was one of my biggest “bankruptcy scare” trades ever. The celebration did not last long as the stock proceeded to go into a fresh tailspin starting in early 2014. A relief rally in 2016 broke the gloom, but KODK hit a new all-time closing low today. I want to believe there is value here, but I do not dare reach out for the falling knife at this point. I will continue watching for now.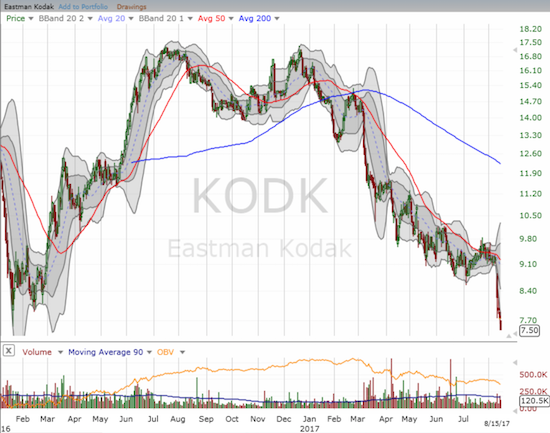
The comeback for Eastman Kodak (KODK) is in serious peril as the stock closed at a fresh all-time low.
Netflix (NASDAQ:NFLX)
The Barron’s effect is surprisingly still weighing on NFLX. I speculated further on an eventual rebound and doubled down on my call options. The 50DMA still sits there waiting to offer support. NFLX once again under-performed the usual suspects.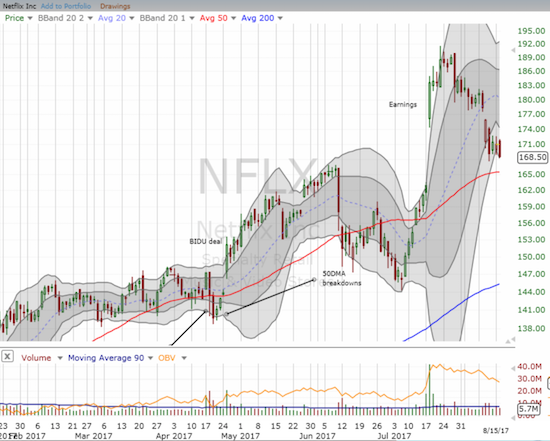
A negative weekend piece from Barron’s continues to weigh on Netflix (NFLX) and has extended a post-earnings reversal.
AMC Entertainment Holdings Inc (NYSE:AMC)
The bottom did not hold on AMC as I had hoped. The bounce only lasted three trading days. Now I will patiently wait for buyers to show interest again before acquiring a second tranche of shares. The hurdle is high given shorts have consumed 19% of AMC’s float.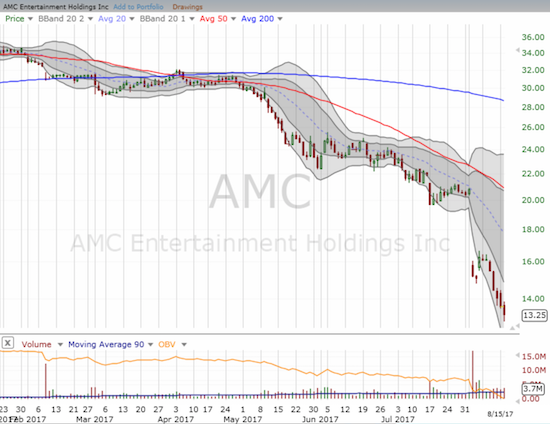
AMC Entertainment (AMC) returned to sell mode and hit fresh all-time lows.
Urban Outfitters Inc (NASDAQ:URBN)
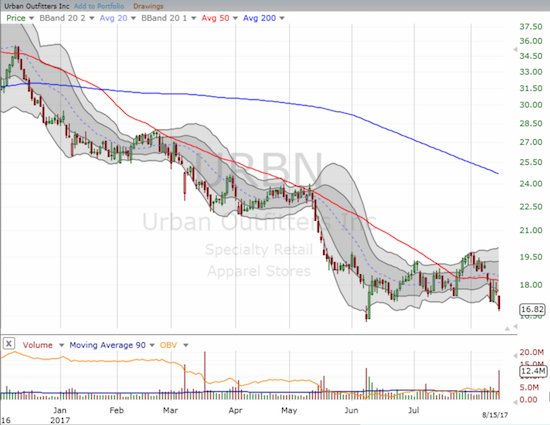
Finally, the next great hope for retail: URBN. URBN reported earnings that the market in after hours loved. Ahead of those earnings, URBN suffered along with the entire retail space with a high-volume 5.1% decline toward 2017’s low.
Urban Outfitters (URBN) looked ready to break down again ahead of earnings.
Here is silver for one last trading note. I jumped back into call options on iShares Silver Trust (NYSE:SLV). My rationale remains the same for the last trade. Here, I am playing a test of converged support at the 20 and 50DMAs.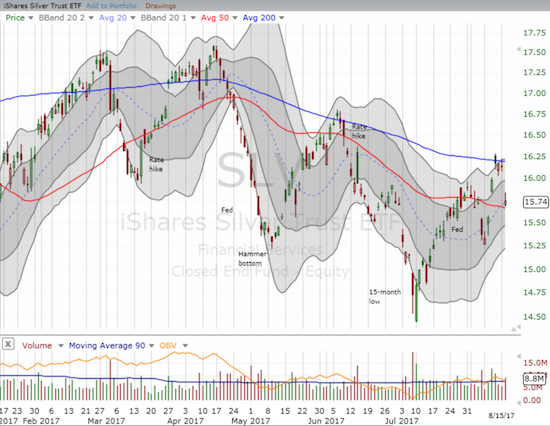
Resistance at the downtrending 200DMA held tough on the iShares Silver Trust (SLV). Can 50DMA support provide a springboard for a higher low?
“Above the 40” uses the percentage of stocks trading above their respective 40-day moving averages (DMAs) to assess the technical health of the stock market and to identify extremes in market sentiment that are likely to reverse. Abbreviated as AT40, Above the 40 is an alternative label for “T2108” which was created by Worden. Learn more about T2108 on my T2108 Resource Page. AT200, or T2107, measures the percentage of stocks trading above their respective 200DMAs.
Active AT40 (T2108) periods: Day #377 over 20%, Day #191 over 30%, Day #1 over 40% (overperiod ending 2 days under 40%), Day #8 under 50% (underperiod), Day #14 under 60%, Day #137 under 70%
Black line: AT40 (T2108) (% measured on the right)
Red line: Overbought threshold (70%); Blue line: Oversold threshold (20%)
Be careful out there!
Full disclosure: long AAPL calls, long NFLX calls, long APRN shares
*Charting notes: FreeStockCharts.com uses midnight U.S. Eastern time as the close for currencies.

