Breaking News
Investing Pro 0
💎 Reveal Undervalued Stocks Hiding in Any Market Get Started

The Philly Fed ADS Business Conditions Index Update

By Jill MislinskiMarket OverviewJan 12, 2018 01:46AM ET
www.investing.com/analysis/the-philly-fed-ads-business-conditions-index-update-200279761
The Philly Fed ADS Business Conditions Index Update
By Jill Mislinski   |  Jan 12, 2018 01:46AM ET
Saved. See Saved Items.
This article has already been saved in your Saved Items
 

Note: We've updated our periodic look at the Philly Fed ADS Index today's release, which includes jobless claims through January 6.

The Philly Fed's Aruoba-Diebold-Scotti Business Conditions Index (hereafter the ADS index) is a fascinating but relatively little known real-time indicator of business conditions for the U.S. economy, not just the Third Federal Reserve District, which covers eastern Pennsylvania, southern New Jersey, and Delaware. Thus it is comparable to the better-known Chicago Fed's National Activity Index (more about the comparison below).

Named for the three economists who devised it, the index, as described on its home page, "is designed to track real business conditions at high frequency."

The index is based on six underlying data series:

The accompanying commentary goes on to explain that "The average value of the ADS index is zero. Progressively bigger positive values indicate progressively better-than-average conditions, whereas progressively more negative values indicate progressively worse-than-average conditions."

The first chart shows the complete data series, which stretches back to 1960. We've highlighted recessions and the current level of this daily index through its latest data point.
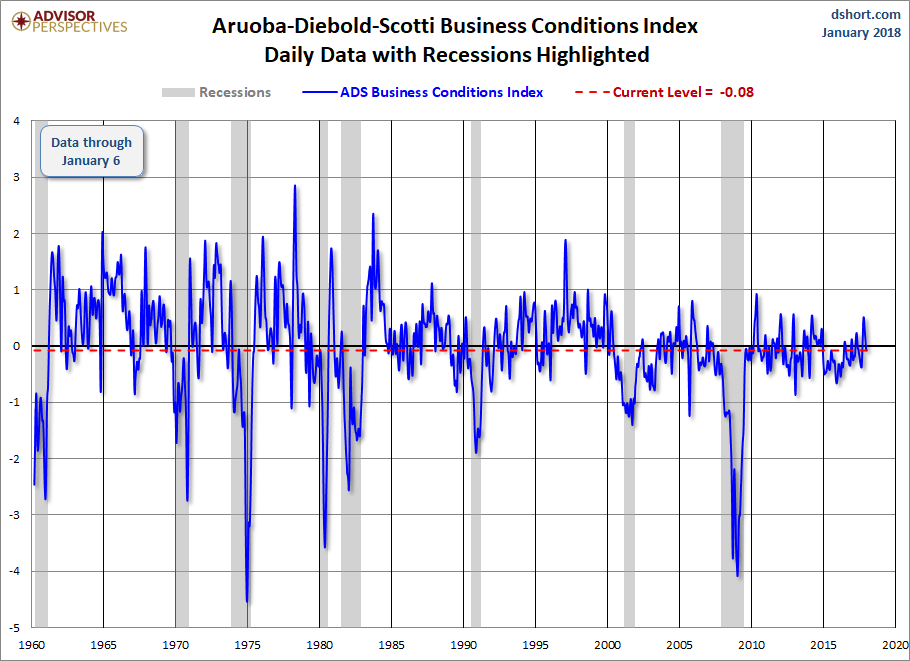
ADS Index Daily
ADS Index Daily

Now let's take a closer look at the 21st-century daily index. We've added a pair of dashed parallel lines highlighting a high-low channel since 2010. Our purpose was to give a better sense of direction for the economy. The top dashed line marks the post-recession peaks. The bottom line is parallel to it and positioned at the early 2013 low. The recent interim lows have been trending higher.
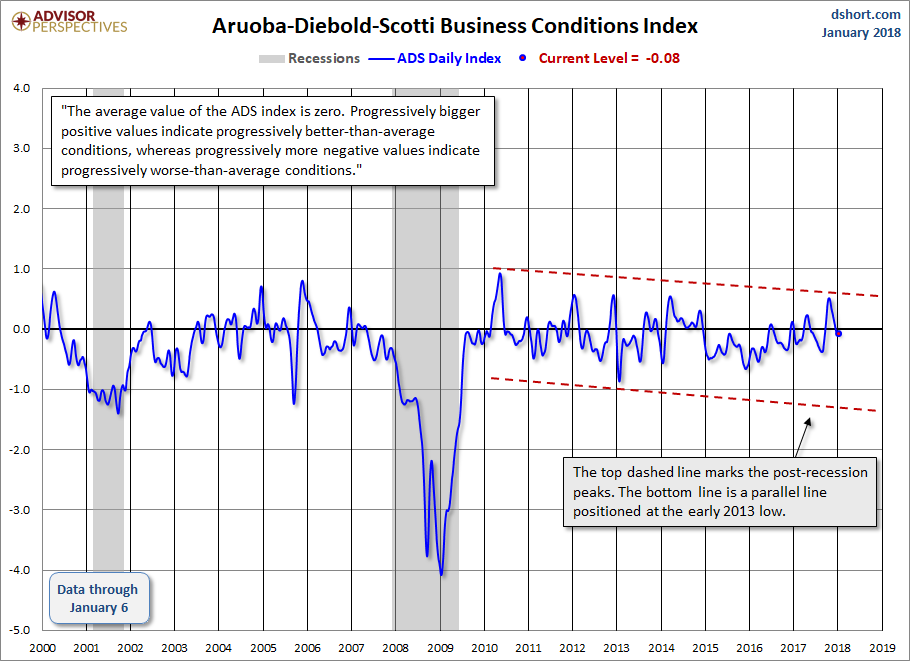
Aruoba-Diebold-Scotti Bsiness Conditions Index

A Smoothed Look at the ADS Index and Recessions

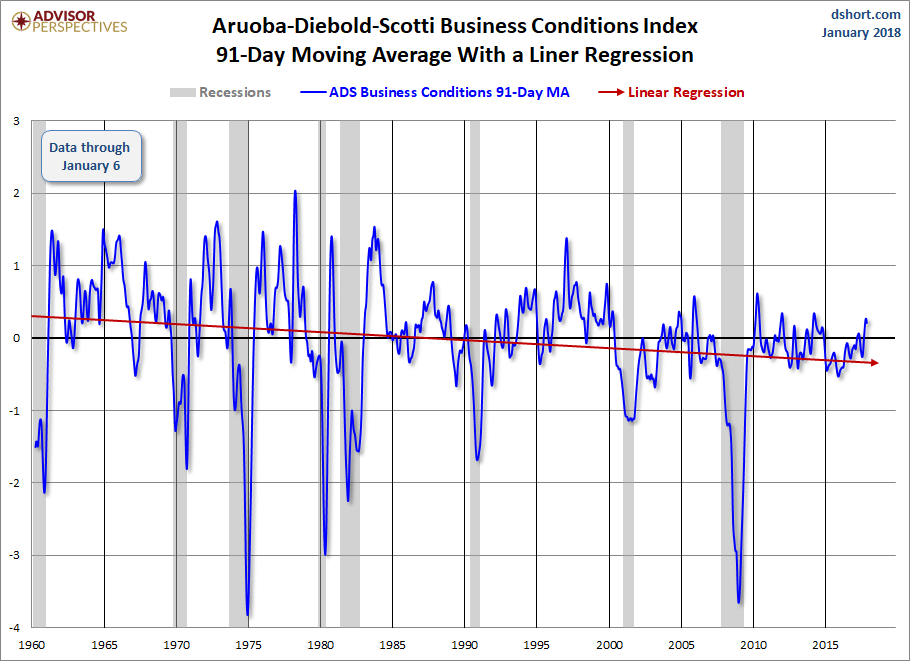
The chart below features a 91-day moving average of this daily index. Why 91 days? The better know cousin index of the Philly Fed's ADS the Chicago Fed's National Activity Index. The CFNAI is updated monthly, but the metric that gets the most attention by the Chicago Fed economists is its three-month moving average. They've even coined an acronym for it, the CFNAI-MA3. Thus we've used 91 days as a comparable smoothing of the Philly Fed ADS index. In the ADS 91-day MMA chart below we've highlighted recessions and the value of the smoothed index at recession starts.
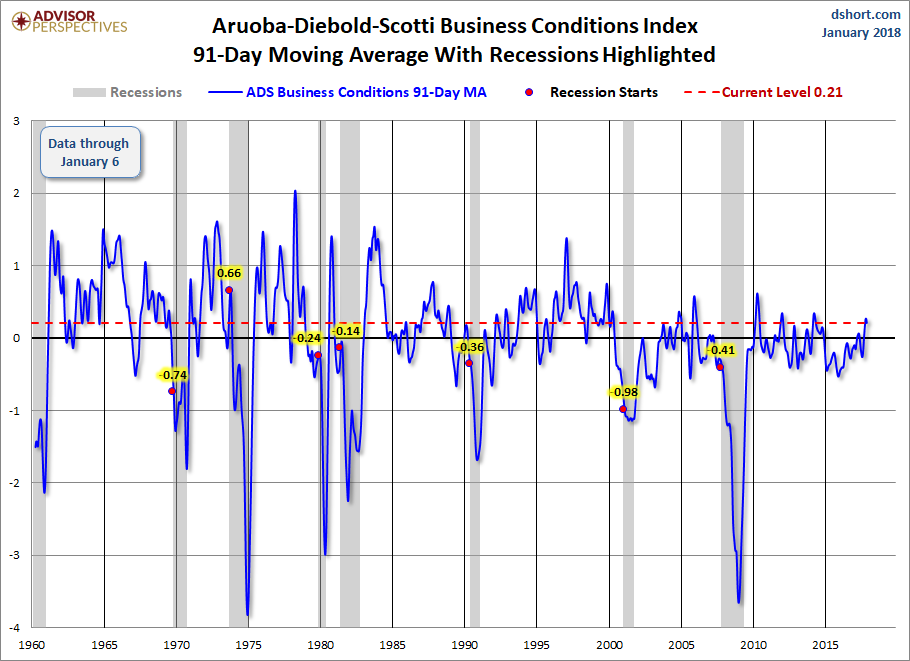
91-Day Moving Average

A Comparison with the Chicago Fed's National Activity Index

Now let's compare the Philly Fed's Business Conditions Index with the Chicago Fed's National Activity Index (CFNAI), which reaches back to March 1967. (See also our latest monthly update for the CFNAI here.) The CFNAI is based on 85 economic indicators from four categories:

  • Production and income
  • Employment, unemployment and hours worked
  • Personal consumption and housing
  • Sales, orders, and inventories

For a close look at the four components, see this monthly update.

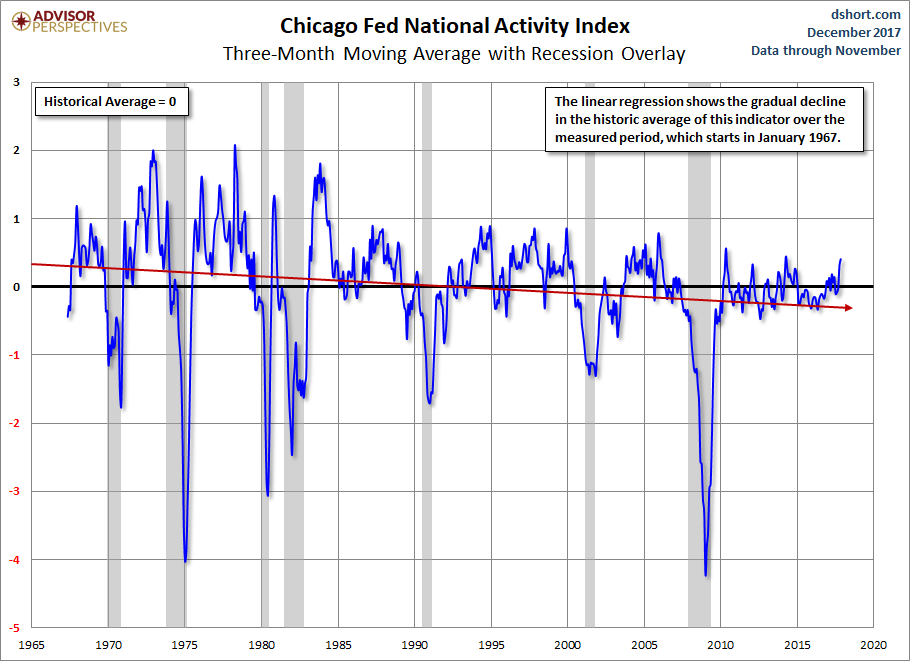
Here is the aforementioned CFNAI-MA3.
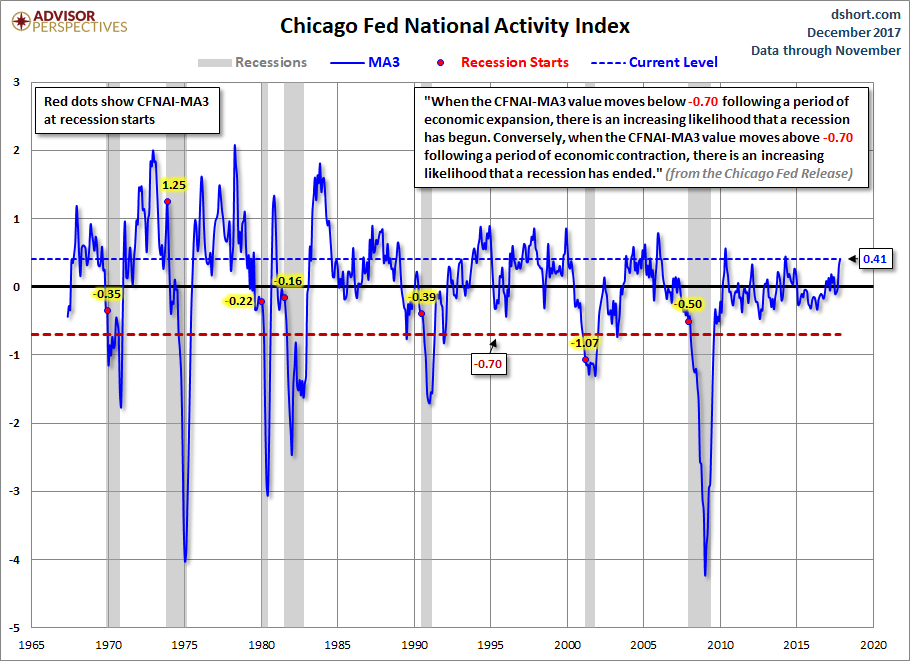
CFNAI Recession Indicator

Even the most cursory examination shows the reasonably close correlation between these two indicators of the general economy. Moreover, the recession overlays for both also confirm their general accuracy in illustrating major economic downturns over the last few decades. Of course, these aren't real-time calls, because both are subject to rather extensive revisions.

The next chart reveals a trend in the ADS index — one that might not be obvious at first glance. Let's let Excel draw linear regressions through the data series.
ADS with Regression
ADS with Regression

Compare the slope of the regression with its counterpart in the CFNAI-MA3.
CFNAI with Regression

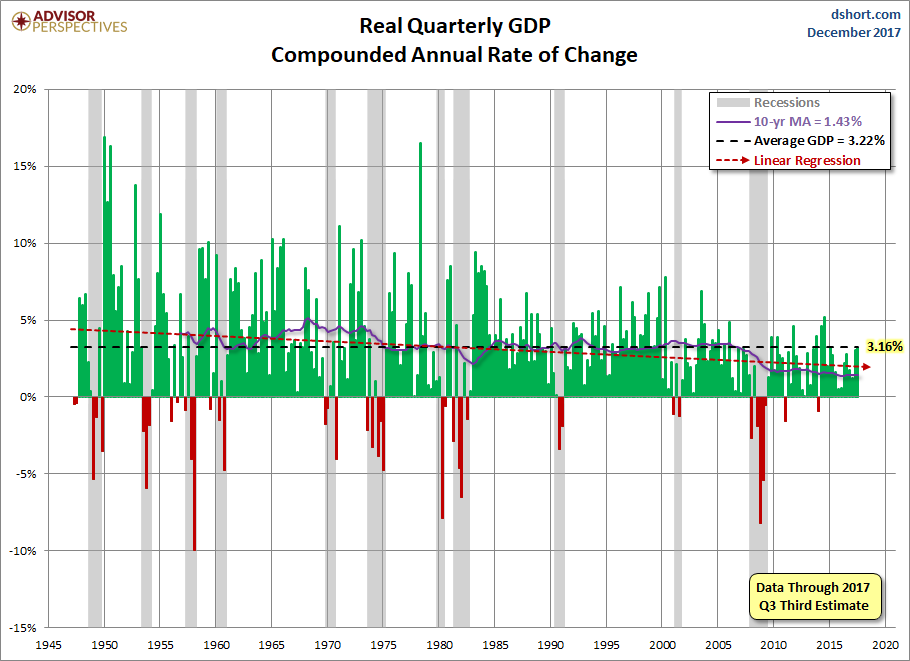
This chart duo indeed tells us something about the long-term trend toward slowing growth in the post-industrial economy of the United States. In fact, we see a similar trend in real GDP as illustrated by both the moving average and linear regression in the chart below.
Real GDP with Regression

We'll continue to post periodic updates of this overview of the Philly Fed ADS Index.

The Philly Fed ADS Business Conditions Index Update
 

Related Articles

The Philly Fed ADS Business Conditions Index Update

Add a Comment

Comment Guidelines

We encourage you to use comments to engage with other users, share your perspective and ask questions of authors and each other. However, in order to maintain the high level of discourse we’ve all come to value and expect, please keep the following criteria in mind:  

  •            Enrich the conversation, don’t trash it.

  •           Stay focused and on track. Only post material that’s relevant to the topic being discussed. 

  •           Be respectful. Even negative opinions can be framed positively and diplomatically. Avoid profanity, slander or personal attacks directed at an author or another user. Racism, sexism and other forms of discrimination will not be tolerated.

  • Use standard writing style. Include punctuation and upper and lower cases. Comments that are written in all caps and contain excessive use of symbols will be removed.
  • NOTE: Spam and/or promotional messages and comments containing links will be removed. Phone numbers, email addresses, links to personal or business websites, Skype/Telegram/WhatsApp etc. addresses (including links to groups) will also be removed; self-promotional material or business-related solicitations or PR (ie, contact me for signals/advice etc.), and/or any other comment that contains personal contact specifcs or advertising will be removed as well. In addition, any of the above-mentioned violations may result in suspension of your account.
  • Doxxing. We do not allow any sharing of private or personal contact or other information about any individual or organization. This will result in immediate suspension of the commentor and his or her account.
  • Don’t monopolize the conversation. We appreciate passion and conviction, but we also strongly believe in giving everyone a chance to air their point of view. Therefore, in addition to civil interaction, we expect commenters to offer their opinions succinctly and thoughtfully, but not so repeatedly that others are annoyed or offended. If we receive complaints about individuals who take over a thread or forum, we reserve the right to ban them from the site, without recourse.
  • Only English comments will be allowed.
  • Any comment you publish, together with your investing.com profile, will be public on investing.com and may be indexed and available through third party search engines, such as Google.

Perpetrators of spam or abuse will be deleted from the site and prohibited from future registration at Investing.com’s discretion.

Write your thoughts here
 
Are you sure you want to delete this chart?
 
Post
Post also to:
 
Replace the attached chart with a new chart ?
1000
Your ability to comment is currently suspended due to negative user reports. Your status will be reviewed by our moderators.
Please wait a minute before you try to comment again.
Thanks for your comment. Please note that all comments are pending until approved by our moderators. It may therefore take some time before it appears on our website.
 
Are you sure you want to delete this chart?
 
Post
 
Replace the attached chart with a new chart ?
1000
Your ability to comment is currently suspended due to negative user reports. Your status will be reviewed by our moderators.
Please wait a minute before you try to comment again.
Add Chart to Comment
Confirm Block

Are you sure you want to block %USER_NAME%?

By doing so, you and %USER_NAME% will not be able to see any of each other's Investing.com's posts.

%USER_NAME% was successfully added to your Block List

Since you’ve just unblocked this person, you must wait 48 hours before renewing the block.

Report this comment

I feel that this comment is:

Comment flagged

Thank You!

Your report has been sent to our moderators for review
Continue with Google
or
Sign up with Email