Get 40% Off
⚠ Earnings Alert! Which stocks are poised to surge?
See the stocks on our ProPicks radar. These strategies gained 19.7% year-to-date.
Unlock full list

The Next Precious Metals Super Hero

Published 09/24/2019, 01:48 PM
Updated 07/09/2023, 06:31 AM

If you’ve been following our research, you already know how accurately we’ve been nailing the precious metals price moves. We’ve been calling gold and silver accurately since early 2018 and continue to focus a good portion of our efforts in studying these incredible setups. Let’s have a little fun and start with two charts from near July 20, 2019, to help our followers understand what we’ve been expecting.

This first monthly silver chart highlights what we believed would be the approximate wave structure of the silver price advance going forward. We did not attempt to accurately time these peaks of valleys, we simply used our Fibonacci Price Amplitude Arcs to allow price to tell us where these peaks may form. From those levels, we used our best “guess” to identify the trough bottoms.

You can see a “Started Here” line near the bottom of this chart. This highlights where we created this chart and where the price was when we first posted it in our research (near $16.39). As of today, the price of Silver is near $18.75 and climbing. We’ve drawn in the missing data on this chart and highlighted the endpoint with a “NOW Here!” message. Once the price of silver breaks above that BLUE Fibonacci Price Amplitude Arc, it should rally up to $23 to $25 before finding new resistance.
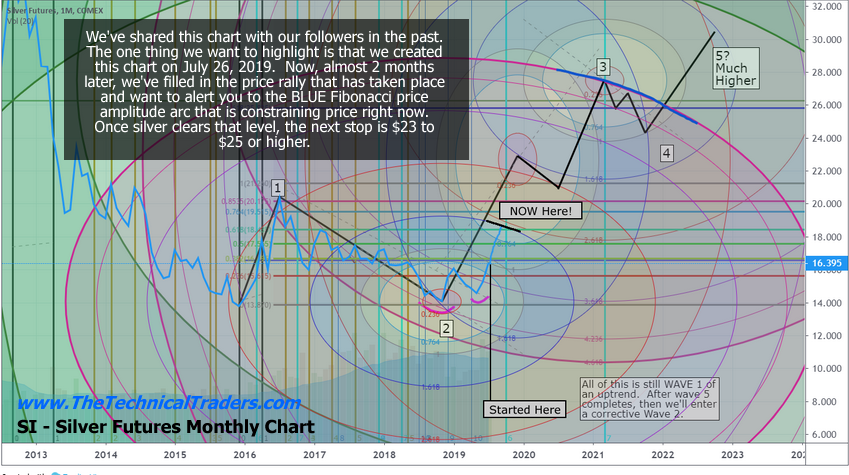
Monthly Silver

This next silver weekly chart was shared with our members near July 25, 2019. Pay very close attention to the arrows we drew on the chart at that time. Guess what the price of silver actually did after this chart was shared with our readers? Yup, silver shot up to $19.75 in early September, rotated back to the $17.50 level near the middle of September, and is starting a new rally towards the $23 to $25+ level right now. Does that look familiar to you on this chart (below)?
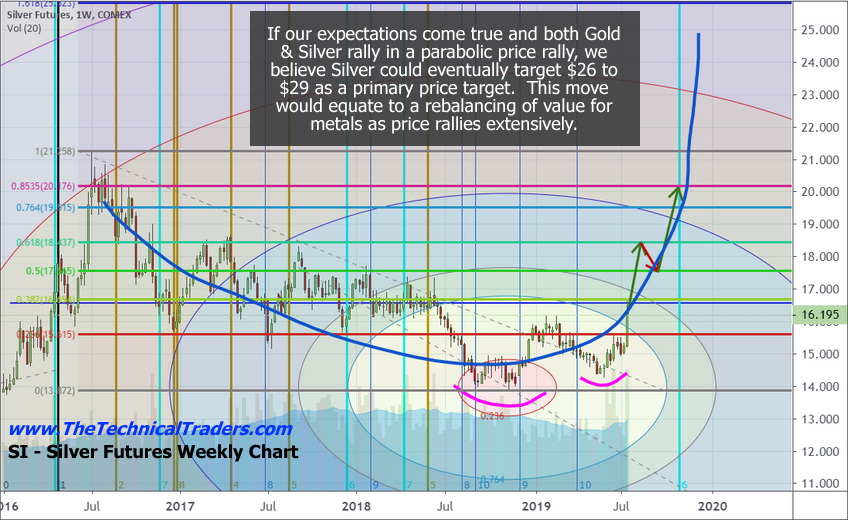
Weekly Silver

If this seems amazing to you because we were able to see these moves so accurately into the future and had such a keen insight into the future metals price rotation – don’t be alarmed. Our proprietary research tools are second to none. Our team of researchers have more than 54 years of experience in the markets and have studied almost all types of price theory, technical analysis, and other types of market price, technical, and fundamental analysis techniques. We put our skills to the test every day in order to help our clients find and execute the best trades.

What's Next?

Well, the charts above actually show you what’s next. The charts below highlight new triggers that we believe will drive the current rally in silver even higher.

Take notice of the HEAVY MAGENTA Fibonacci Price Amplitude Arc. The reason we highlight this MAGENTA level and the GREEN level in heavier line drawn is because these levels tend to become the major price inflection points within the arcs. In other words, these levels are where the price will either stall/reverse or breakout of a trend and possibly explode into a bigger price trend. The current Magenta line has just been crossed and the price is already exploding to the upside. If this continues as we expect, this Weekly Custom Metals Index could rally another 25% higher – which would put gold well above $1800 per ounce and silver well above $24 per ounce.
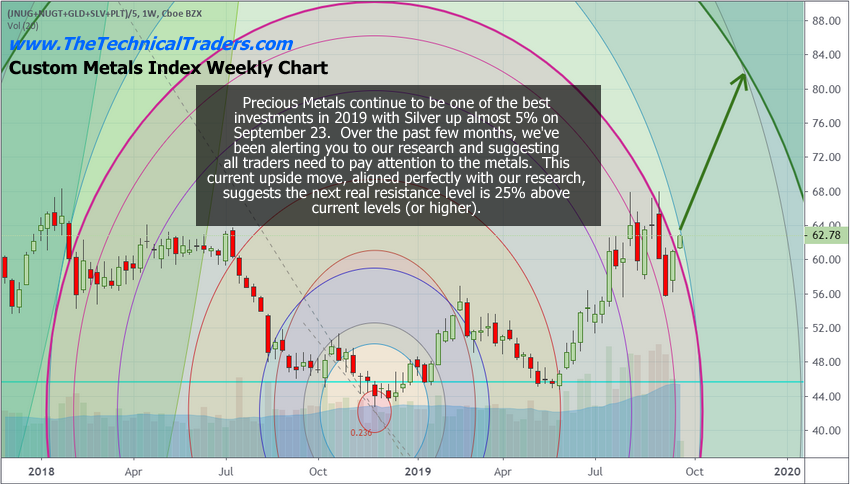
Weekly Metals

This last silver daily chart is our silver cycle chart. It shows that we expect silver to reach levels above $23 to $25 before early November 2019. That means silver could rally 20~25% from current levels within the next 30+ days to reach our current upside targets. Are you ready?
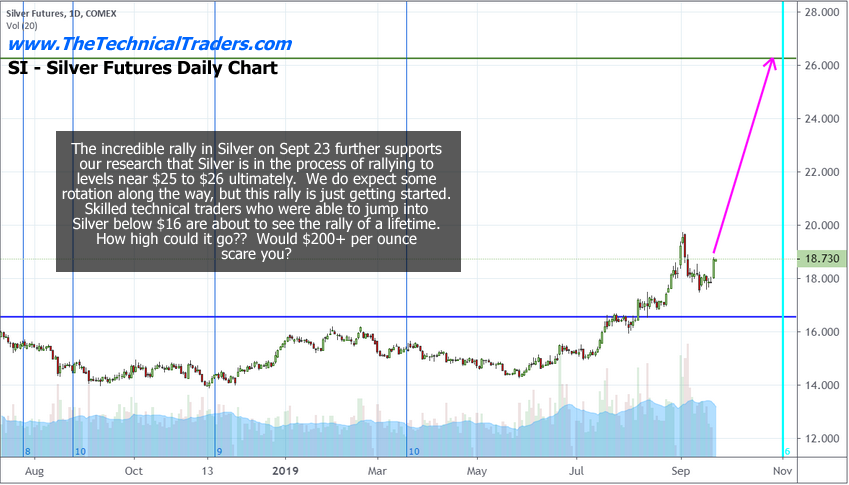
Daily Silver

Latest comments

It's fun to go back and score prognosticators on their accuracy to-date. Silver topped the day this article was written and has declined since then. Going long even a single silver futures contract after seeing this article would have racked up a minimum of $5k in losses to date and about a $7,500 max drawdown.
Sir I doubt that your 1600 in gold and 2000 in silver will be reached by 2019
higher $65..with a base and cup to go even further ahead..thats without the craziness now your looking at a factor of +30 solely on worldwide market panic buying..if it can reach 50 at a no panic state.. imagine a panic like 1929 in todays world..be smart diversify
i think that outlook of gold reaching $1800 is very optemistic. Euphoria for precious metals might be running dry soon if trade talks resume and geopolitical tensions ease. Not to mention ETF such as DUST has been increasing for the past weeks. market is hypersensitive to any news rather than facts. I personally think that Gold will tank soon
and what about Gold
Prior top of buy zone @17.40. Missed entry on dip. Top of buy zone changed to 17.60. Breakout, and another missed entry. Now evoking a "perfect call" on the dip at 17.50, while the bottom of your buy zone is still under $17. I used to support you, but now you're just lying.
Rule of thumb: Never expect a perfect entry. Get over of Greed. Nobody can predict anything to the finest point.
Thank you
Great sir
I started following Chris recently. He has been pin point accurate lately. Wow. Very impressed
Risk Disclosure: Trading in financial instruments and/or cryptocurrencies involves high risks including the risk of losing some, or all, of your investment amount, and may not be suitable for all investors. Prices of cryptocurrencies are extremely volatile and may be affected by external factors such as financial, regulatory or political events. Trading on margin increases the financial risks.
Before deciding to trade in financial instrument or cryptocurrencies you should be fully informed of the risks and costs associated with trading the financial markets, carefully consider your investment objectives, level of experience, and risk appetite, and seek professional advice where needed.
Fusion Media would like to remind you that the data contained in this website is not necessarily real-time nor accurate. The data and prices on the website are not necessarily provided by any market or exchange, but may be provided by market makers, and so prices may not be accurate and may differ from the actual price at any given market, meaning prices are indicative and not appropriate for trading purposes. Fusion Media and any provider of the data contained in this website will not accept liability for any loss or damage as a result of your trading, or your reliance on the information contained within this website.
It is prohibited to use, store, reproduce, display, modify, transmit or distribute the data contained in this website without the explicit prior written permission of Fusion Media and/or the data provider. All intellectual property rights are reserved by the providers and/or the exchange providing the data contained in this website.
Fusion Media may be compensated by the advertisers that appear on the website, based on your interaction with the advertisements or advertisers.
© 2007-2024 - Fusion Media Limited. All Rights Reserved.