The long-term cycle of the stock market has a period of approximately 48 months. Prior to the market crash in 2008, long-term cycle lows (LTCLs) occurred as expected about every four years. However, extreme market events such as a crash often result in time compression, causing cycles to be shorter than normal. The 2008 crash was no exception and the last LTCL in early 2009 formed only three years after the previous low.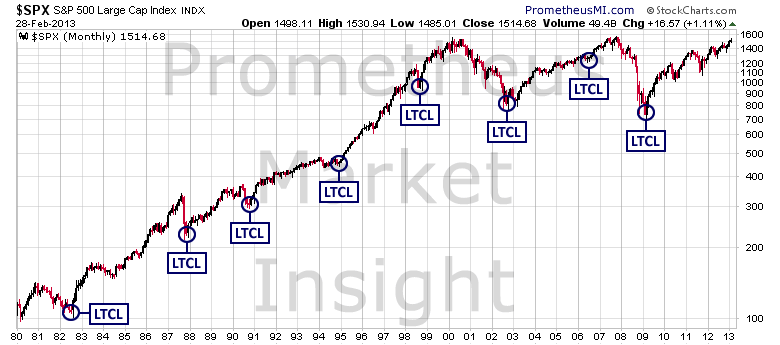
The cyclical bull market that began at the last LTCL is now four years old, a duration that is much longer than the typical cyclical uptrend that occurs during a secular downtrend. Therefore, the latest cyclical top is long overdue and it could form at any time.
The violent advance off of the 2009 low has been fueled in large part by a historic amount of government intervention as the Federal Reserve has sought to inflate risk assets such as stocks by driving investors away from safety. However, the massive injection of liquidity during the last few years has created proportionally massive market imbalances, and, unless one subscribes to the notorious “this time is different” philosophy, hundreds of years of market history suggest that the inevitable corrective move of the next cyclical bear market will also have a violent, extreme character.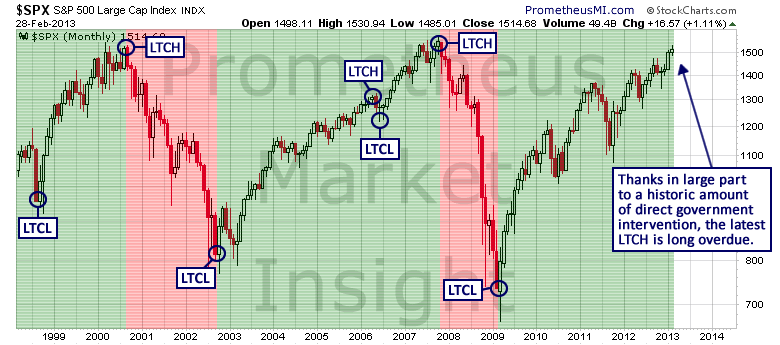
Of course, when an advance becomes this speculative in nature, the move can remain overbought for an extended period and predicting the timing of the inevitable turn with a high degree of statistical confidence is difficult. However, the judicious application of chart analysis enables us to identify conditions that favor the development of a cyclical top. For example, the current intermediate-term cycle from November has struggled to advance during the last four weeks and a cycle high setup has been in effect since last week, indicating that the latest intermediate-term cycle high (ITCH) may have formed in late February.
This would be an important development because, given the extremely long duration of the current cyclical bull market, any confirmed intermediate-term high is also a potential cyclical high.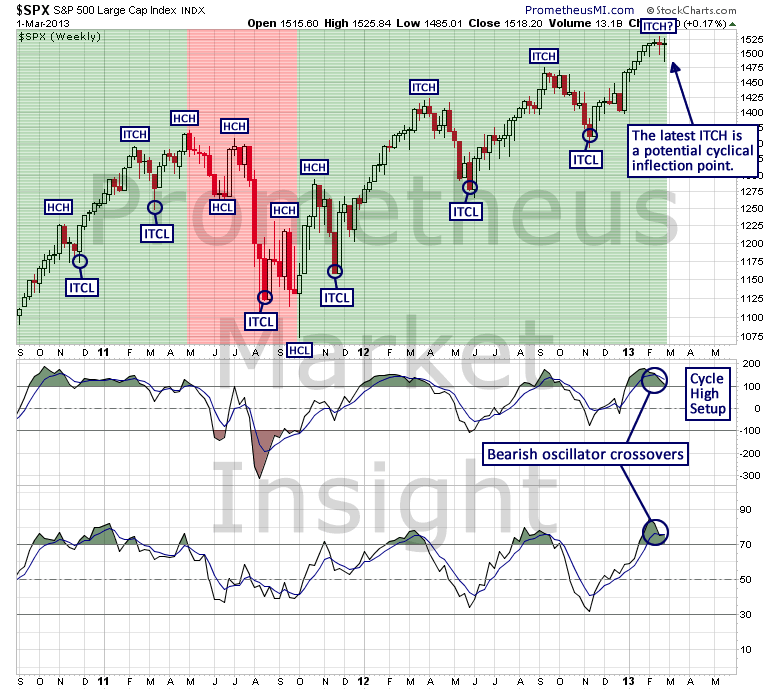
Regardless of when the latest ITCH develops, the short-term view suggests that we are on the verge of a substantial correction. Moves that occur in the direction of the primary trend, which in this case is up, often take the form of a five-phase wave. The advance off of the low in November is a typical example of this type of move and the fifth and final phase is likely in progress. Therefore, the short-term uptrend will likely terminate at either the alpha high (AH) or the beta high (BH) of the short-term cycle that began last week.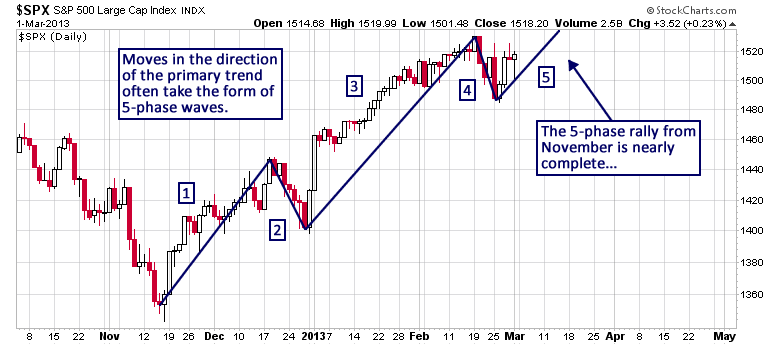
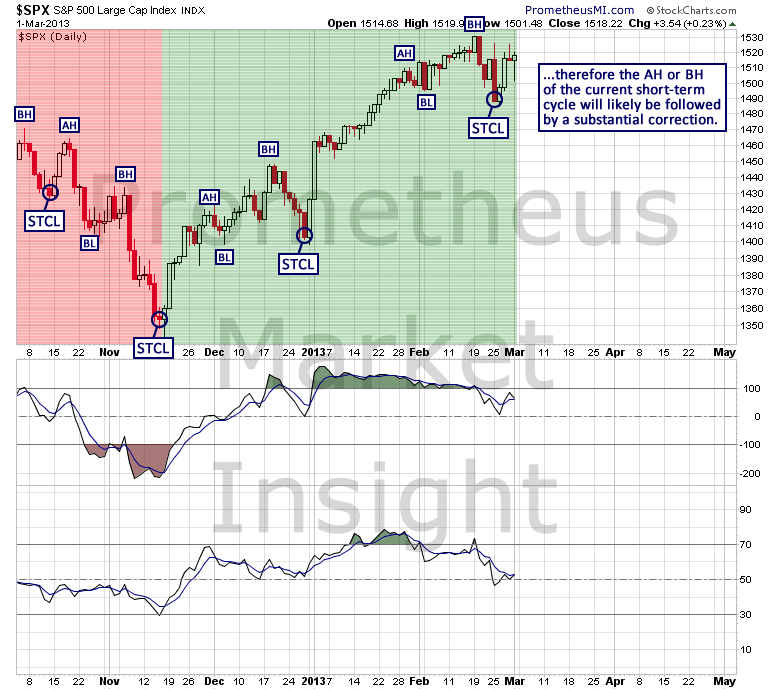
It is the character of the forthcoming correction that will provide the next assessment of bull market health and determine if the latest ITCH is also a likely cyclical top. Therefore, it will be important to carefully monitor market behavior during the next several weeks.
- English (UK)
- English (India)
- English (Canada)
- English (Australia)
- English (South Africa)
- English (Philippines)
- English (Nigeria)
- Deutsch
- Español (España)
- Español (México)
- Français
- Italiano
- Nederlands
- Português (Portugal)
- Polski
- Português (Brasil)
- Русский
- Türkçe
- العربية
- Ελληνικά
- Svenska
- Suomi
- עברית
- 日本語
- 한국어
- 简体中文
- 繁體中文
- Bahasa Indonesia
- Bahasa Melayu
- ไทย
- Tiếng Việt
- हिंदी
The Next Cyclical Bear In Stocks
Published 03/04/2013, 12:17 AM
Updated 07/09/2023, 06:31 AM
The Next Cyclical Bear In Stocks
Latest comments
Install Our App
Risk Disclosure: Trading in financial instruments and/or cryptocurrencies involves high risks including the risk of losing some, or all, of your investment amount, and may not be suitable for all investors. Prices of cryptocurrencies are extremely volatile and may be affected by external factors such as financial, regulatory or political events. Trading on margin increases the financial risks.
Before deciding to trade in financial instrument or cryptocurrencies you should be fully informed of the risks and costs associated with trading the financial markets, carefully consider your investment objectives, level of experience, and risk appetite, and seek professional advice where needed.
Fusion Media would like to remind you that the data contained in this website is not necessarily real-time nor accurate. The data and prices on the website are not necessarily provided by any market or exchange, but may be provided by market makers, and so prices may not be accurate and may differ from the actual price at any given market, meaning prices are indicative and not appropriate for trading purposes. Fusion Media and any provider of the data contained in this website will not accept liability for any loss or damage as a result of your trading, or your reliance on the information contained within this website.
It is prohibited to use, store, reproduce, display, modify, transmit or distribute the data contained in this website without the explicit prior written permission of Fusion Media and/or the data provider. All intellectual property rights are reserved by the providers and/or the exchange providing the data contained in this website.
Fusion Media may be compensated by the advertisers that appear on the website, based on your interaction with the advertisements or advertisers.
© 2007-2024 - Fusion Media Limited. All Rights Reserved.
