Get 40% Off
🚨 Volatile Markets? Find Hidden Gems for Serious OutperformanceFind Stocks Now

The Naga Group Price Analysis

Published 12/21/2020, 02:50 AM
Updated 07/09/2023, 06:32 AM

The NAGA Group (DE:N4G) stock is in good shape; trading volume at a record level in current Q4, a new record level of transactions in November, and NAGA Pay launched with transaction volumes in the millions.

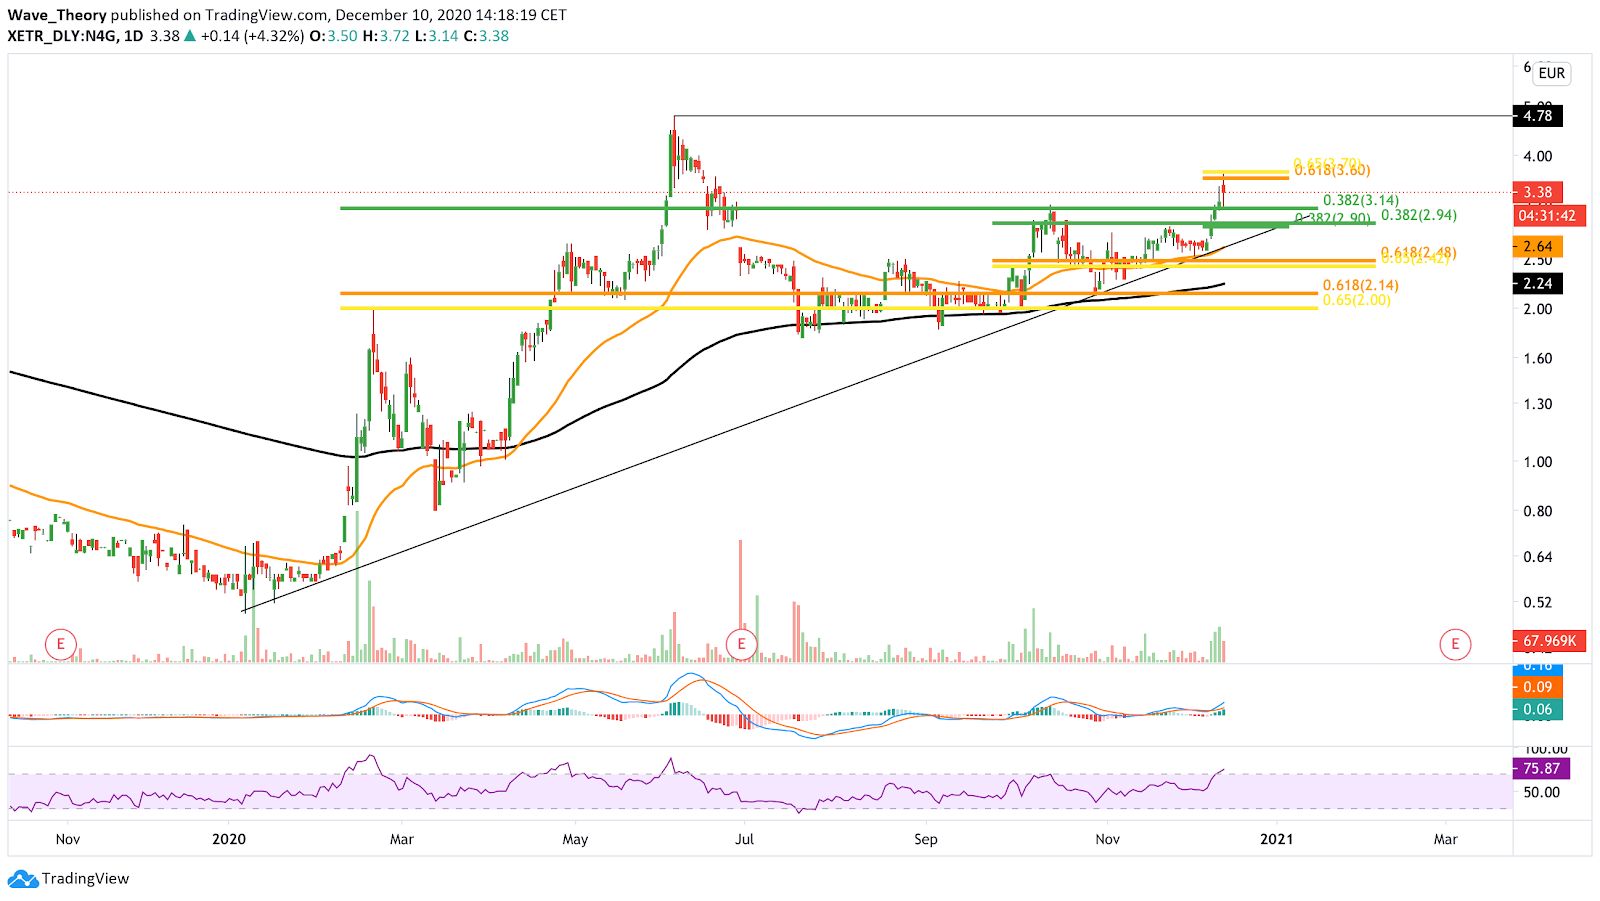
The Naga Group Daily Chart

After establishing a high in June 2020, the Naga stock retraced down to the golden ratio which is located slightly above the 200-day-ema at roughly $2.25. After arriving there, Naga could find support at this significant Fibonacci level and bounce towards the golden ratio resistance at $3.6, where the Naga stock seems to face rejection for the moment. 

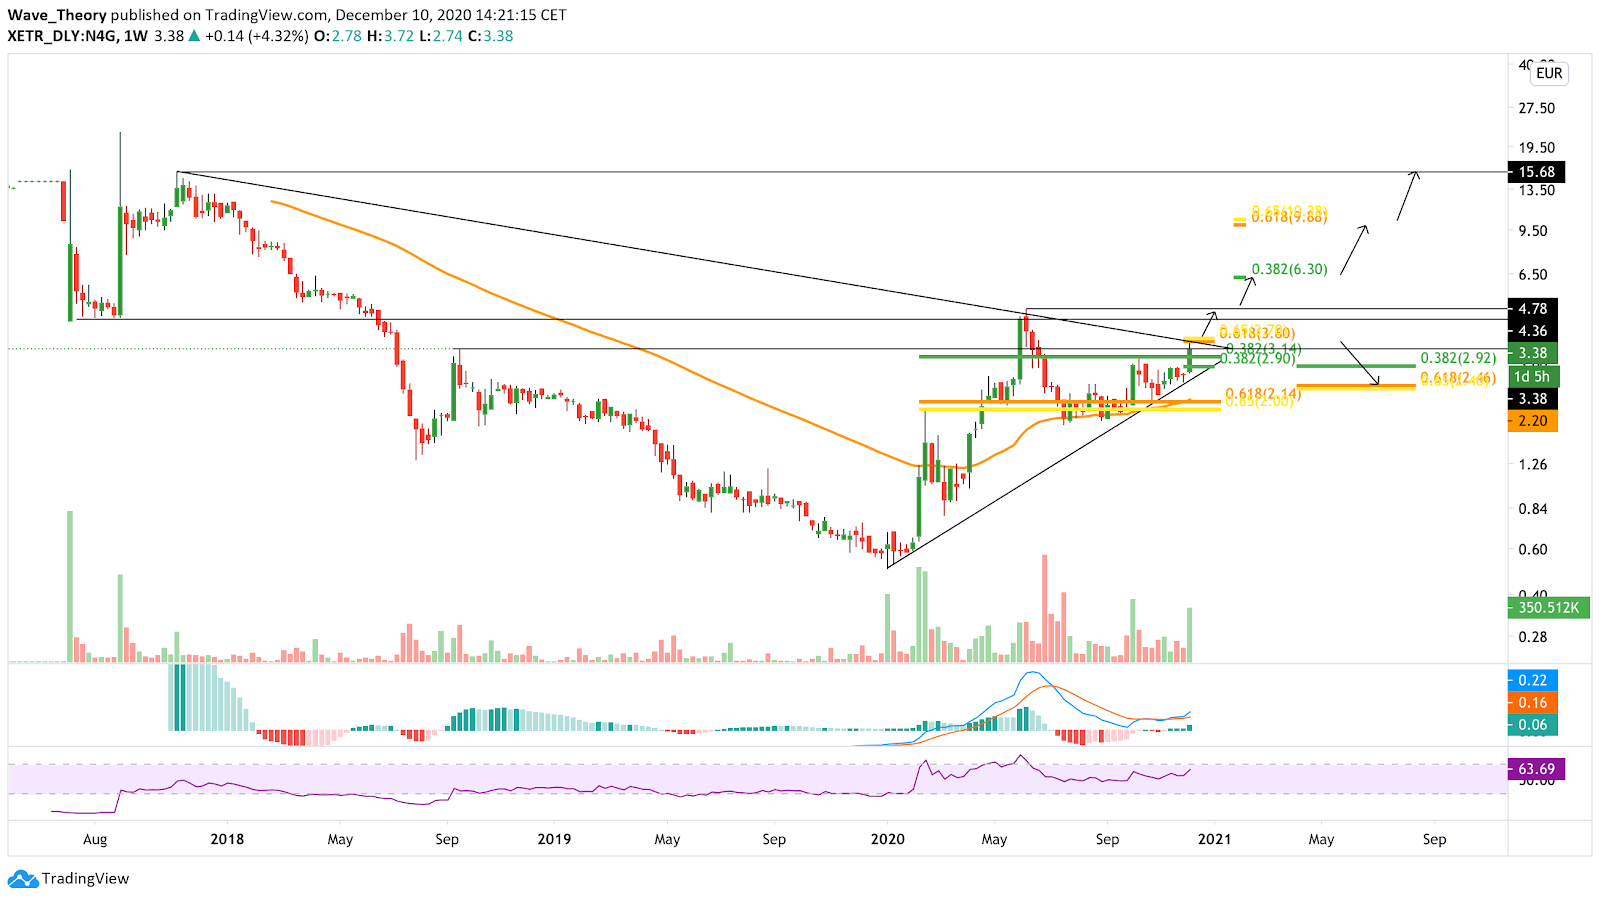
The Naga Group Weekly Chart


The $3.60 mark acts as a significant resistance level, as the downward trendline crosses this price level. Once it is bullishly broken, the Naga stock could surge to its next resistance between $4.36 - $4.78.

The MACD indicator hints towards a potential continuation of the upward movement. Thus, the naga stock could surge to $4.36 - $4.78, and once this level is bullishly broken, Naga could even surge to its next Fibonacci resistance at $6.30.

If we assume an ongoing upward trend, the Naga stock finds its next significant resistances at the golden ratio at the $10 mark and at the $15.5 price level.

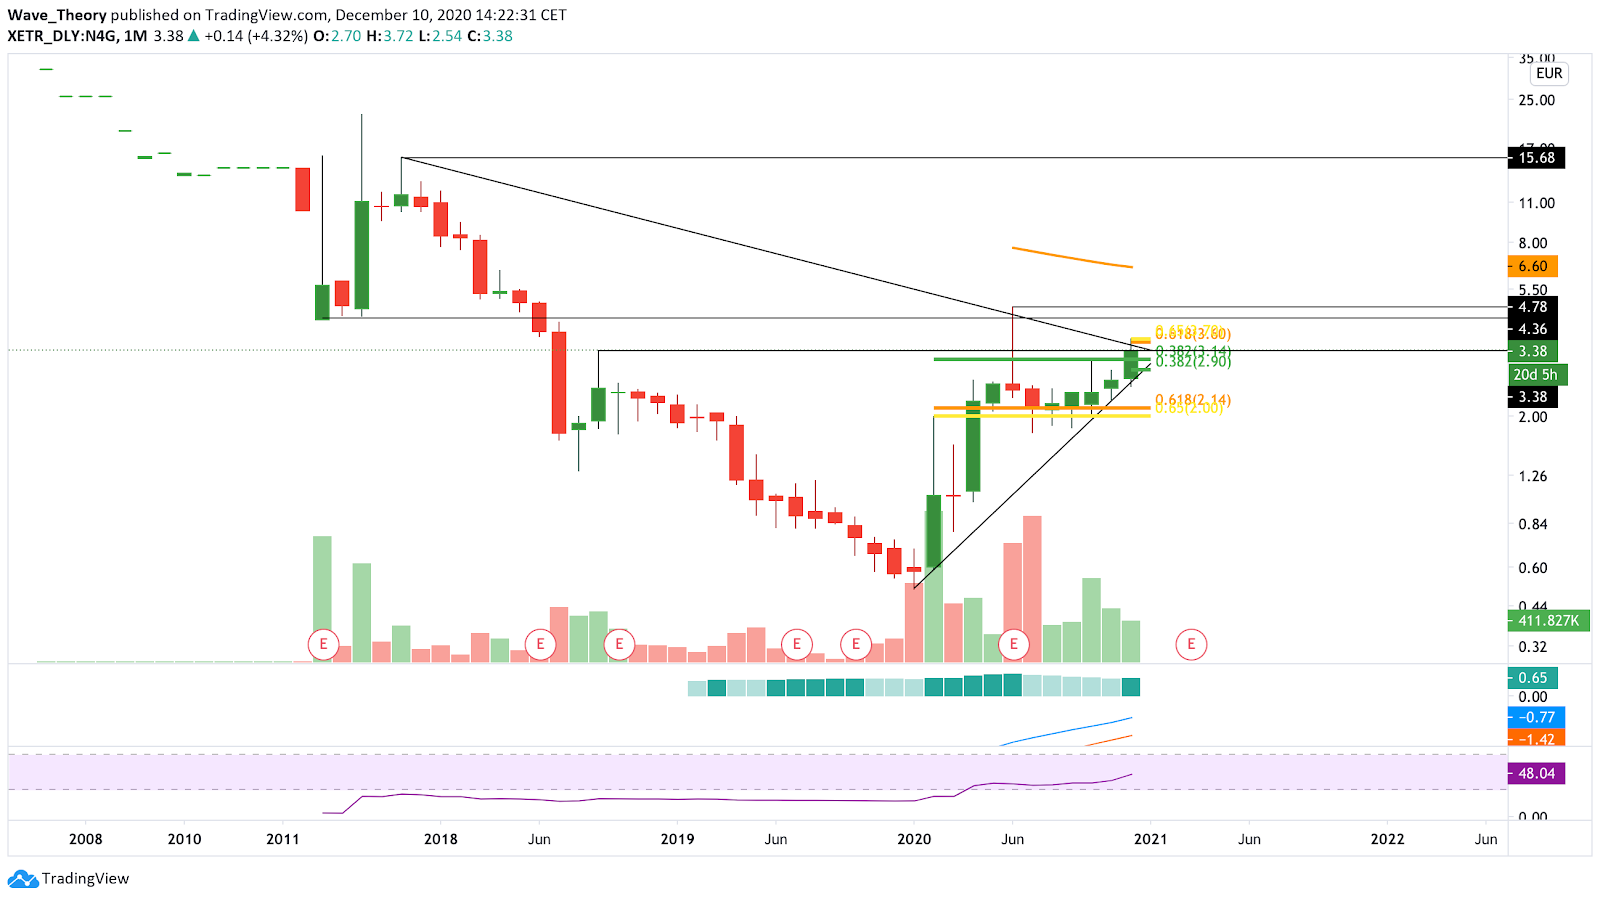
The Naga Group Monthly Chart

For now, the current development looks quite promising. Should Naga be able to break its current resistance at $3.6, it could surge to previous highs. In case of a sudden downturn, the Naga stock finds its next significant supports at the Fibonacci levels at roughly $2.5 and $2.15.

3rd party Ad. Not an offer or recommendation by Investing.com. See disclosure here or remove ads .

Latest comments

Risk Disclosure: Trading in financial instruments and/or cryptocurrencies involves high risks including the risk of losing some, or all, of your investment amount, and may not be suitable for all investors. Prices of cryptocurrencies are extremely volatile and may be affected by external factors such as financial, regulatory or political events. Trading on margin increases the financial risks.
Before deciding to trade in financial instrument or cryptocurrencies you should be fully informed of the risks and costs associated with trading the financial markets, carefully consider your investment objectives, level of experience, and risk appetite, and seek professional advice where needed.
Fusion Media would like to remind you that the data contained in this website is not necessarily real-time nor accurate. The data and prices on the website are not necessarily provided by any market or exchange, but may be provided by market makers, and so prices may not be accurate and may differ from the actual price at any given market, meaning prices are indicative and not appropriate for trading purposes. Fusion Media and any provider of the data contained in this website will not accept liability for any loss or damage as a result of your trading, or your reliance on the information contained within this website.
It is prohibited to use, store, reproduce, display, modify, transmit or distribute the data contained in this website without the explicit prior written permission of Fusion Media and/or the data provider. All intellectual property rights are reserved by the providers and/or the exchange providing the data contained in this website.
Fusion Media may be compensated by the advertisers that appear on the website, based on your interaction with the advertisements or advertisers.
© 2007-2024 - Fusion Media Limited. All Rights Reserved.