2017 has been a year of setting records. We’ve seen a record level of low volatility, a record amount of time without a 5% decline in U.S. equities and what has to be a record amount of natural disasters taking place. One we can now add to that list comes from the technical analysis column of the ledger.
To go along with the running count of days without a large decline in the market, we’ve now had three consecutive weekly closes above the S&P 500 weekly Bollinger® Band. Bollinger Bands are often used to show two standard deviations above a chosen moving average, often 20 periods. For today’s post, I’m looking at weekly data so I am using a 20-week moving average.
Since 1950
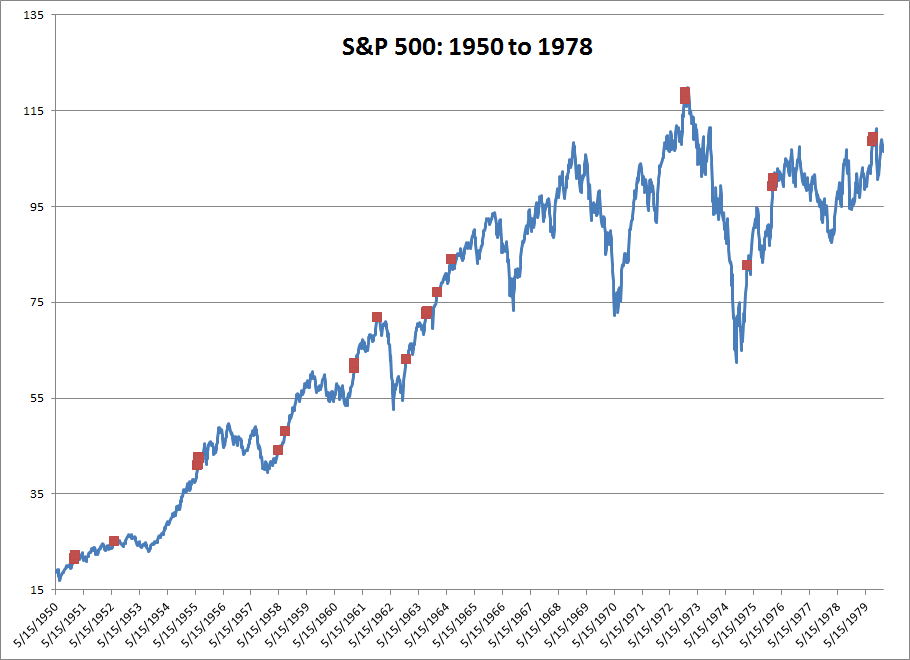
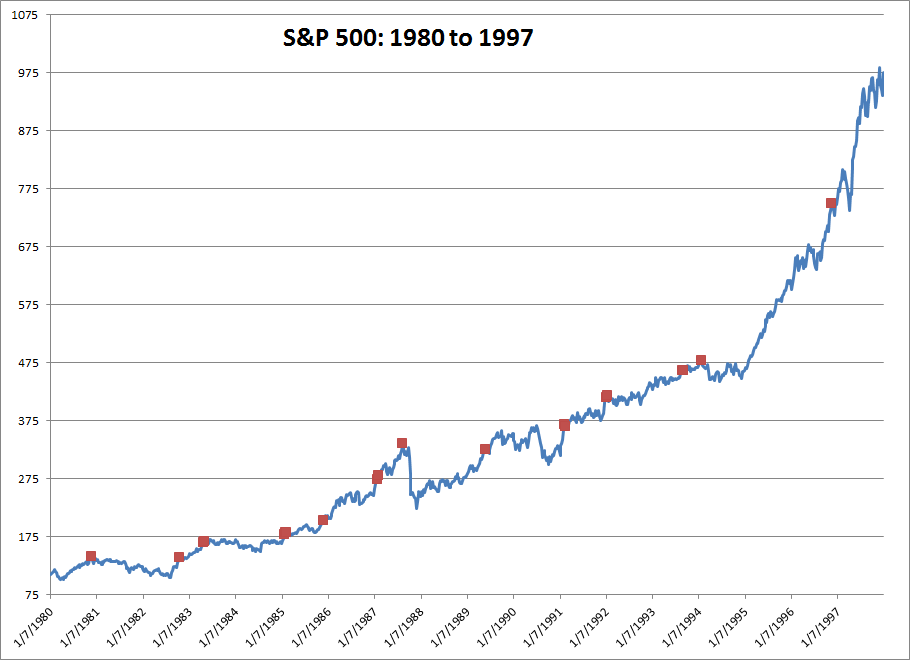
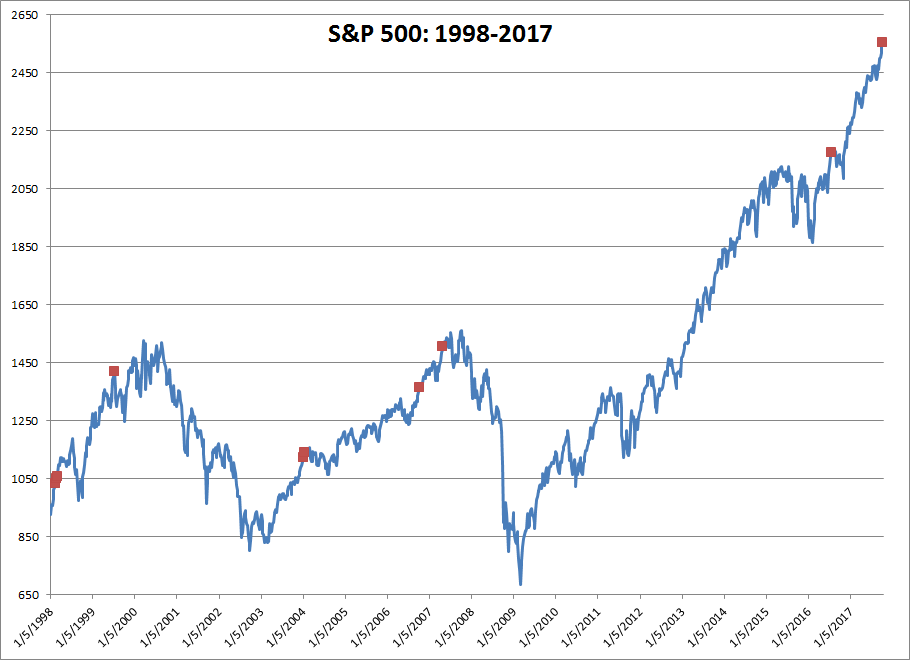
We last saw this occur in July of 2016 but we’d have to go to 2007 to find the next example. In fact, it’s something that’s only occurred less than 2% of the weeks since 1950. Now a sample size of 57 is rather small, especially when the data set goes this far back. This is not an overly bearish piece of data, while it did precede some interesting turning points in market history (i.e.: 1961, 1972, 1987, & 1999). Any of those stick out to you? Probably so.
As I mentioned, we last saw this occur in 2016, just before the only material decline that occurred in ’16 before U.S. equities picked themselves up, dusted themselves off and marched on to continue hitting new highs. So can consecutive weekly closes above the upper Bollinger Band lead to market weakness? Yes, we saw a 17% decline in ’61, we all know what happened in ’87, and we experienced a double-digit drop in ’99 after this occurred as well. However, many times the market either ignored this interesting piece of data, saw a short-term consolidation, or declined slightly and continued higher.
Red Dots
Here are three charts to show the past occurrences. The red dots show when the S&P 500 closed consecutively for three weeks more than 2 standard deviations above its 20-week Moving Average:
Bottom Line
If the resulting market performance is so mixed why am I sharing this? Because I’m fascinated anytime the market does something that is unique or rare. While it’s only happened 57 times in 67 years, some of the dates have been extremely important to financial history! That to me is very interesting.


