The Market Breaks
Over the last few weeks, I have been tracking the markets' ongoing consolidation process. As I noted on Tuesday:
“The breakdown on Monday has not yet completely broken the ‘bullish case’ for the market yet, however, a failed rally from current levels will bring “Option 3” into focus.
With the recent failure at the previous resistance level, we can now adjust our consolidation process for the market.”
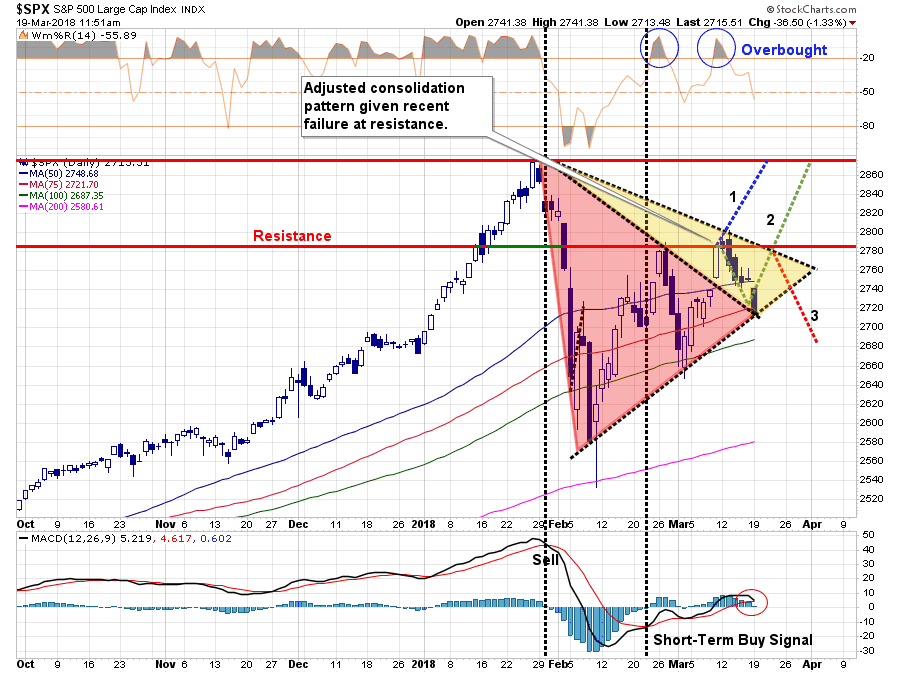
“As long as the pattern of ‘higher lows’ remains, a breakout above the current downtrend line and resistance should signal a move to old highs and the current 2018 target of 3000.
However, a break below the uptrend line will confirm a change to the current market and will require a shift in allocations to a more neutral stance.
We are potentially at a very critical juncture of this particular ‘bull market cycle,’ and as Doug Kass noted yesterday:
“I expect a 2018 trading range of 2200-2850 – with a ‘fair market value’ (based on higher interest rates, disappointing economic and corporate profit growth, political and geopolitical uncertainties) of approximately 2400.
Compared to the expected trading range, downside risk relative to upside reward is approximately 5x.
Against ‘fair market value’ (based on my probability distribution of a host of independent variables – interest rates, inflation, corporate profits, economic growth, valuations, etc.) downside risk relative to upside reward is about 3x.”
On Friday, the S&P 500's break to the downside occurred putting the bull market cycle at risk and “Option #3,” the least favorable path, has come into focus.
Interestingly, I received several comments on my predicted paths when I first laid them out 3-weeks ago:
- “Option 3 is TOO pessimistic. It will never happen.”
- “Why are you so bearish, this bull market is still running….”
- “You can’t predict the future, so why even try.”
You get the idea…but here is the important point:
“Analysis is not about trying to PREDICT future outcomes, but simply the ANALYSIS of ‘possibilities,’ (things that might happen,) versus ‘probabilities,’ (things that will likely happen.)”
Without understanding what the various outcomes “might be,” action can not be taken to reduce the risk of capital loss over time.
So, where are we now?
With the breakdown of the market to the 200-dma, the market is now at a much more critical “make or break” juncture. Here as some points to consider:
- The market triggered a short-term “sell signal” last week with a break of the 75-dma. (bearish)
- The market is “oversold” on a short-term basis which provides fuel for a reflexive bounce. (bullish)
- As I will discuss in a minute, the longer-term uptrend of the market remains intact. (bullish)
- Support held, again, at the rising 200-dma on Friday. (bullish)
- The short-term downtrend of the market continues to gain strength. (bearish)
Considering all those factors, I begin to layout the “possible” paths the market could take from here. I quickly ran into the problem of there being “too many” potential paths the market could take to make a legible chart for discussion purposes. However, the bulk of the paths took some form of the three I have listed below.
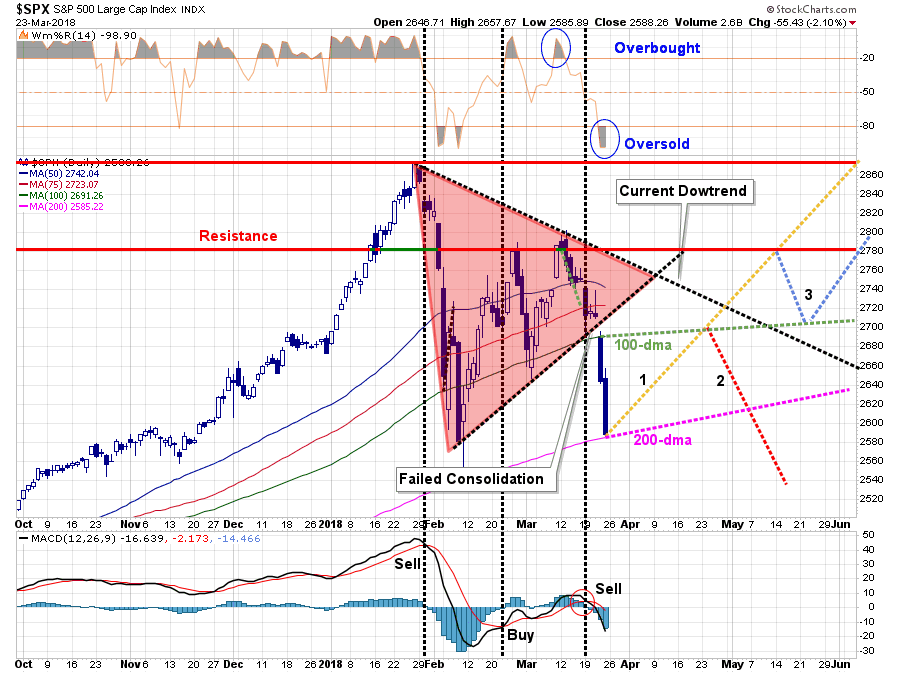
- Option 1: The market regains its bullish underpinnings, the correction concludes and the next leg of the current bull market cycle continues. It will not be a straight line higher of course, but the overall trajectory will be a pattern of rising bottoms as upper resistance levels are met and breached. (20%)
- Option 2: The market, given the current oversold condition, provides for a reflexive bounce to the 100-dma and fails. This is where the majority of the possible paths open up. (50%)
- The market fails at the 100-dma and then resumes the current path of decline violating the current bullish trend and officially starting the next bear market cycle. (40%)
- The market fails at the 100-dma but maintains support at the 200-dma and begins to build a base of support to move higher. (Option 1 or 3) (20%)
- The market fails at the 100-dma, finds support at the 200-dma, makes another rally attempt higher and then fails again resuming the current bearish path lower. (40%)
- Option 3: The market struggles higher to the previous “double top” set in February, retraces back to the 100-dma and then moves higher. (30%)
IMPORTANT NOTE: Regardless, of any potential outcome from Friday’s close, ANY rally back to the 100-dma should be used to reduce equity holdings in portfolios. The triggering of coincident “sell signals” and the breach of the consolidation process has reduced equity holdings in the model by 25% which is the first reduction since late 2015.
Has The Bull Market Ended?
Why am I giving Option #2 above the most weight? It is the most “bearish” of the three potential outcomes.
As I was laying out all of the possible pathways, the majority of the analysis continues to suggest the most likely path currently is lower. The supportive backdrop for asset prices continues to wane:
- The ongoing rhetoric from Washington over “trade wars” combined with complete fiscal irresponsibility,
- The reduction in support from Central Banks in terms of liquidity support.
- The continued insistence of the Fed to hike rates which continues to reduce the “low rate supports higher valuations” argument.
- The risk of further contagion from Facebook (NASDAQ:FB) and other “big data” companies on the technology sector (which comprises roughly 25% of the S&P 500) as global threats of “internet taxes” or other data collection policies are considered.
- Revenue growth continues to remain week which is leading to downward revisions in earnings estimates.
- Both domestic and international economic growth has peaked.
- Inflationary pressures from wage growth remains non-existent while the cost of living continues to rise (this will be exacerbated by Trump’s “trade wars.”)
- The yield curve continues to deteriorate and LIBOR has blown out which have typically been early warning sides of bad outcomes.
I can go on (valuations, fundamentals, etc.) but you get the idea. There is little evidence to support the “bullish case” other than “sentiment based” data which can, and does, change very rapidly.
But even with that said – the current ongoing “bull market” that began in 2016 has NOT ended…yet.
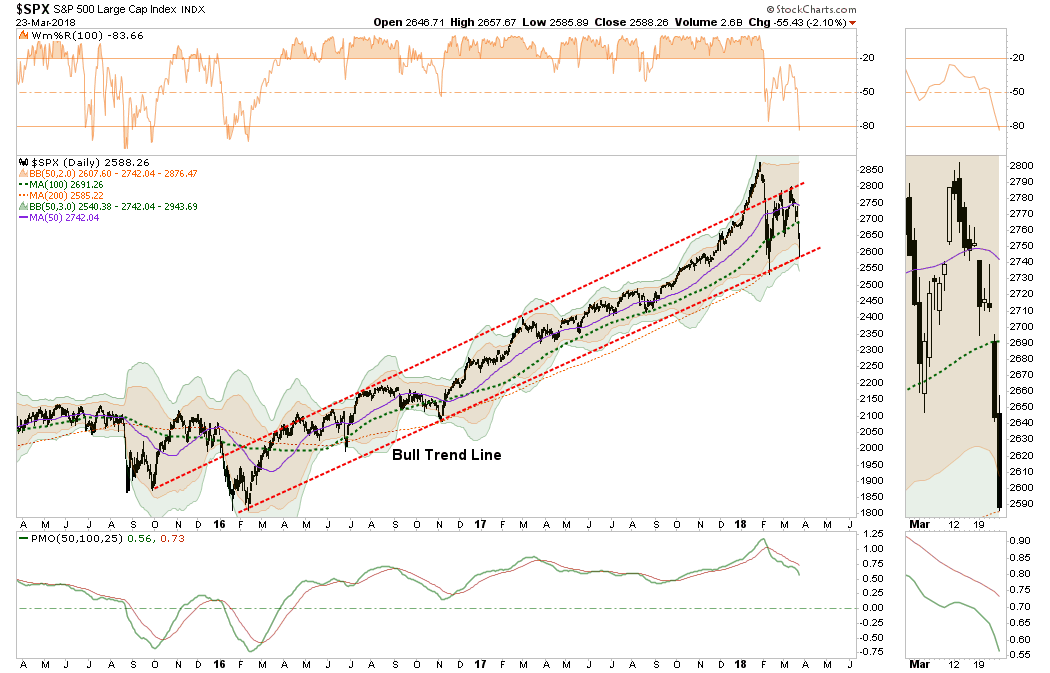
With the market 2-standard deviations oversold with a test of the 200-dma in progress, on a short-term basis a “reversion to the mean” HAS occurred.
If, and this is a big “if,” the market can maintain support at the 200-dma, and the upward trending “bullish trend” line, then Option #1 and #3 above remain viable outcomes.
However, if we step out to a “weekly” basis on our analysis, a much more “bearish” backdrop is currently emerging which is why I am giving more weight to Option #2 above.
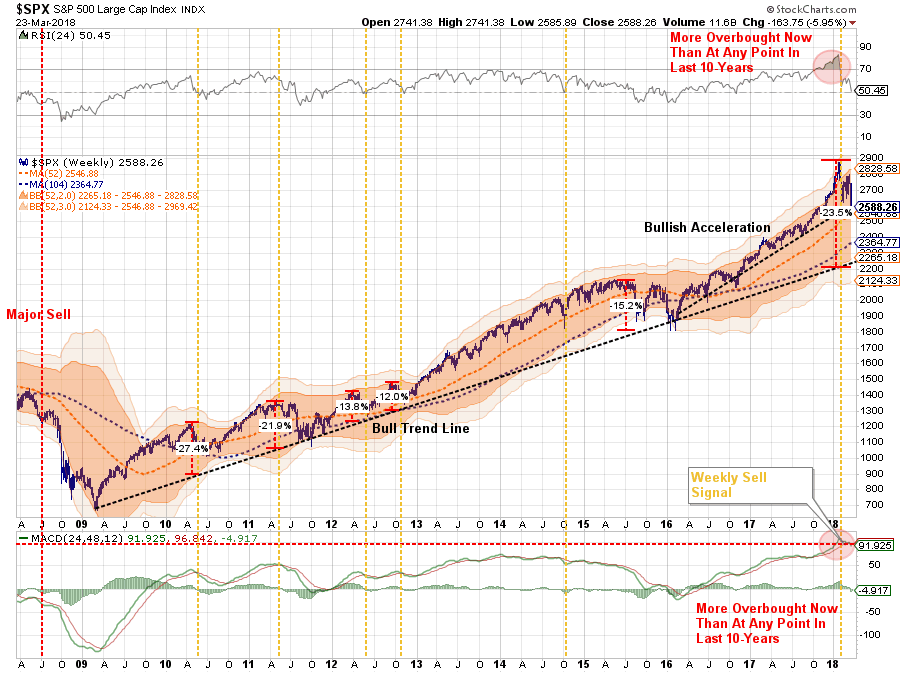
While even on a longer-term basis a correction back to the bullish trend line that began in 2009 would not negate the current bull market, the destruction of capital back to that level will wipe out almost 2-years of gains.
In other words, while the “bull market” may not have ended, for most investors it will “feel” like it has and the destructive consequences to financial plans will be just as bad.
Note above the gold “vertical” lines which are weekly “sell” signals as we have now. Each occurred with a correction back to the long-term trend or worse.
This is more clearly shown in the WEEKLY chart below.
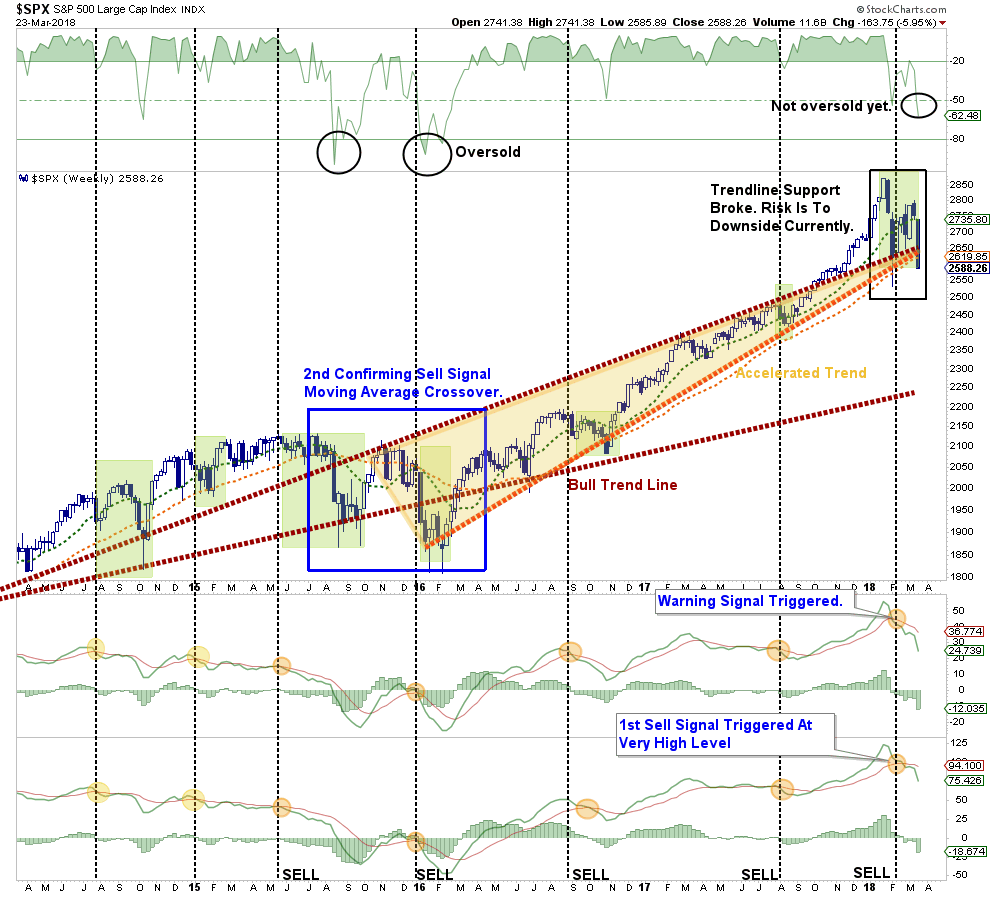
The confirmed “weekly” sell signals, as we have been discussing over the last few weeks, have been warning of a deeper correction. With the market violating accelerated bullish trend line last week, the lower bullish trend line from 2009 comes into focus. Currently, that trend line resides at 2250 which would equate to the roughly 24% decline from the recent peak shown in the longer-term chart above.
However, there is a “risk” of an even bigger corrective process. I have extrapolated the chart above back to 1990 on a MONTHLY basis to smooth out data volatility. As you will see, when “buy signals” have been triggered at very high levels, last seen in 2016, it was indicative of a late stage “blow off” rally for the market.
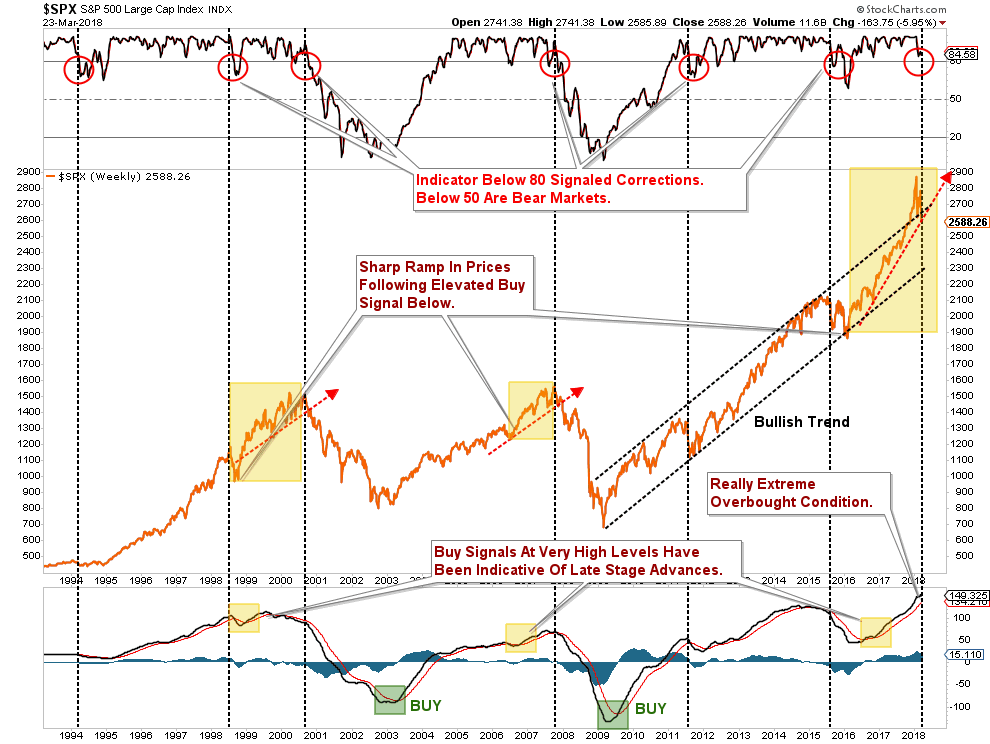
With the market currently overextended, overbought, and overvalued against a backdrop of negative underpinnings, the longer-term bearish case should not be ignored.
There are numerous “alarms” going off currently.
It is absolutely possible, these alarms are “false” and could be quickly reversed given the right stimulus. However, there is substantially higher possibility currently that “where there is smoke, there is fire.”
Has the “bull market” ended?
Not yet.
But if you wait to see it in the “rear view mirror,” it won’t really make much difference.
Portfolio Management Rules
As I noted above, the market is 2-standard deviations oversold and testing the 200-dma on a very short-term basis. This is not surprising, as by the time “sell signals” are triggered on a weekly basis, the market is generally “oversold” enough to elicit a “reflexive” bounce.
With confirmed “sell signals” in place, it is time for investors to rethink levels of risk exposure in their portfolios currently.
Over last few weeks, we have repeatedly suggested investors reduce and rebalance portfolio exposures. With the “sell signals” confirmed we will now lower the model weightings for equities by 25% and increase cash levels until the signals reverse.
If you have taken “no actions,” up to this point, the following guide can be used when a “reflexive bounce” occurs. Importantly, let me restate, the market is oversold enough for a bounce so don’t “panic sell,” but rather use the “bounce” to “sell into strength.”
Here are some guidelines to think about.
Step 1) Clean Up Your Portfolio
- Tighten up stop-loss levels to current support levels for each position.
- Take profits in positions that have been big winners (Technology)
- Sell laggards and losers
- Raise cash and rebalance portfolios to target weightings.
Step 2) Compare Your Portfolio Allocation To Your Model Allocation.
- Determine areas where exposure needs to be increased or decreased (bonds, cash, equities)
- Determine how many shares need to be bought or sold to rebalance allocation requirements.
- Determine cash requirements for hedging purposes
- Re-examine portfolio to rebalance allocations to adjust for relevant market risk.
- Determine exit price levels for each position needing to be sold on a forthcoming rally.
- Determine “stop loss” levels for each position being maintained.
- Determine “sell/profit taking” levels for each position.
(Note: the primary rule of investing that should NEVER be broken is: “Never invest money without knowing where you are going to sell if you are wrong, and if you are right.”)
Step 3) Have positions ready to execute accordingly given the proper market set up.
In this case, we are looking for a failed rally to the 100-dma to sell equity holdings into and raise further cash levels. We will also add further market hedges on a rally that fails at resistance.
Stay alert…I have a sneaky suspicion we are not out of the woods just yet.
Have a great week.
Market and Sector Analysis
Data Analysis Of The Market & Sectors For Traders
S&P 500 Tear Sheet
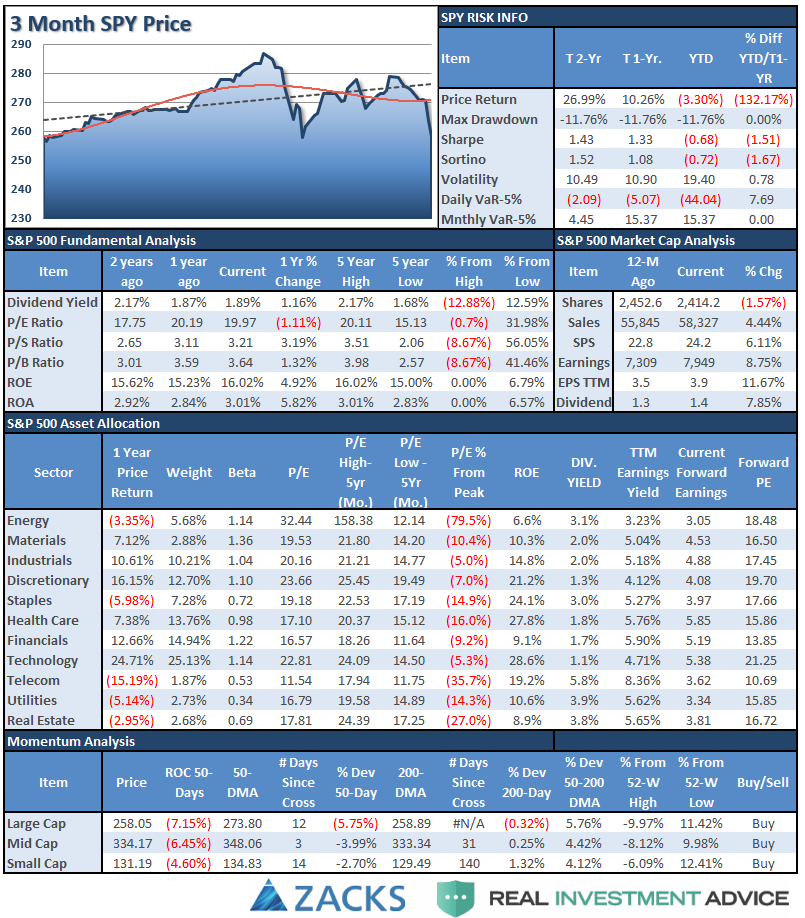
Performance Analysis
ETF Model Relative Performance Analysis
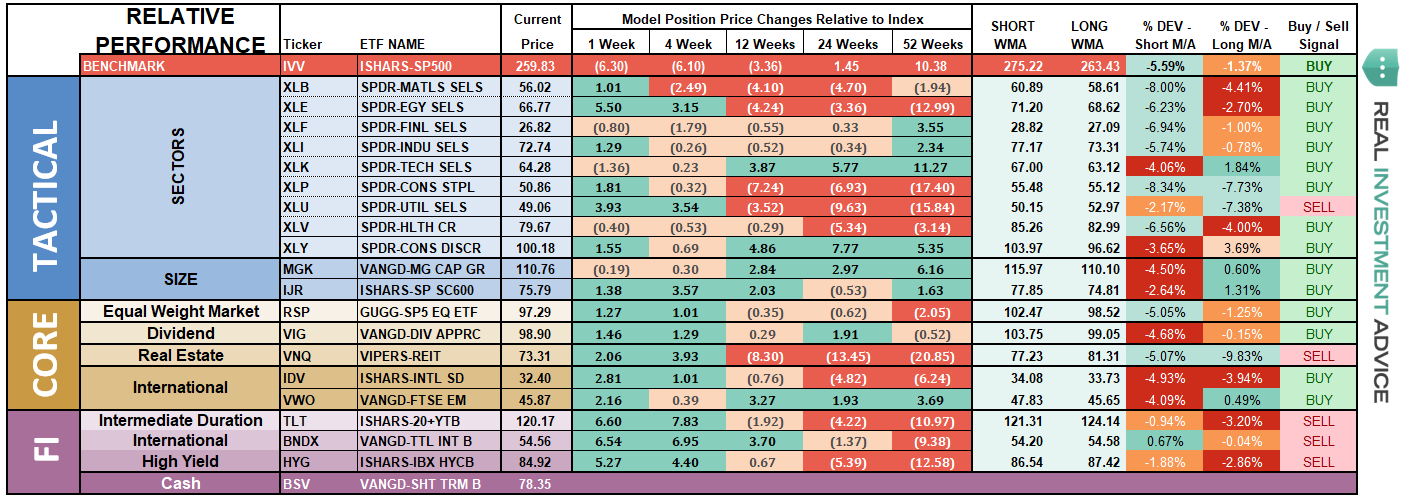
Sector and Market Analysis:
With the “sell signal” firmly in place on a short-term basis, the selling pressure has continued to press prices lower over the past week. As I noted last week:
“The market needs to gain some solid footing next week, or weakness could become more pervasive.”
Such, turned out to be case. Let’s review the major market sectors.
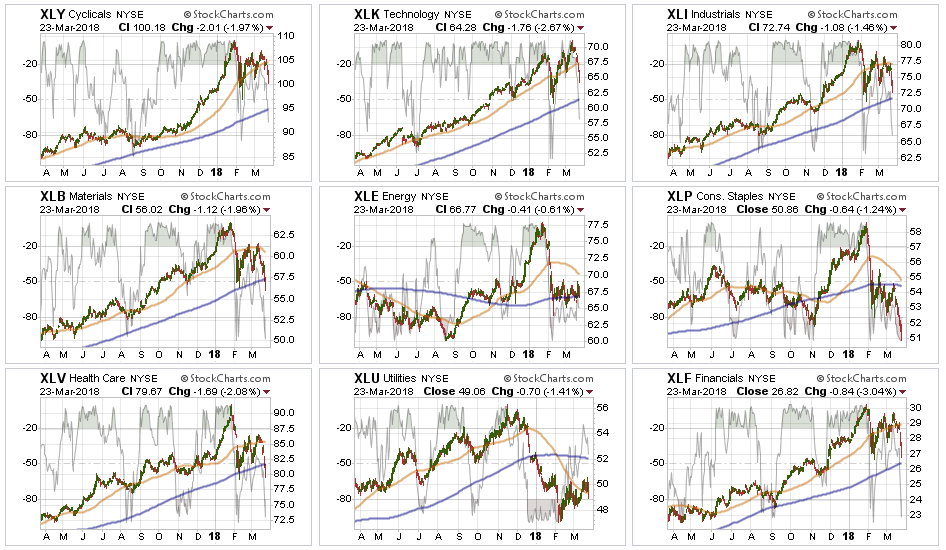
Discretionary, Technology, Industrials, and Financials after a brief rally attempt, all of these sectors broke back down through their respective 50-dma’s. The recent “breakout” of Technology, turned out to be a massive ‘head fake,” and is currently threatening to break below its bullish trend. Each of these sectors do remain in their bullish trend, but are NOT oversold currently which provides enough room for a test of their respective 200-dma’s over the next couple of weeks. Take profits and reduce weightings accordingly.
Health Care, Materials, and Energy – we were stopped out of our small additional Energy trade with the previous break below the 200-dma, and continue to recommend under-weighting the sector for now. The push higher in oil prices is likely not sustainable and energy stock prices are likely reflecting the same. We also closed out our Materials and Industrials trade on “tariff” risks. Health Care has now also broken the 200-dma suggesting reducing weights there as well.
Staples– our stop level was triggered on Staples last week and we will be eliminating exposure to the sector on a rally. Utilities have continued to under-perform in recent weeks, but has been improving as of late with a break back above the 50-dma. We are not recommending adding to the position yet, but we are watching to see what happens next. Stops are set at recent lows.
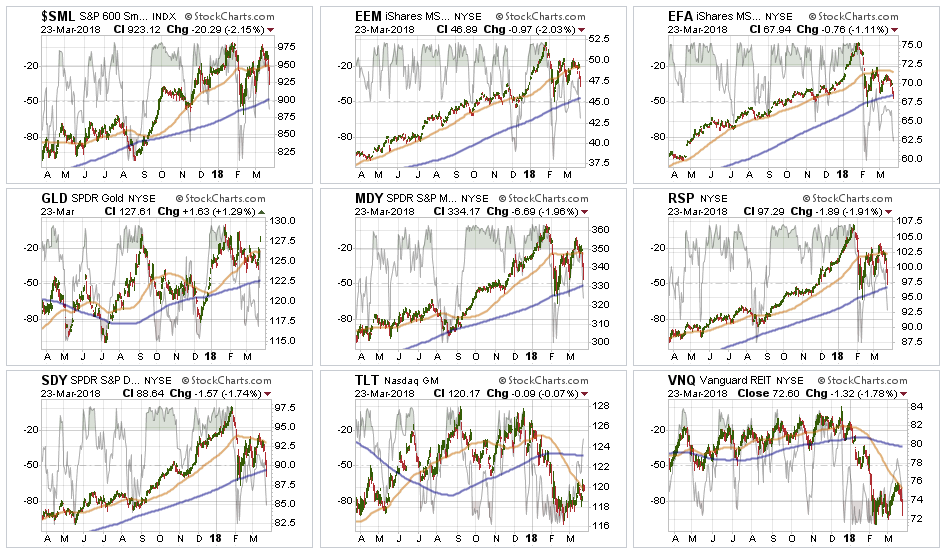
Small Cap, Mid Cap, Emerging Markets, Equal Weight, and Dividend indices all broke back through their 50-dma last week with Dividend stocks breaking the 200-dma. Two weeks ago, we removed international and emerging market exposure due to the likely impact to economic growth from “tariffs” on those markets. That reduction helped hedge risk this past week.
Gold continues its volatile back-and-forth trade but remains confined to a downtrend currently. We currently do not have exposure to gold, but if you are already long the metal, we previously recommended that while the backdrop overall remains bullish, the correctional phase continues so taking profits on rallies remains prudent.
Bonds and REITs over the last couple of weeks, these two sectors looked to have bottomed and initiated early “buy” signals. Hold positions for now as interest rates have started to recognize the economic weakness that has shown up in the data as of late.
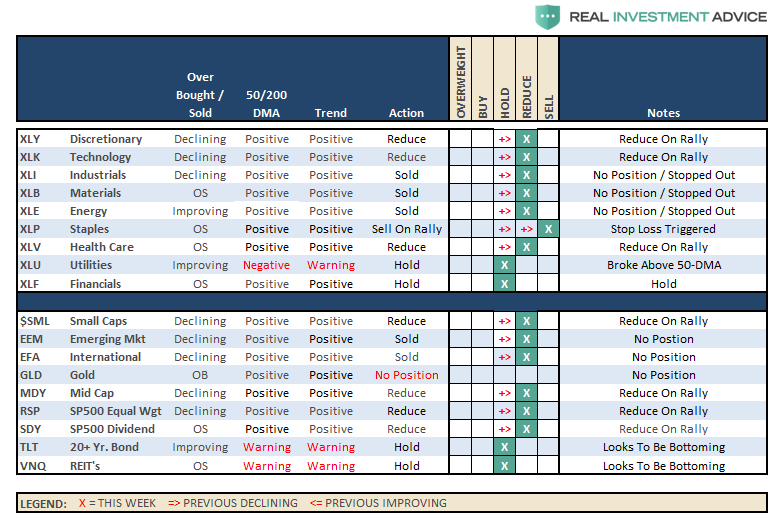
Sector Recommendations:
The table below shows thoughts on specific actions related to the current market environment.
(These are not recommendations or solicitations to take any action. This is for informational purposes only related to market extremes and contrarian positioning within portfolios. Use at your own risk and peril.)
Portfolio Update:
Last week I wrote:
“We continue to monitor the markets carefully as risk has clearly risen since February. However, with the bullish trend clearly intact, we don’t want to be overly cautious. While the level of investor optimism is high, and more indicative of turning points in the market, such does not mean it will happen immediately. With the weakness that prevailed last week, a rally early next week off of the 50-dma will not be surprising.”
With a brief rally early in the week, the Trump Administration push of “tariffs” was more than the market could bear. The break down at the end of the week has pushed the market to a short-term, oversold condition, and is testing support at the 200-dma.
It is crucially important the market maintains support at current levels and musters a rally next week. After having reduced exposure to “tariff” related areas a couple of weeks ago (materials, emerging and international markets), we will use any rally in the next week or so to further reduce equity risk exposure in portfolios. We will also look to add additional hedges to the portfolio on any rally that fails at overhead resistance.
With portfolios already underweight equity and overweight cash, we will make further adjustments to allocations as longer-term risks have clearly risen. Furthermore, we remain keenly aware of the intermediate “sell signal“ which has now been “confirmed” by the recent market breakdown. We will take actions to further hedge risks and protect capital until those signals are reversed.
THE REAL 401k PLAN MANAGER
The Real 401k Plan Manager – A Conservative Strategy For Long-Term Investors
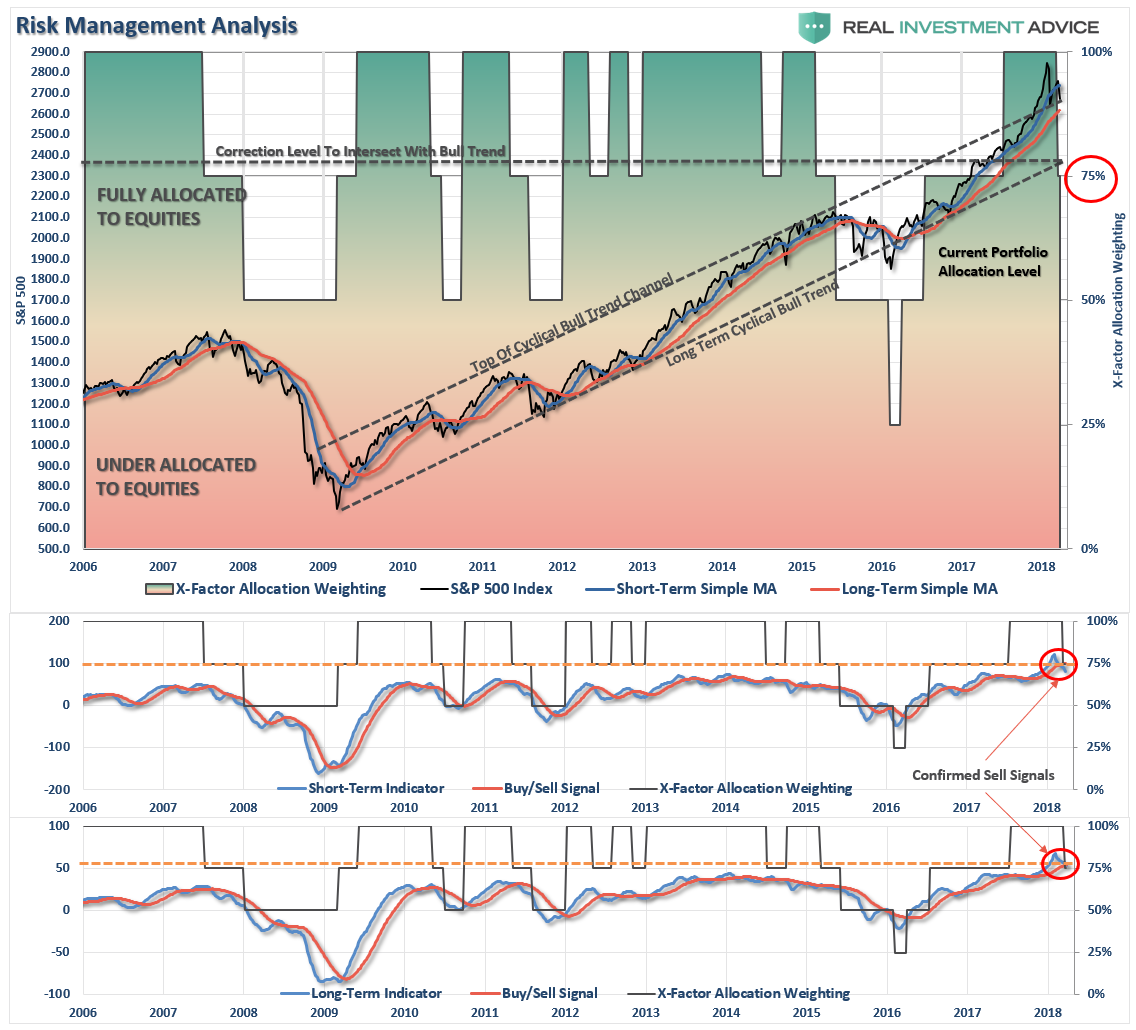
There are 4-steps to allocation changes based on 25% reduction increments. As noted in the chart above a 100% allocation level is equal to 60% stocks. I never advocate being 100% out of the market as it is far too difficult to reverse course when the market changes from a negative to a positive trend. Emotions keep us from taking the correct action.

Reducing Model Weightings
As I noted last week:
“While the bullish trend is intact, we are nearing the end of the seasonally strong time of year. Furthermore, the things happening in Washington are NOT beneficial for the economy or the markets. So pay attention – policy does matter.”
This week, the markets broke on several fronts which have triggered confirmed “sell signals” on several levels requiring a reduction to equity risk exposure. In accordance with the model adjustments above, begin reducing portfolio equity weighting by 25% on any failed rally attempts.
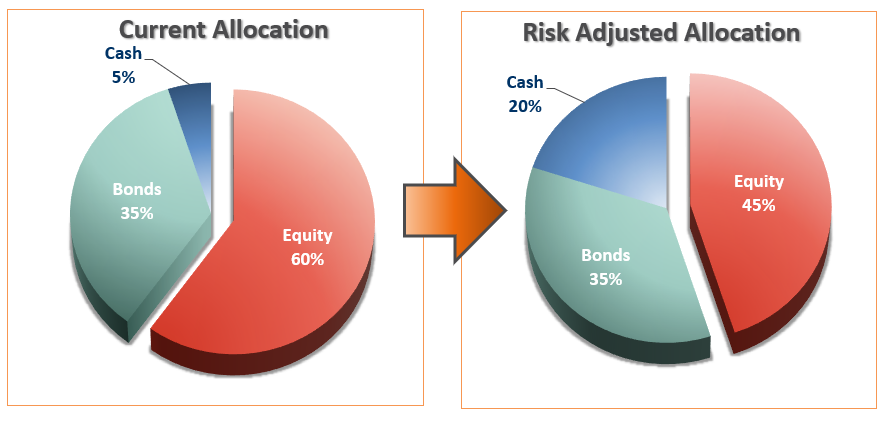
IMPORTANTLY – this does NOT mean go “sell” everything Monday morning. As noted above in the main analysis, we are slightly reducing equity exposure on a rally to hedge risks of a further decline until the current volatility phase passes.
Importantly, as always, portfolio management is about making SMALL adjustments as evidence presents itself and should never be perceived as an “all or nothing” issue.
The model below is just a “sample” allocation. Feel free to adjust the weights according to your own age, risk tolerance and goals.
Importantly, while the market remains “bullishly biased” in the short-term, the longer-term picture of increased volatility, low-forward returns and capital destruction risks still prevail. If you are near retirement, moderate your allocation accordingly to reduce the risk of loss.

