Get 40% Off
🚨 Volatile Markets? Find Hidden Gems for Serious OutperformanceFind Stocks Now

The Major Inflection Point For The SPX

Published 12/09/2018, 11:40 PM
Updated 07/09/2023, 06:31 AM

Further to my post of December 2, it's evident from the following daily charts of the four U.S. E-mini Futures Indices that they all broke and closed below both their "chaos zone" (the trio of future-offset 5, 8 & 13 MAs) and their 50 & 200 MAs, respectively, last week...a failure to hold above those major support levels.
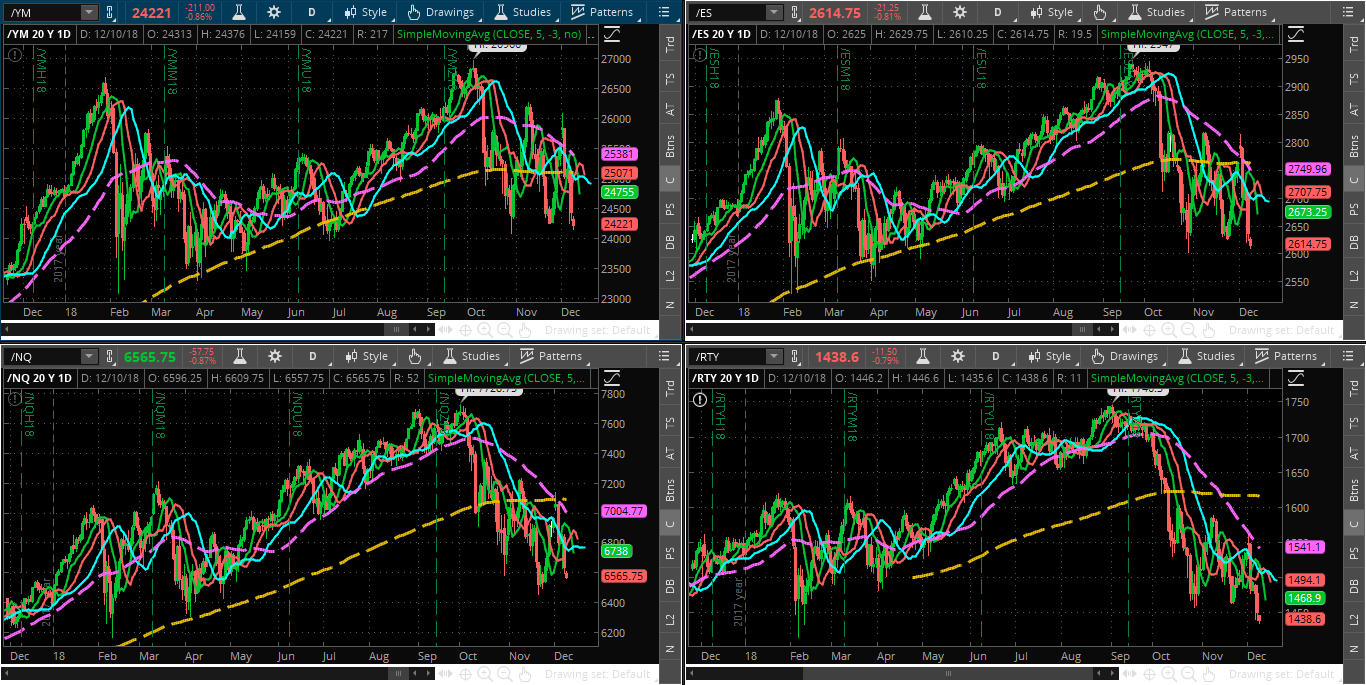
YM Chart

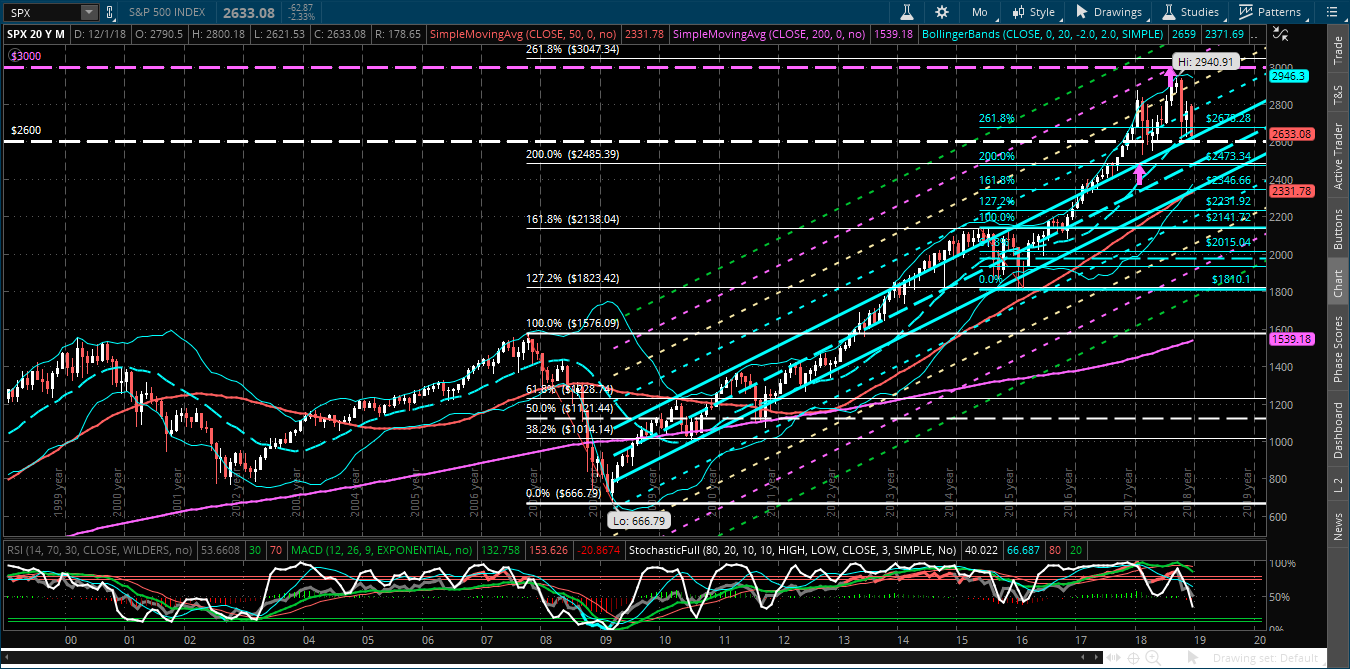
Price on the S&P 500 is currently hovering above 2600, as shown on the following monthly chart.

It's clearly a major inflection point for a couple of reasons...namely, it's a major price support level, and it's right along the upper edge (+1 standard deviation level) of a long-term regression channel from the lows of 2009.

As I stated in the above-mentioned post, the SPX is now in danger of dropping to its next major support level around 2400, as more fully illustrated in my post of August 6.

In fact, 2400 is...

  • slightly below a confluence of two external Fibonacci retracement levels around 2473 and 2485
  • just above the lower monthly Bollinger Band® at 2372
  • above a convergence of a -1 standard deviation level of the regression channel with a 161.8% external Fib level at 2347, and the 50-monthly moving average at 2332


Extreme weakness on accelerating downside momentum may just see price reach 2400, or lower, before, possibly, stabilizing.
SPX Chart

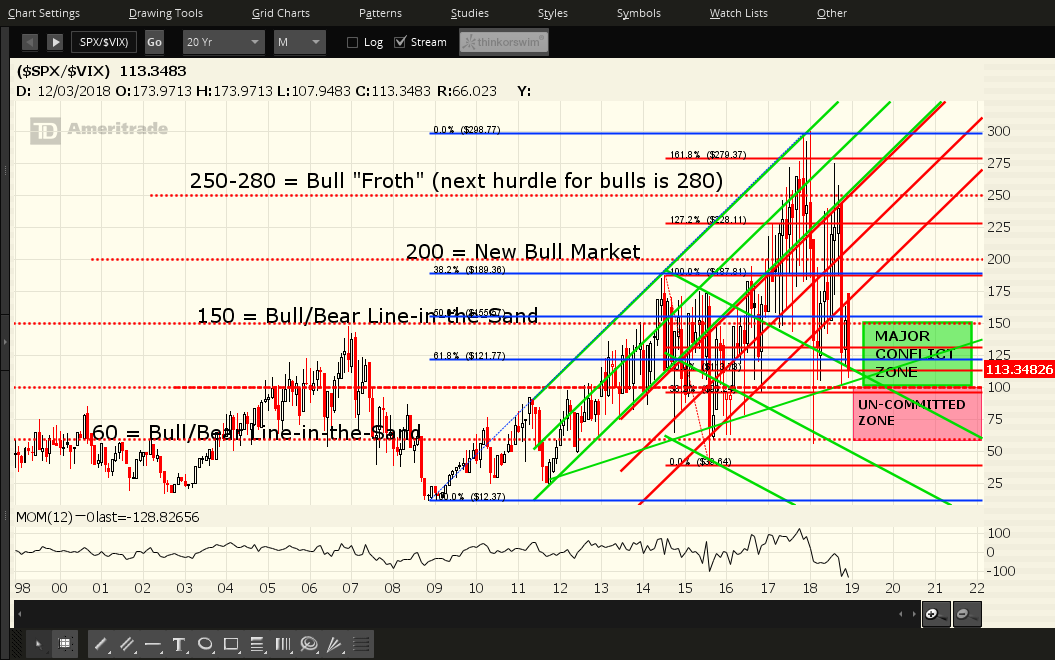
Furthermore, price on the SPX:VIX ratio is well below the Bull/Bear Line-in-the-Sand level and is approaching the 100 level, which represents an extremely volatile zone, as shown on the following monthly ratio chart.

3rd party Ad. Not an offer or recommendation by Investing.com. See disclosure here or remove ads .

The momentum indicator closed at its lowest historic reading on this timeframe last Friday, confirming that extreme volatility is already present in this ratio.

A drop and hold below the 100 level on the SPX:VIX ratio, together with a drop and hold below 2600 on the SPX could very well see the SPX drop to somewhere around 2400 in short order.
SPX-VIX Chart

Latest comments

Risk Disclosure: Trading in financial instruments and/or cryptocurrencies involves high risks including the risk of losing some, or all, of your investment amount, and may not be suitable for all investors. Prices of cryptocurrencies are extremely volatile and may be affected by external factors such as financial, regulatory or political events. Trading on margin increases the financial risks.
Before deciding to trade in financial instrument or cryptocurrencies you should be fully informed of the risks and costs associated with trading the financial markets, carefully consider your investment objectives, level of experience, and risk appetite, and seek professional advice where needed.
Fusion Media would like to remind you that the data contained in this website is not necessarily real-time nor accurate. The data and prices on the website are not necessarily provided by any market or exchange, but may be provided by market makers, and so prices may not be accurate and may differ from the actual price at any given market, meaning prices are indicative and not appropriate for trading purposes. Fusion Media and any provider of the data contained in this website will not accept liability for any loss or damage as a result of your trading, or your reliance on the information contained within this website.
It is prohibited to use, store, reproduce, display, modify, transmit or distribute the data contained in this website without the explicit prior written permission of Fusion Media and/or the data provider. All intellectual property rights are reserved by the providers and/or the exchange providing the data contained in this website.
Fusion Media may be compensated by the advertisers that appear on the website, based on your interaction with the advertisements or advertisers.
© 2007-2024 - Fusion Media Limited. All Rights Reserved.