Barring a breathtaking plunge, the bull market in U.S. stocks on Aug. 22 will become the longest in history, and optimistic investors argue it has miles to go before it rests. – Sue Chang, MarketWatch
Depending on how you measure beginnings and endings, or what constitutes a bear market or the beginning of a bull market, makes the statement a bit subjective. However, there is little argument the current bull market has had an exceptionally long life-span.
But rather than a “siren’s song” luring investors into the market, maybe it should serve as a warning.
Record levels” of anything are records for a reason.
It should be remembered that when records are broken that was the point where previous limits were reached. Also, just as in horse racing, sprinting or car races, the difference between an old record and a new one are often measured in fractions of a second.
Therefore, when a “record level” is reached it is NOT THE BEGINNING, but rather an indication of the PEAK of a cycle. Records, while they are often broken, are often only breached by a small amount, rather than a great stretch. While the media has focused on record low unemployment, record stock market levels, and record confidence as signs of an ongoing economic recovery, history suggests caution. For investors, everything is always at its best at the end of a cycle rather than the beginning.
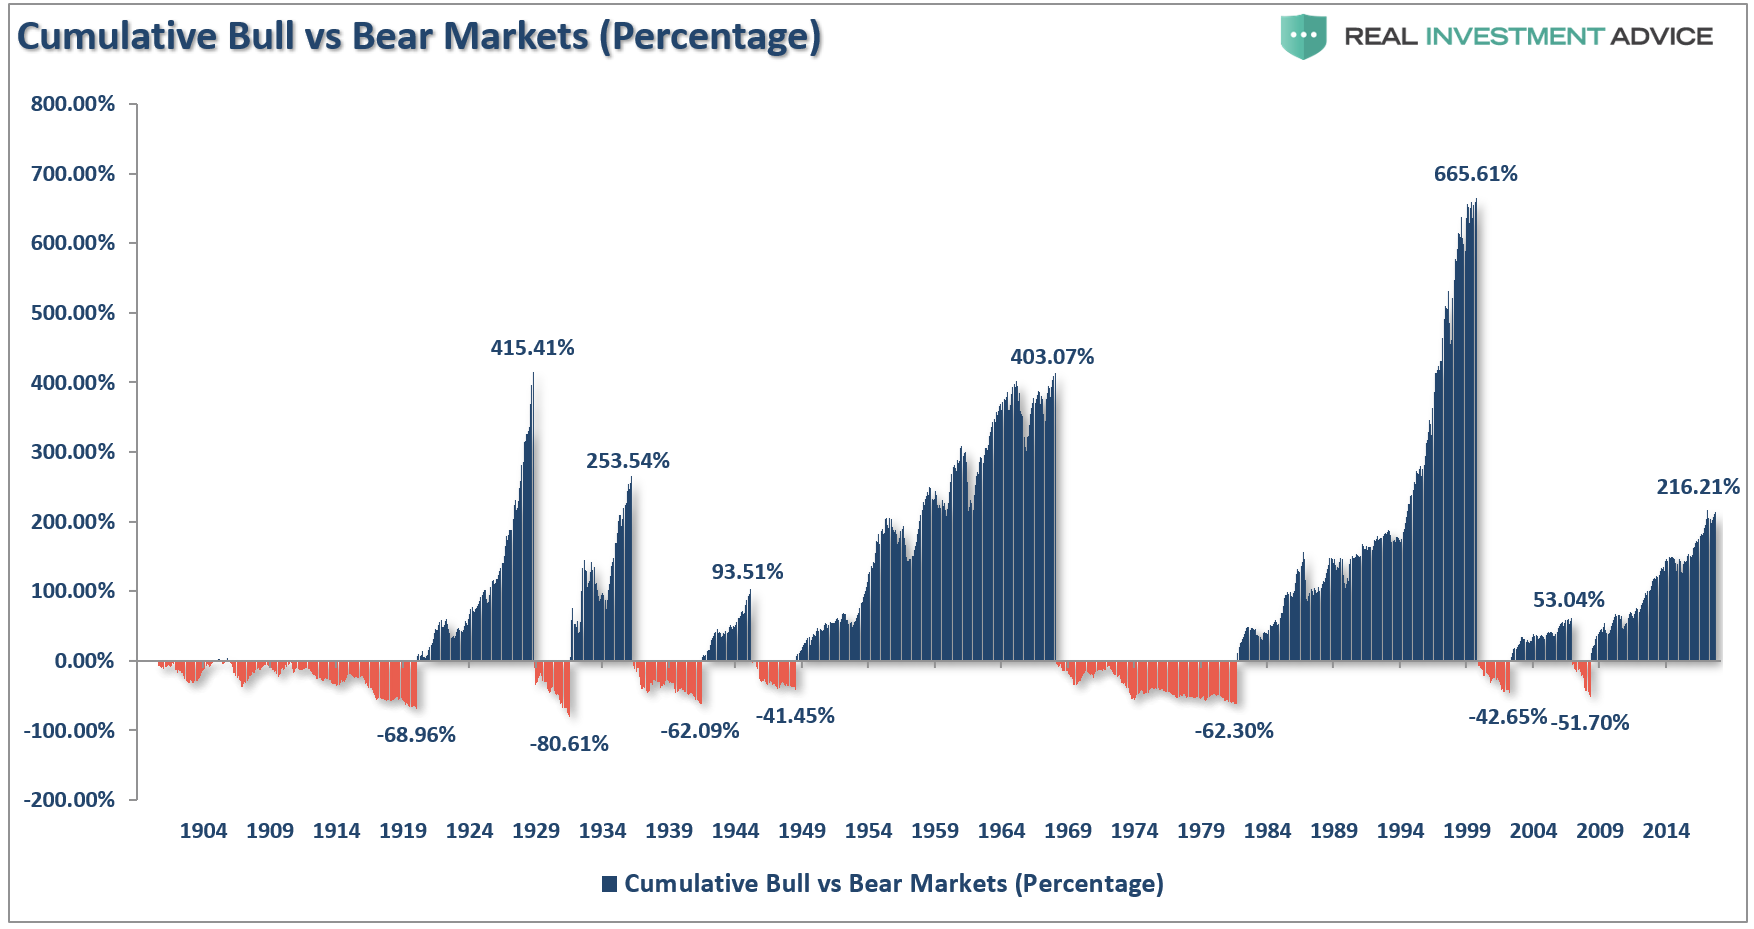
The chart below has been floating around the “web” in several forms as “evidence” that investors should just stay invested at all times and not worry about the downturns. When taken at “face value,” it certainly appears to be the case. (The chart is based up Shiller’s monthly data and is inflation-adjusted total returns.)
The problem is the entire chart is incredibly deceptive.
More importantly, for those saving and investing for their retirement, it’s dangerous.
Here is why.
The first problem is the most obvious, and a topic I have addressed many times in past missives, you must worry about corrections.
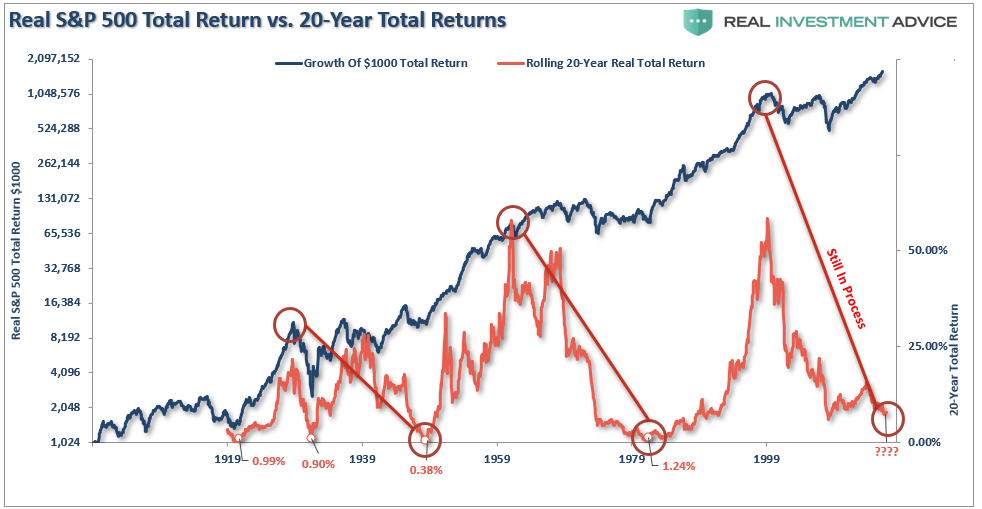
Most investors don’t start seriously saving for retirement until they are in their mid-40’s. This is because by the time they graduate college, land a job, get married, have kids and send them off to college, a real push toward saving for retirement is tough to do as incomes, while growing, haven’t reached their peak. This leaves most individuals with just 20 to 25 productive work years before retirement age to achieve investment goals.
This is where the problem is. There are periods in history, where returns over a 20-year period have been close to zero or even negative.
Currently, we are in one of those periods.
Lies, Damned Lies And Statistics
Secondly, percentages are deceptive.
Back to the first chart above, while the mainstream media and bloggers love to talk about gains and losses in terms of percentages, it is not an apples to apples comparison.
Let’s look at the math.
Assume that an index goes from 1000 to 8000.
- 1000 to 2000 = 100% return
- 1000 to 3000 = 200% return
- 1000 to 4000 = 300% return
- 1000 to 8000 = 700% return
A 700% return is outstanding, so why worry about a 50% correction in the market when you just gained 700%?
Here is the problem with percentages.
A 50% correction does NOT leave you with a 650% gain.
A 50% correction is a subtraction of 4000 points which reduces your 700% gain to just 300%.
Then the problem now becomes the issue of having to regain those 4000 lost points just to break even.
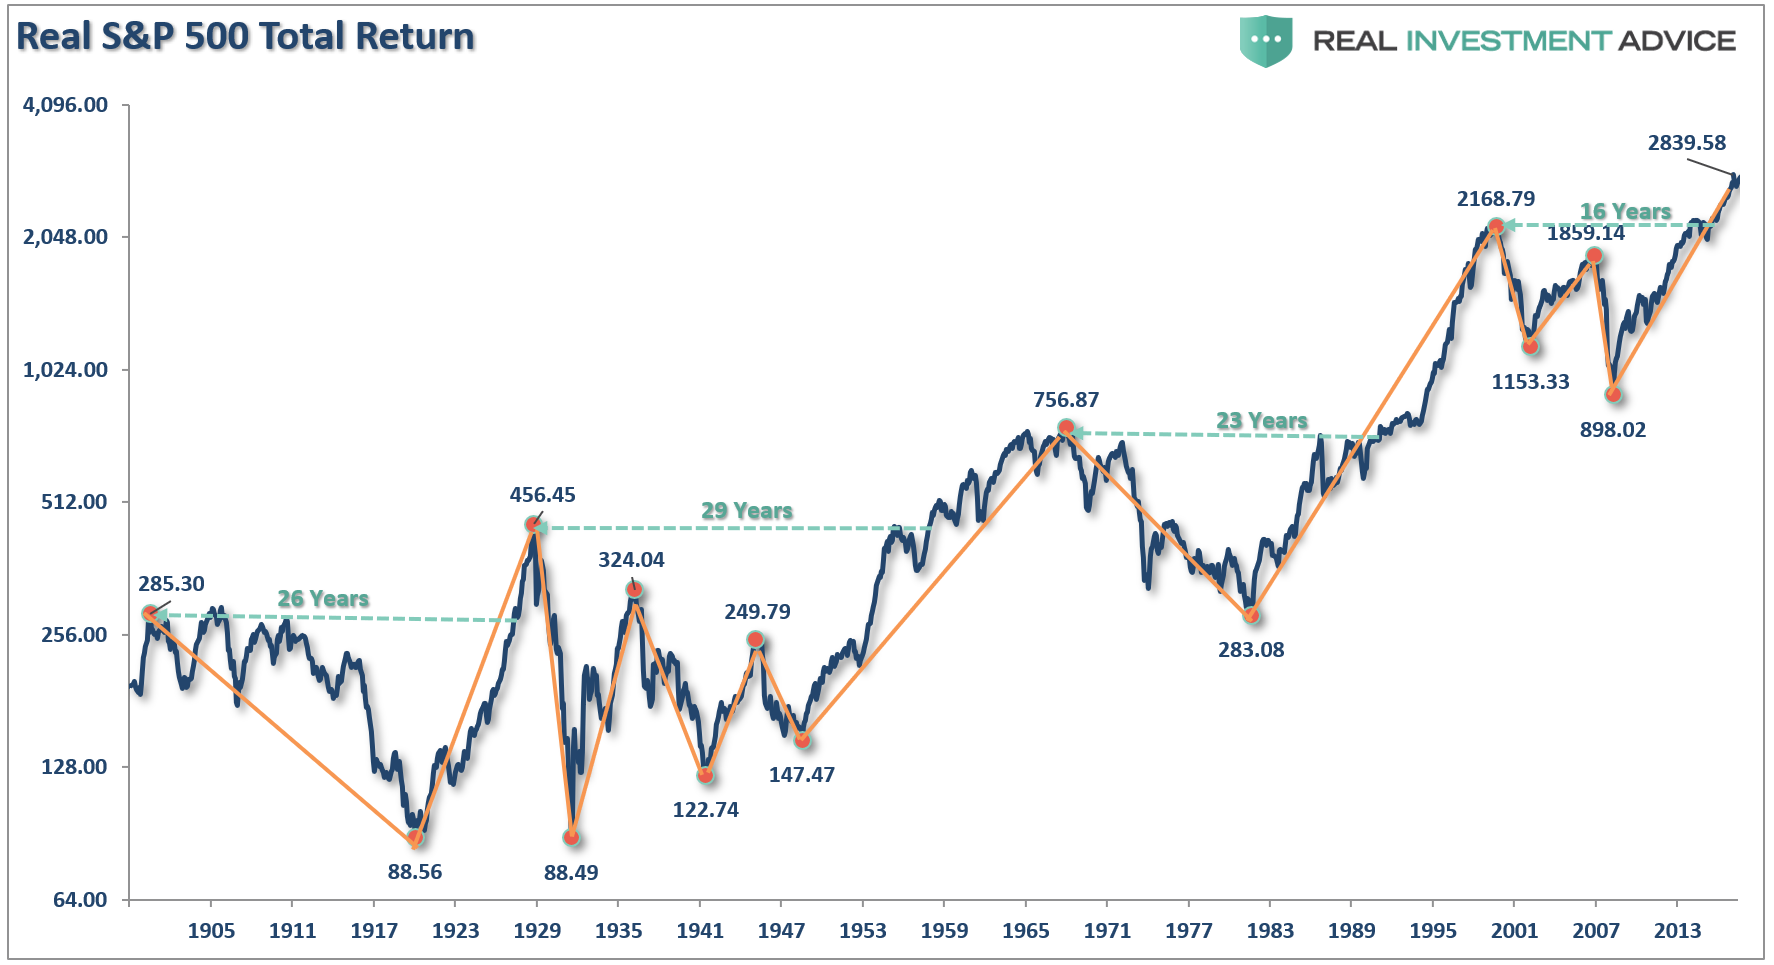
Let’s look at the S&P 500 inflation-adjusted total return index in a different manner.
The first chart shows all of the measurement lines for all the previous bull and bear markets with the number of years required to get back to even.
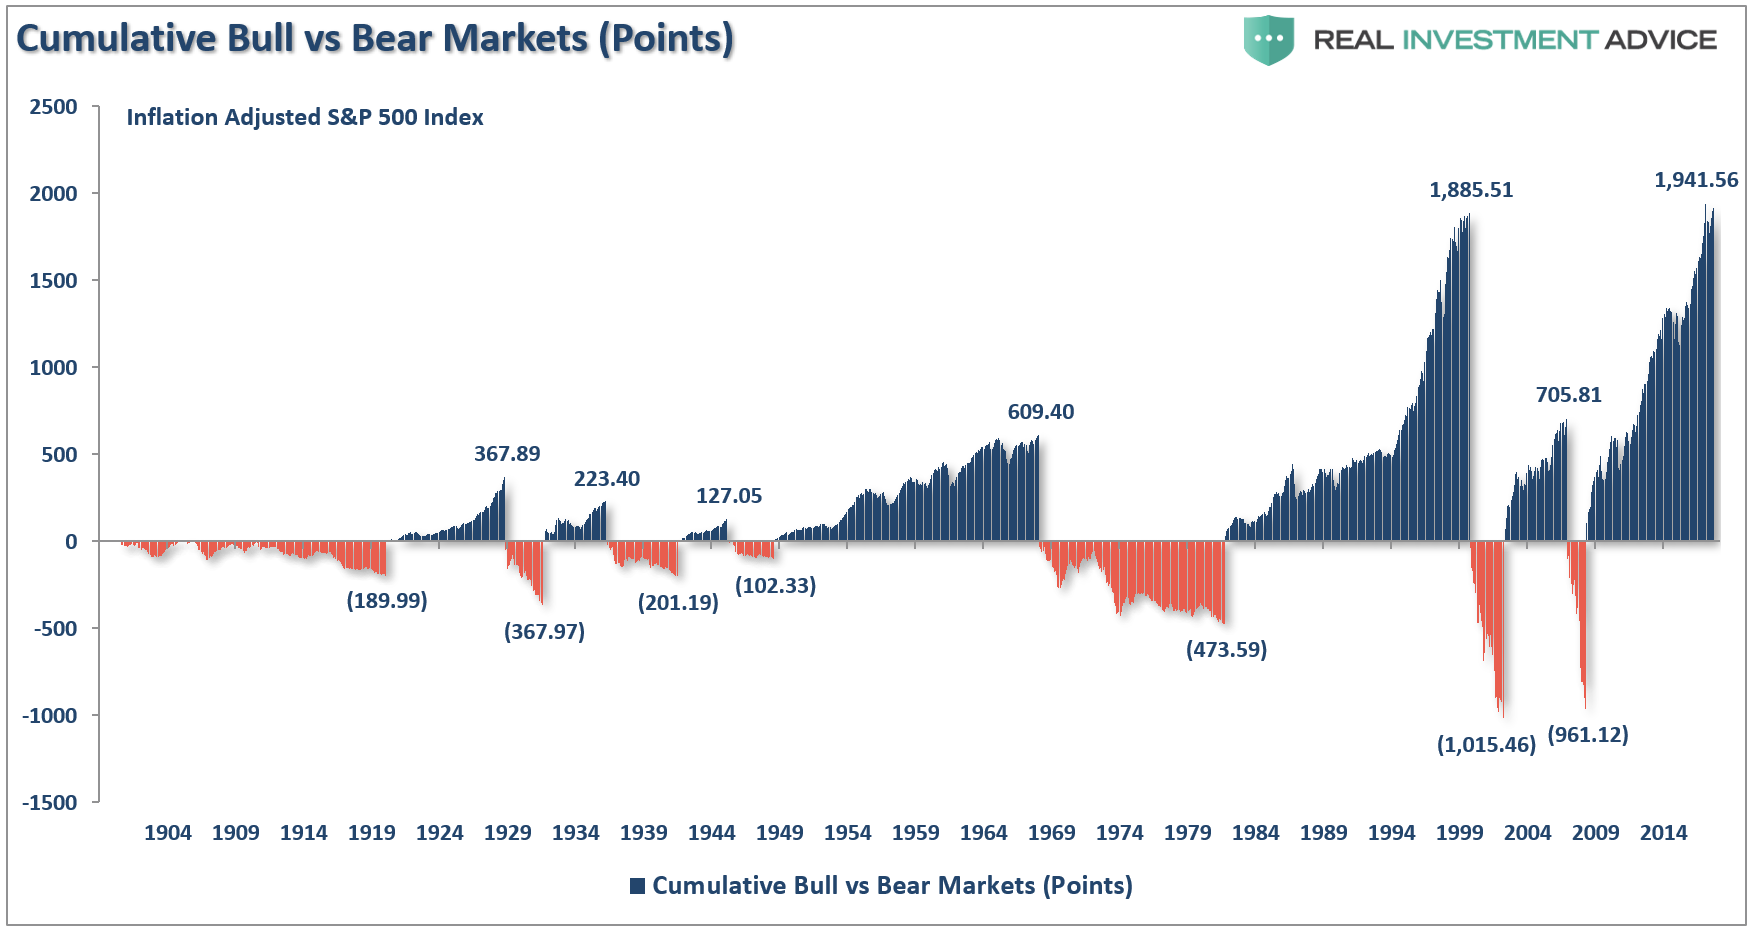
What you should notice is that while the original chart above certainly makes it appear as if “bear markets” are no “big deal,” the reality is that in many cases bear markets wiped out essentially a substantial portion, if not all, of the the previous bull market advance. This is shown more clearly when we convert the percentage chart above into a point chart as shown below.
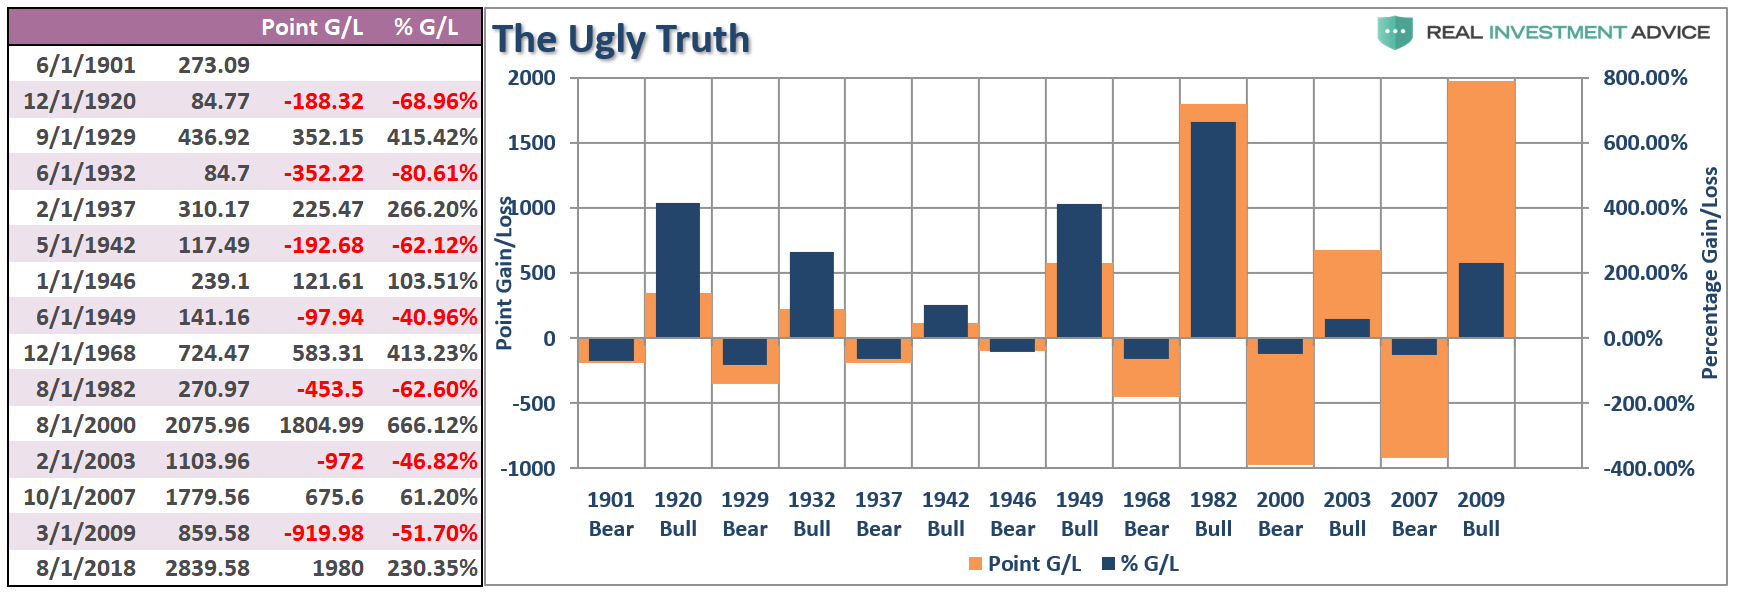
Here is another way to view the same data. The table and chart below overlays the point AND percentage of gain and loss for each bull and bear market period going back to 1900 (inflation-adjusted).
Again, the important thing to note is that while record “bull markets” are a great thing in the short-term, they are just one half of the full-market cycle. With regularity, the following decline has mostly erased the previous gain.
Broken Records
While the financial media is anticipating a new “record” being set for this “bull market,” here is something to think about.
- Bull markets END when everything is as “good as it can get.”
- Bear markets END when things simply can’t “get any worse.”
While everything is certainly firing on all cylinders in the market and economy currently, for investors this should be taken as a warning sign rather than an invitation to pile on additional risk.
In the near term, over the next several months, or even a year, markets could very likely continue their bullish trend as long as nothing upsets the balance of investor confidence and market liquidity.
This bull market will easily set a “new bull market record.”
But, as I said, “records are records” for a reason. As Ben Graham stated back in 1959:
The more it changes, the more it’s the same thing.’ I have always thought this motto applied to the stock market better than anywhere else. Now the really important part of the proverb is the phrase, ‘the more it changes.’
The economic world has changed radically and will change even more. Most people think now that the essential nature of the stock market has been undergoing a corresponding change. But if my cliché is sound, then the stock market will continue to be essentially what it always was in the past, a place where a big bull market is inevitably followed by a big bear market.
In other words, a place where today’s free lunches are paid for doubly tomorrow. In the light of recent experience, I think the present level of the stock market is an extremely dangerous one.
He is right, of course, things are little different now than they were then.
For every “bull market” there MUST be a “bear market.”
While “passive indexing” sounds like a winning approach to “pace” the markets during the late stages of an advance, it is worth remembering “passive” approaches will also “pace” the decline.
Understanding that your investment returns are driven by actual dollar losses, and not percentages, is important in the comprehension of what a devastating effect corrections have on your financial outcome. So, before sticking your head in the sand and ignoring market risk based on an article touting “long-term investing always wins,” ask yourself who really benefits?
This time will not be “different.”
If the last two bear markets haven’t taught you this by now, I am not sure what will.
Maybe the third time will be the “charm.”
- English (UK)
- English (India)
- English (Canada)
- English (Australia)
- English (South Africa)
- English (Philippines)
- English (Nigeria)
- Deutsch
- Español (España)
- Español (México)
- Français
- Italiano
- Nederlands
- Português (Portugal)
- Polski
- Português (Brasil)
- Русский
- Türkçe
- العربية
- Ελληνικά
- Svenska
- Suomi
- עברית
- 日本語
- 한국어
- 简体中文
- 繁體中文
- Bahasa Indonesia
- Bahasa Melayu
- ไทย
- Tiếng Việt
- हिंदी
The Longest Bull Market In History And What Happens Next
Published 08/17/2018, 06:28 PM
Updated 02/15/2024, 03:10 AM
The Longest Bull Market In History And What Happens Next
3rd party Ad. Not an offer or recommendation by Investing.com. See disclosure here or
remove ads
.
Latest comments
Every Weekend, I waited for your Articles which are like Nutrition to keep human alive!. . My Unlimited Appreciation to Sir Lance Roberts !!!
You are suffering with a recency bias. This is not the longest bull market in history. In 2012 we had a bear market when stocks fell by 20% for the next three months. In 2016 USA Today published an article indicating that S&P 1500 index had average stock's distance from their 52-week high at 26.9% so those stocks were already in bear market (see Stealth bear market mauls Wall Street, USA Today, January 2016), so claiming that we are experiencing the longest bull market in history is either a deliberate lie or ignorance.
The S&P dropped to 21.694 points lower than 20% off the top in 2011 instead of 2012.
Actually, the Next Ultimate Running Up Number of After- Dot-Com-Crash-S&P was set up during 2001 to 2002 and we have been running on the way to that Number for more than 15 years already. So, in that Sense, both cases of 21.694 lower than 20% off the top in 2011 and 57% off the top in 2007 are just working together to make this longest Bull Market come true.
I love your analysis and charts. My appreciation for your straight talk is immense. I am not totally out of equities yet but have been loading up on high quality long terms bonds (30 year T-Bonds and AAA). With 3% yields now and possible higher in remaining new issues of 2018 (doubt it) it should be a good asset class when the inevitable crash happens. I wish I would have found you sooner in my Investing life!!! Thank you
Great article, as always! It will be the same old story again and again into infinity. People will lose everything and more because the attitude is like a casino one. They will try to recover the losses by bringing more money into the market. Sad, but true. Always.
Install Our App
Risk Disclosure: Trading in financial instruments and/or cryptocurrencies involves high risks including the risk of losing some, or all, of your investment amount, and may not be suitable for all investors. Prices of cryptocurrencies are extremely volatile and may be affected by external factors such as financial, regulatory or political events. Trading on margin increases the financial risks.
Before deciding to trade in financial instrument or cryptocurrencies you should be fully informed of the risks and costs associated with trading the financial markets, carefully consider your investment objectives, level of experience, and risk appetite, and seek professional advice where needed.
Fusion Media would like to remind you that the data contained in this website is not necessarily real-time nor accurate. The data and prices on the website are not necessarily provided by any market or exchange, but may be provided by market makers, and so prices may not be accurate and may differ from the actual price at any given market, meaning prices are indicative and not appropriate for trading purposes. Fusion Media and any provider of the data contained in this website will not accept liability for any loss or damage as a result of your trading, or your reliance on the information contained within this website.
It is prohibited to use, store, reproduce, display, modify, transmit or distribute the data contained in this website without the explicit prior written permission of Fusion Media and/or the data provider. All intellectual property rights are reserved by the providers and/or the exchange providing the data contained in this website.
Fusion Media may be compensated by the advertisers that appear on the website, based on your interaction with the advertisements or advertisers.
© 2007-2024 - Fusion Media Limited. All Rights Reserved.

