Some will be pleased to see closure on the month of February, with the ASX 200 finishing the month 0.36% lower and following on from the 0.45% drop we saw in January. Others would have welcomed the brief bout in extreme equity market volatility and will hope this is a taste of things to come in 2018. It certainly feels as though these pockets of heightened vol will be a theme we need to understand and harness, not just in our ability to speculate but, of course, when we consider managing portfolio risk.
The moves in the ASX 200, however, have shown good outperformance when we contrast to the DAX (-5.7% when priced in EURs, -4.1% in AUD) and the S&P 500, which is closing the month on a sour note (the S&P 500 is currently 0.9% lower), and in turn we see the fine run of form, with the S&P 500 closing higher for 10 consecutive months of gains, coming to an end and the 3% drop in February is the worst monthly performance since January 2016. In fact, if we exclude the 0.04% drop seen in March 2017, the S&P 500 has a positive monthly close every month since November 2016.
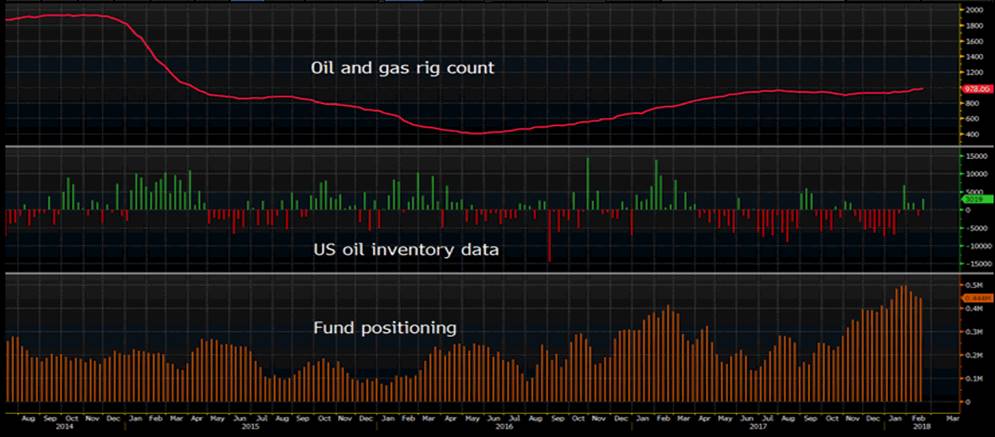
Our call for the ASX 200 open currently sits at 5973, so a few headwinds to work through on the open and the event risk ramps up here. We go into the day eyeing a soft tape in the US, while Oil has taken a 2.3% hit after a poor DoE inventory data at 02:30 aedt, where crude stocks gained 3.019 million barrels vs expectations of 2.23 million, while gasoline inventories gained 2.48 million barrels. Overlap the moves in the S&P 500 and we can see the equity index following the oil price closely and this will weigh on the ASX 200 energy sector.

We can see US economic data has been on the soft side in overnight trade and following on from the poor Chinese manufacturing and service data seen in Asia yesterday. Here, we saw the revised Q4 GDP remaining at 2.5%, while Chicago manufacturing PMI printed a below-consensus 61.8 and this may manifest in tonight’s (02:00 aedt) ISM manufacturing report, which is expected to expand at a slightly slower pace, with the consensus calling the index at 58.7. We also saw a poor pending home sales report, printing a 4.7% decline in January.
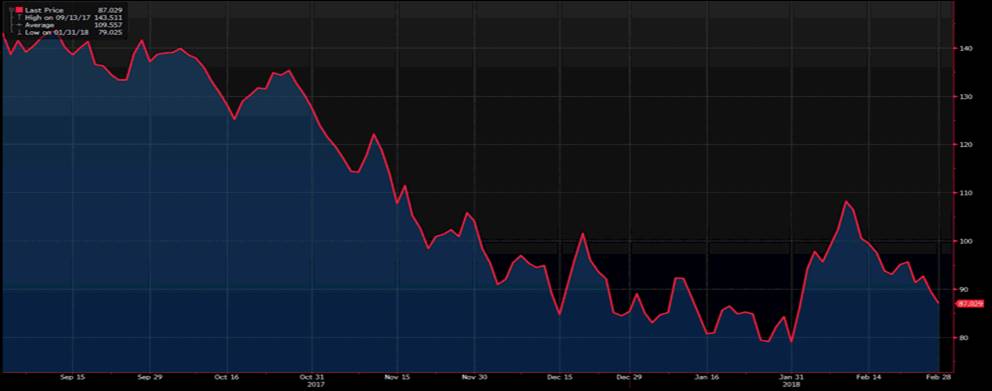
So very little to inspire in overnight trade and some have questioned the idea of four hikes to the Fed funds rate in 2018 and the longer-term impact if positive US (and global) economic data surprises are harder to come by and some of the data flow is actually pulling back a touch, from what is still quite elevated levels. It is no surprise then that the US interest rate markets are speaking out today, where we can see traders pairing back moves seen in fed fund and Eurodollar Futures and we can see the implied tightening in 2019 being reduced a touch to 32bp, while the spread between the Eurodollar Futures December 2018 and December 2020 contracts has come in three basis points (bp) to 39.5bp. We can see the US Treasury yield curve continues to flatten and the trade I have been keen to advocate in fixed income has been a flatter 2’s vs 30’s curve and this is working well at present, sitting at 87bp.

The JPY is the superstar currency at present, which shouldn’t necessarily surprise given the actions of the BoJ yesterday to try and steepen the JGB (Japanese government bond) curve. The central bank detailing that they were buying fewer bonds at the long-end, with the notion that a steeper yield curve makes the financial sector more profitable. The actions didn’t seem to help though and the Japanese banking sector fell 1.7% on the day and the side-effect of a relative steeper JGB curve is just another carrot for Japanese funds to repatriate capital back to Japan and, of course, we see the JPY finding buyers across all G10 currencies. We can see the trade-weighted JPY closing out March well over 3% higher, which puts it on track for its best month since June 2016. Granted the market went into 2018 extremely short of JPY and some of this move is undoubtedly premised on a position unwind, but there are many tactical reasons to be long of JPY and 2018 is shaping up as a good year for the currency.
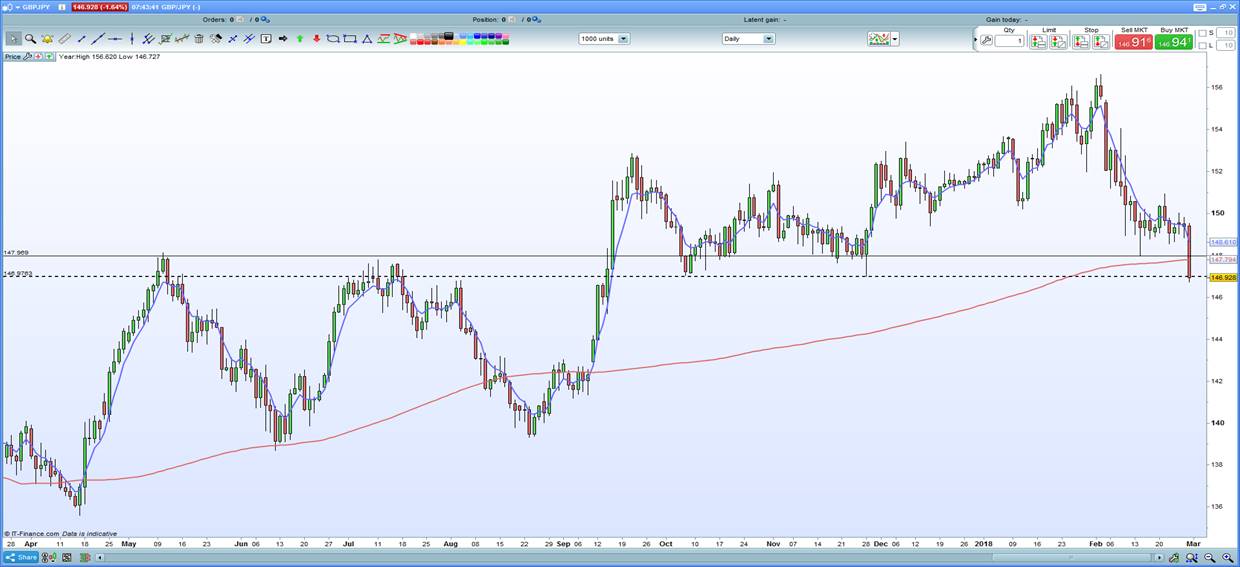
Without a doubt though, the biggest moves have been seen in GBP/JPY, with the pair 1.6% lower on the day. We see price not just push through the 200-day moving average, but also testing the 28 November significant low of ¥146.97. A close through this level opens this pair up for a longer-term move into ¥140.00 – it is the weakest link out there and should be on FX trader’s radars here.

One can put AUD/JPY on the radar too, with price at the lowest levels since June 2017. The event risk for the AUD and rates traders comes today in the form of Aussie Q4 CAPEX data (due at 11:30 aedt), where the Q4 number is expected to gain 1% and this feeds directly into next week’s GDP calculation. Traders should also focus on the spending intention aspect of the report, with the fourth estimate of the 2017/18 spending plans expected to print close to $109 billion, so the AUD may find some relief should we see this revised above $110 billion or so. Clearly, a number below say $105 billion may not be taken as positively, while traders also get treated to the first estimate of Aussie business spending plans for 2018/19, which according to Westpac’s forecasts should come in around $82 billion.
Keep in mind the Aussie interbank rates markets are now pricing in very little across the curve, with three basis points of hikes priced in for the August (or a 12% chance of hike) RBA meeting and 12bp through to the end of the year. This seems fair and therefore from a rates perspective, there shouldn’t be a huge reaction in the market from this data as it isn’t going to change the market pricing on hikes.
Also keep in mind that at 12:45 we get the China Caixan manufacturing report, and while there is no consensus survey for us to work off, any weakness relative to the prior read of 51.3 will not be taken well be the market. So a few headwinds seen in the markets today and it will certainly pay to be in more defensive sectors of the markets, where materials and energy will likely find good sellers (BHP’s ADR points to a 1.8% weaker open) and banks modestly lower.
