There hasn’t been a huge amount of keynote stories to drive and perhaps that’s a reflection of Donald Trump not influencing markets in the way we have become quite accustomed too.
In fact, German Chancellor Angela Merkel has stolen some of the thunder by saying the euro is “too weak” and makes German products cheaper. This has naturally been taken positively be a market increasingly holding a love affair with all things Europe. Here, we can see strong inflows into European equity and bond funds of late, largely doing so currency unhedged (an EUR positive) and we can see the weekly Commitment of Traders (CoT) report showing speculative funds have swung to the first net long position in EUR futures since mid-2014.
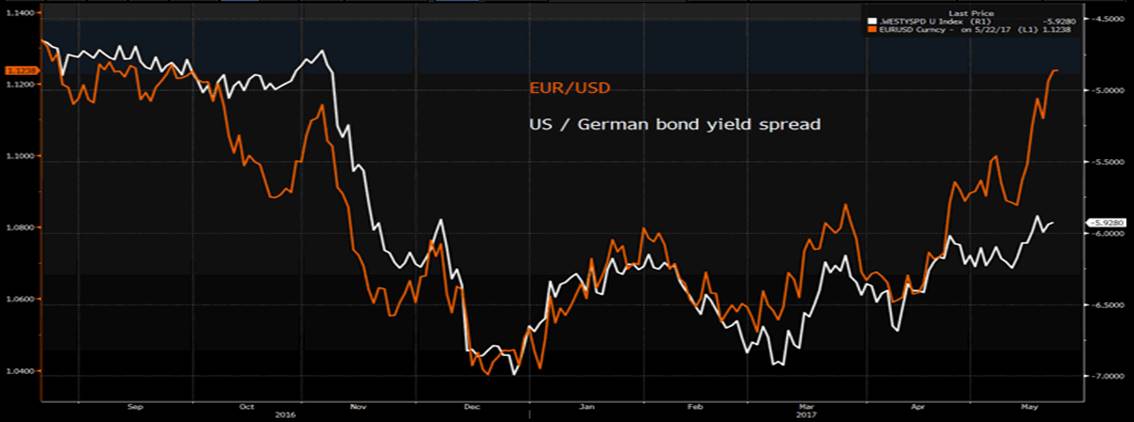
In FX land, we can see EUR/USD has traded to a high of $1.1263 and is trending higher beautifully, although if we look at a spread differential between US and German bunds it suggests that EUR/USD has perhaps run a bit hot too soon.

Saying that the German bond market is selling off nicely at the moment and that is putting upside into the EUR valuation (higher relative yields mean a more attractive currency) and specifically for those who like trading fixed income shorts on the German two-year (schatz) would be the preference here. EUR/GBP perhaps looks the better FX trade though, with the pair breaking to a new higher high, so the preference is to be long here for a move into £0.8750 to £0.8800.
Risk appetite has held in quite well through US trade, with some focus on Trump’s deal making in the Middle East. US equities have pushed modestly higher, yet again, with the Nasdaq 100 and tech leading the charge. The S&P 500 has seen a move higher of 0.5% on volumes 10% below the 30-day average, with 79% of stocks higher on the day, so breadth looks pretty good. We have seen industrials working well, but flat moves have been seen in materials and energy, so after yesterday’s strong moves in these two ASX 200 sub-sectors, we may see a more subdued open today.
On a more technical note, the S&P 500 is pushing towards, and looking to fill last Tuesday’s “gap” low at 2396.05, so this level is now key. Traditionally gaps are meant to be filled, but it’s how price reacts at this level that traders are most interested in and whether we see the sellers kick in and price subsequently rolling over (and heading lower). The risk then is the S&P 500 finds resistance at 2396.05, but if we do see the bulls find the impetus to push the index through 2396.05 then new highs should be seen and this should support markets like the ASX 200 and other global markets more broadly. One for the radar.
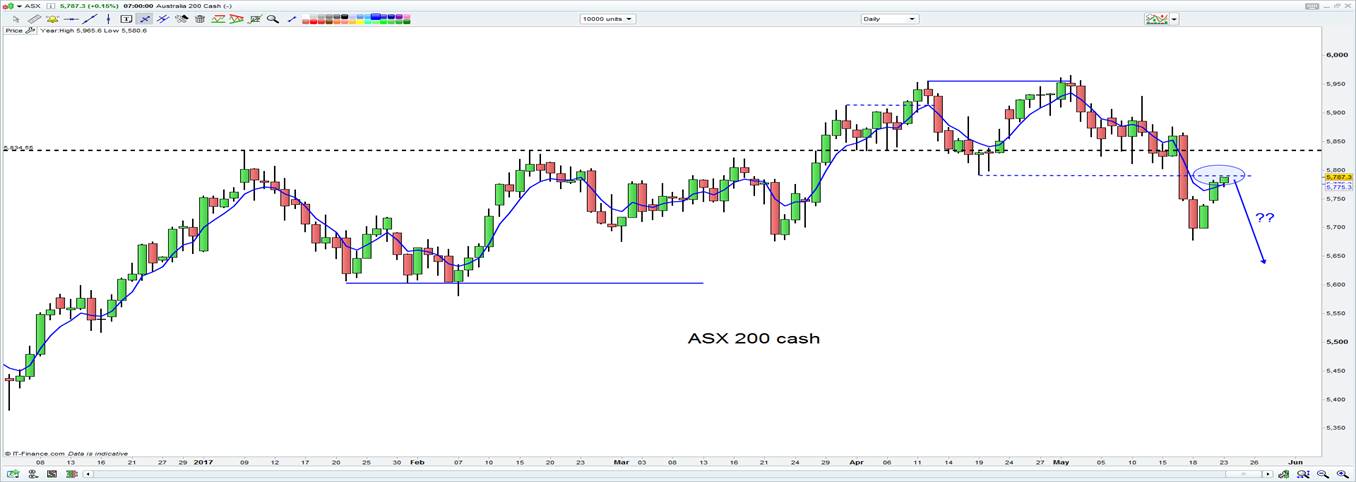
In fact, our own equity index is at an interesting juncture itself. After a move below 5700 last week we find price moving back to test the neckline of the April and May double top at 5791. A break then above 5791 would be positive and we should see a fairly quick move towards 5850 to 5900. However, if the sellers kick into gear on the open, where we see the index opening at 5786, then that could really provide confidence that 5791 is the strong resistance level and that we could be staring at lower levels in the sessions to come. My belief is that risk appetite and sentiment stays firm for now, especially in the absence of any tier one data and Trump staying out of the limelight.

Thursday’s OPEC in Vienna meeting remains a key event risk (see the expected schedule) and as mentioned in prior reports the risk of a ‘sell the fact’ event remains elevated. Iraq has come to party and also detailed a desire to extend the output cut agreement, but oil has failed to respond and attract fresh buyers, again highlighting how much the market has discounted already.
Oil prices are higher on the session, but that obviously include yesterday’s Asian session where price rallied on the open. So importantly, the price is largely unchanged from the ASX 200 close at 16:00 yesterday and hence the energy sector should open on a flat note.
We have seen some buying in the bulk and metals complex, with spot iron ore closing up 0.8%, while Dalian iron ore and steel futures closed up 0.2% and 0.6% respectively. BHP looks destined for an unchanged open (given the lack of any move in the American Depository Receipt), while Vale’s US-listing closed up 0.8% giving some belief that the pure-play miners should find support on open.
AUD/USD has found modest buying, trading to a session high of $0.7488, and whether that has been influenced by the key terms of trade or whether it’s just USD weakness is debatable, but the key level to watch today is $0.7491 and the March low.
Aside, from that, it’s been amazing to see the client flow in Bitcoin and perhaps in a world devoid of volatility Bitcoin has it in spades, especially today with price trading in a $299 range.
