Market participants are clearly winding down and while we saw ASX 200 turnover some 18% below the 30-day average yesterday, I wouldn’t be surprised if we saw less than $5 billion today. Volumes through the S&P 500 were 36% below the 30-day average, while volumes were down some 40% on the German DAX and of course this shouldn’t surprise too greatly.
The moves in equities, or should I say lack of them won't surprise too many either, as it’s reflected in such low levels in implied market volatility. By way example, the US volatility index (the “VIX”) has fallen a further 1.5% to 11.3%. No one is really prepared to put any real money to work in the market right now and this is also reflected in the intra-day ranges, with the DAX and Dow trading in a measly 39 and 44 point range respectively. SPI futures have traded between 5564 and 5587 and ultimately sit down 3 points from the 16:30 futures close. Our call for the ASX 200 is unsurprisingly flat, but we still see the open at the highest levels since 3 August 2015. It’s always nice to end the year on a high.
There almost seems to be a sellers strike through global equity markets and that is certainly true of the Aussie market. Short sellers (through the wider market) have largely shut up shop until the New Year, understanding that at an index level bad news is not impacting sentiment at all. Interestingly though, our own flow from retail clients is positioned largely on the short side, with 78% of all open position on the ASX 200 sold short.
There seems to be a view that we may see a drift back into 5600 in the short-term and that may well eventuate, but there are some positive seasonal factors at work here. Of course, there are still individual stock stories where traders will still act aggressively and try and short sell these names for a quick profit as the buyers stand aside and price falls.
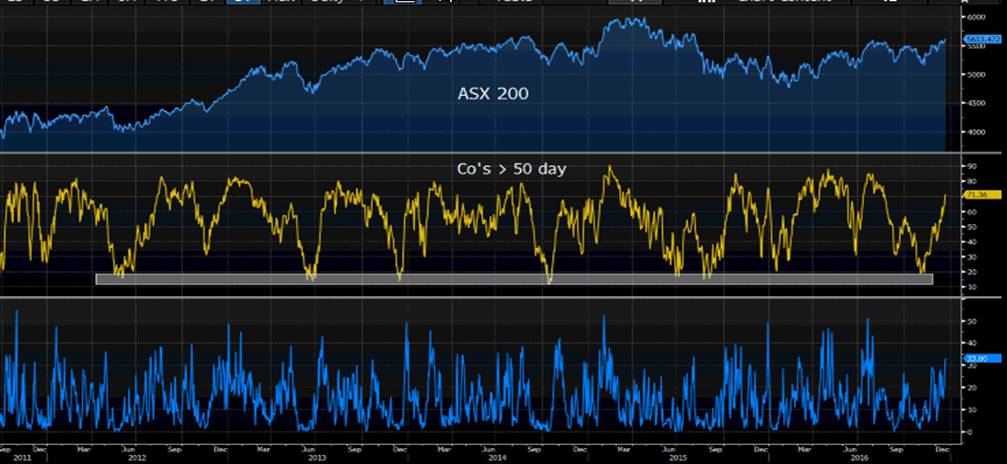
It’s interesting to see 33% of the ASX 200 trading at 4-week highs. This has to be seen as bullish in my opinion, as we are seeing good participation in the rally. I would be concerned though and we generally see the market top out when we see around 50% of the market at 4-week highs. The market internals doesn't suggest an over loved market just yet and the view we could look at contrarian positions.
(The lower pane shows the percentage of companies at 4-week highs)

The fact that the S&P 500 energy space is up 0.3% when oil was one of the few markets that actually showed signs of life overnight shows that at this time of year strange and mysterious things happen in markets. US crude is around 2% lower than where we were when the ASX 200 closed yesterday, with traders reacting to a 2.256 million barrel increase in crude inventories, with the analysts expecting a drawdown of over 2million barrels. As mentioned yesterday this estimate is about as big a lottery as we get in the world of forecasting and data estimates.
If we look at the various ADR’s seen as a a proxy for various sectors, BHP Billiton Ltd (NYSE:BHP) should open fairly close to $25.00 (-0.7%), ClearBridge American Energy MLP Closed Fund (NYSE:CBA) +0.4% and Woodside Petroleum Ltd (AX:WPL) -0.2%.
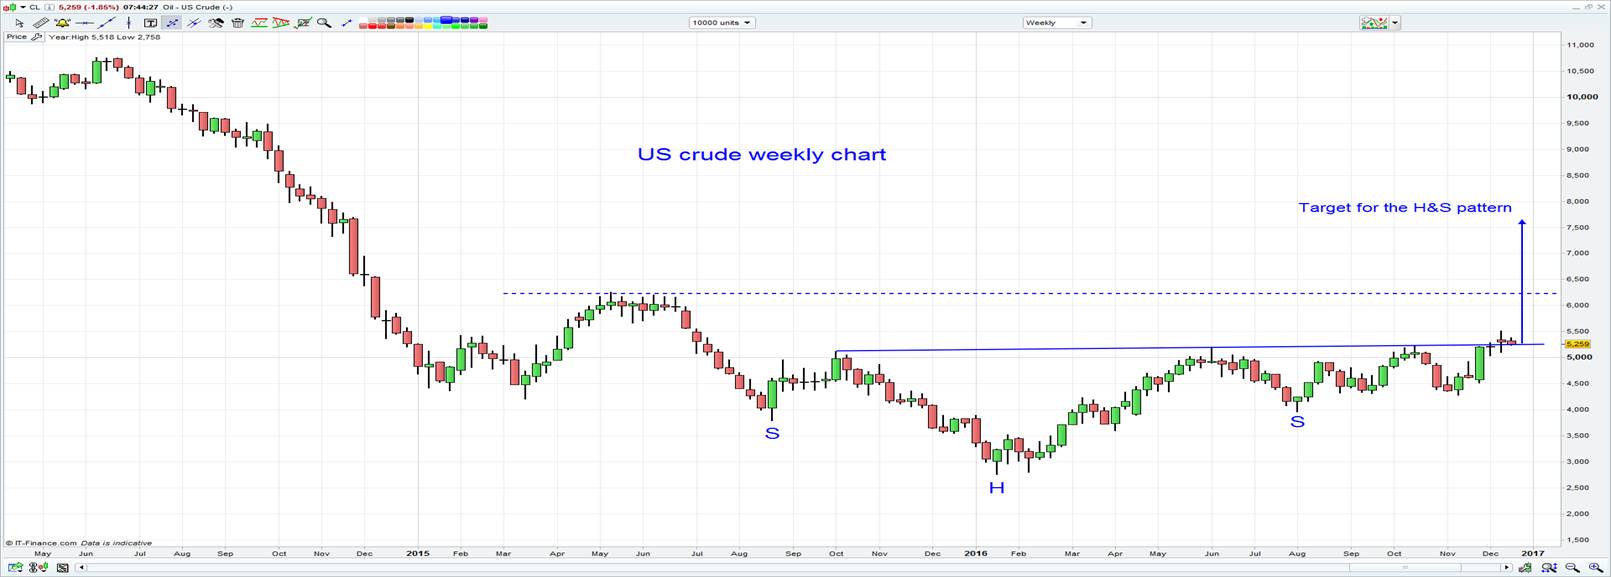
From a purely technical basis US crude should be on the radar as the price is re-testing the neckline of the inverse head and shoulders pattern (best seen on the weekly chart) at $52.50. A rejection and subsequent rally off this support level would be well received by the oil bulls and throw some real weight behind the validity of pattern, which if we need to pick levels suggests a target of $75.00.
How would the world look like in 2017 with US crude and Brent above $75.00? Certainly, it would aid those who think the US 10-year treasury is going above 3%, in turn, providing a further tailwind to the big consensus trade for 2017 – long USDs.

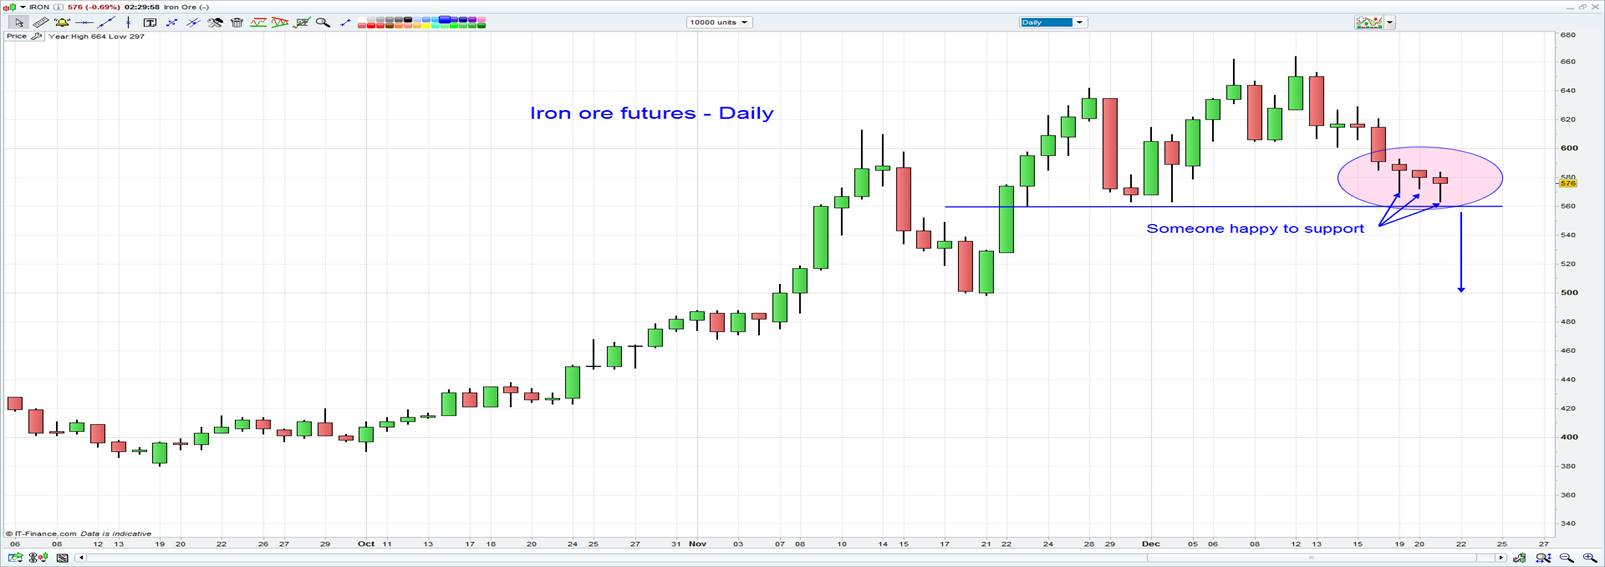
Staying in the commodity theme and there are no moves to really speak of with copper falling 0.2%, while iron ore and rebar futures are essentially unchanged. I think the daily chart of iron ore futures (Dalian) is interesting and we can see that someone in the market is happy to have a nibble on moves below 576 and support is kicking in.
I have iron ore on the radar as a close below 560 would suggest short positions for a move into 500. For those trading the likes of FMG and other bulk producers/explorers this would be another reason to put iron ore futures on the radar.

G10 FX has been fairly sleepy too, with the AUD/USD trading in a range of $0.7236 to $0.7280. The currency that has really seen a genuine move has been the Swedish krona (SEK), with USD/SEK falling 1.4%. Short EUR/SEK is an interesting trade, with the pair breaking lower and trading at the lowest levels since October. With the Riksbank (the Swedish central bank) tapering off its bond buying program (QE) overnight to SEK5billion (from SEK7.5 billion) and dissent growing among the board, there is a progressive view that the Swedish central bank may stop its QE program altogether in June, which in turn suggests we could see EUR/SEK heading toward 9.5000 in the short-term.
