It’s a good day to be an equity bull, however, it’s a slow grind higher as opposed to an explosion in demand and the moves we are seeing in many markets are fairly subdued. There is a clear focus on implied volatility and rightly so. The US volatility index (aka the “VIX”) at 11.56% is approaching the year’s low of 11.02%, while we are actually at the year’s low point on the ASX 200 volatility index. This would be generally be ideal for investors who want income (i.e. high dividend paying names) if it weren’t for the rising bond environment working as a cost of capital.
However, it seems traders and investors are simply not positioned for an impending rush of blood to the head and potential range expansion in markets. Everyone is very calm as we head into Christmas and New Year.
That all may change at the start of 2017, when fund managers have locked in their monthly, quarterly and year’s performance and we don’t have the FOMO (Fear of Missing Out) trade pushing cash into the market on literally any 0.5% drop. The overnight leads though are unconvincing and we approach the start of Asian trade knowing the Dow was a whisker from wearing a 20 handle, but has faded away towards the latter stages of the day. The S&P 500 is 0.2% higher, with financials and consumer discretionary working well and modest selling seen in energy. It won’t shock that volumes are light, with turnover some 30% below the 30-day average on the S&P 500.
The European equity markets are really where I want to be. I have been pushing a positive message on the MIB and DAX for a while and we now have strong breakouts occurring, with the DAX trading to the highest levels since August 2015 and the Italian market since January. Impressively, the Italian MIB has rallied some 20% since hitting 16,000 on 21 November, helped by good-will towards the banking space, with the government asking parliament for a €20 billion debt increase.
On a slight side note and staying in Europe, while everyone is fixated on inflation expectations in the US, we should keep an eye on European inflation expectations in 2017 as the 9% fall in EUR/USD since August may become a strong tailwind here in 2017 for Europe. That being said, the EUR still looks one of the more ugly houses on the block and short positions are still preferred.
In other markets, we have seen some modest selling in US fixed income with the 10-year US treasury pushing up three basis points and eyeing a move back to the recent highs of 2.63%. In FX land it’s been a day of selling JPY, with CAD/JPY and USD/JPY the pairs to be long.
This is especially interesting as the Bank of Japan effectively said nothing new in yesterday’s central bank statement, but that in itself was enough to cause JPY selling and by not giving any indications it was preparing for a move away from targeting a fairly explicit level in their 10-year government bond (what the BoJ call “yield curve control”), they were able to push USD/JPY back into the ¥118.00 level. This should push the Nikkei higher on open, with Japanese banks a likely star here.
The AUD/USD has traded in a tight range of $0.7263 to $0.7223 on the session, with better buying seen in AUD/JPY. In fact, if we look at the daily chart of AUD/USD we can see some signs of indecision from the AUD bears to push down further after a strong move from $0.7524 on 14 December. The obvious target now for those short AUD/USD is the 24 May low of $0.7141, although I wouldn’t expect the pair to fall past this level this year. Especially with China injecting money back into its short-term money markets to keep liquidity abundant, which could have been an additional concern for AUD traders.
It’s been a fairly subdued night in the commodity complex, with oil a touch higher from the ASX 200 close, and while moves in price have calmed down of late traders will need to navigate through tonight’s weekly inventory report (02:30 AEDT). While the inventory report is always a bit of a lottery, analysts expect a strong drawdown of 2.43 million barrels, although gasoline inventories are expected to increase by around 1 million barrels.
Copper, iron ore and steel futures are either unchanged or very modestly higher. Spot iron ore did fall 2% but that was playing catch up to yesterday’s move in the futures. As a result, BHP’s ADR (American Depository Receipt) is up 0.8% and this should give us some belief that the ASX materials sector should see better buying today.
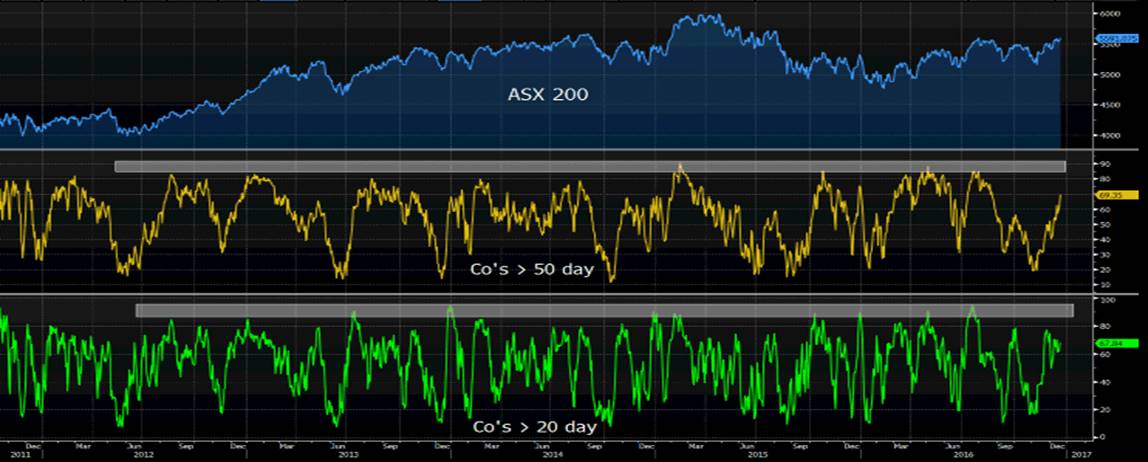
The wash-up is we see the ASX 200 opening at 5610, thus a test of the year’s high of 5611 (set on 11 August) is in play today. If we think in probability terms, a close above 5611 seems likely and this could open up a move into 5700, perhaps even 5730 by year-end. We can see that investors and traders have been happy to buy the market from 10:30 (AEDT) of late which is positive, but also the index is neither overbought, over owned or over loved (if we look at market internals).
The ASX market internals are not highlighting any signs of euphoria with 67% of companies above the 20-day moving average, and 69% above the 50 day. 30% of companies are at 4-week highs. These are not at disconcerting levels just yet.

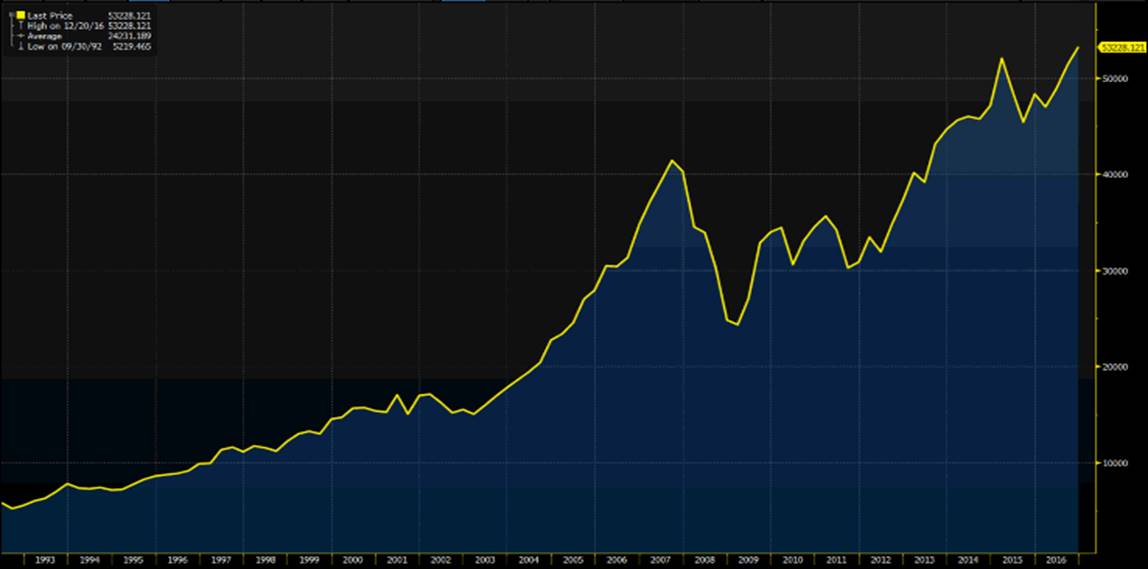
What’s more, if we look at the ASX 200 Accumulation Index (this index assumes full reinvestment of dividends on the day a company goes ex-dividend), this index is not just up 10.1% YTD, but at an all-time high. This is important as many fund managers will use this as a benchmark, so hopefully everyone who has managed super will be sitting on some nice profits this year!
(ASX 200 Accumulation index)

