
For months, people have been trying to explain the stock market’s relative resilience by comparing its performance to the bond market. Since early May, commentators have proclaimed that a “great rotation” out of bonds and into stocks had been in the works, simultaneously dismissing rising rates as a threat to equity investors. After all, the economy must be improving if the rates are climbing, right? (Insert your laugh here… a la a snicker, chortle or guffaw.)
Little Proof
The problem with the notion that investors are leaving the washed-out bond beaches for the sunnier shores of stock assets is that the evidence has never been there to support it. Granted, the bond exodus is well-documented. Yet the outflows from domestic as well as international stock ETFs/stock mutual funds since April demonstrates that the money is flowing into cash accounts, not equity investments.
Inflows and outflows are hardly the end-all in determining where the smart money has gone. Nevertheless, it would be refreshing to see “great rotation” advocates provide evidence when they make their bull-friendly, CNBC claims.
Even the bond exodus theme needs revision. For example, the real shift is one where those who have been exposed to longer-term bond maturities shifted their money to shorter maturities. Specifically, top June outflow ETFs included intermediate term funds like iShares Investment Grade Bond (LQD) as well as iShares 3-7 Year Treasury (IEF). In contrast, top June inflow ETFs include short term funds like SPDR Short Term Corporate (SCPB) as well as PIMCO Enhanced Short Maturity (MINT).
As an institutional money manager and President of a Registered Investment Adviser with the Securities and Exchange Commission, I have shifted my clients into shorter maturities as well. I have “rotated” some of the intermediate term high-yield found in iShares High Yield Corporate (HYG) into the shorter-term (HYS); in some instances, I have opted for the Guggenheim BulletShares series of ETFs where the vehicles actually mature at respective target dates. They include Guggenheim BulletShares 2016 High Yield Corporate (BSJG) and Guggenheim BulletShares 2017 High Yield Corporate (BSJH).
Tough Summer Ahead
For stock assets, when I have hit stop-limit loss orders in financial assets, then a fair amount in cash is left for a future buying opportunity. Again, this is very much in line with the real fund flow data. I am becoming increasingly convinced that global economic hardship and geopolitical strife will make it challenging for large mutli-nationals to make a great deal of headway in the summertime ahead.
On the other hand, not every decision should be made on fund flow alone. Do we ignore interest rates or corporate revenue or other economic data? Certainly not. Do we ignore technical data via momentum, trendlines or other things that affect price movement. Of course we don’t.
The Value Tilt
Consider iShares Small Cap Value (IJS). For one thing, larger corporations are more exposed to the increasing weakness in the global economy, from Europe to China to Latin America. I also prefer companies that have been around a longer time to weather storms, meaning that the value tilt is still preferential to the growth tilt. Perhaps most importantly, the relative strength via the price ratio below demonstrates that small cap value has outperformed large cap value over the last two months -- the same period in which the bond exodus/”great rotation” rumors began to hit the newswires.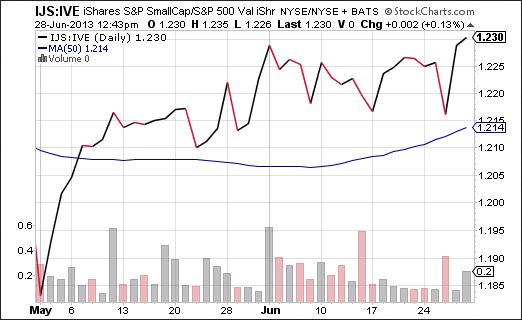
Dollar Cost Average Your Way
Investors might choose to dollar cost average into the positions that I discussed. It is rarely beneficial to buy after the best three-day rally in a given year. Other folks may simply choose to wait for a more substantial and more volatile sell-off before wading into the waters.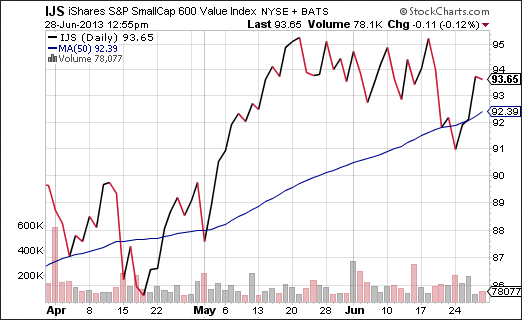
You can listen to the ETF Expert Radio Show “LIVE”, via podcast or on your iPod. You can follow me on Twitter @ETFExpert.
Disclosure Statement: ETF Expert is a web log (”blog”) that makes the world of ETFs easier to understand. Gary Gordon, MS, CFP is the president of Pacific Park Financial, Inc., a Registered Investment Adviser with the SEC. Gary Gordon, Pacific Park Financial, Inc., and/or its clients may hold positions in the ETFs, mutual funds, and/or any investment asset mentioned above. The commentary does not constitute individualized investment advice. The opinions offered herein are not personalized recommendations to buy, sell or hold securities. At times, issuers of exchange-traded products compensate Pacific Park Financial, Inc. or its subsidiaries for advertising at the ETF Expert web site. ETF Expert content is created independently of any advertising relationships.
- English (UK)
- English (India)
- English (Canada)
- English (Australia)
- English (South Africa)
- English (Philippines)
- English (Nigeria)
- Deutsch
- Español (España)
- Español (México)
- Français
- Italiano
- Nederlands
- Português (Portugal)
- Polski
- Português (Brasil)
- Русский
- Türkçe
- العربية
- Ελληνικά
- Svenska
- Suomi
- עברית
- 日本語
- 한국어
- 简体中文
- 繁體中文
- Bahasa Indonesia
- Bahasa Melayu
- ไทย
- Tiếng Việt
- हिंदी
The Great Bond Rotation: Is It True?
Published 06/28/2013, 01:36 PM
Updated 07/09/2023, 06:31 AM
The Great Bond Rotation: Is It True?
3rd party Ad. Not an offer or recommendation by Investing.com. See disclosure here or
remove ads
.
Latest comments
Install Our App
Risk Disclosure: Trading in financial instruments and/or cryptocurrencies involves high risks including the risk of losing some, or all, of your investment amount, and may not be suitable for all investors. Prices of cryptocurrencies are extremely volatile and may be affected by external factors such as financial, regulatory or political events. Trading on margin increases the financial risks.
Before deciding to trade in financial instrument or cryptocurrencies you should be fully informed of the risks and costs associated with trading the financial markets, carefully consider your investment objectives, level of experience, and risk appetite, and seek professional advice where needed.
Fusion Media would like to remind you that the data contained in this website is not necessarily real-time nor accurate. The data and prices on the website are not necessarily provided by any market or exchange, but may be provided by market makers, and so prices may not be accurate and may differ from the actual price at any given market, meaning prices are indicative and not appropriate for trading purposes. Fusion Media and any provider of the data contained in this website will not accept liability for any loss or damage as a result of your trading, or your reliance on the information contained within this website.
It is prohibited to use, store, reproduce, display, modify, transmit or distribute the data contained in this website without the explicit prior written permission of Fusion Media and/or the data provider. All intellectual property rights are reserved by the providers and/or the exchange providing the data contained in this website.
Fusion Media may be compensated by the advertisers that appear on the website, based on your interaction with the advertisements or advertisers.
© 2007-2024 - Fusion Media Limited. All Rights Reserved.