
The ES bears have a slight edge, but they need to move fast.
The S&P 500 has gone into correction mode but the selling has been tepid. The complacent bulls haven't been given a reason to second-guess their bets; if the bears want to make progress, they will want to see something happen sooner rather than later. The longer prices hover in this area the more likely the edge will shift back to the bulls.
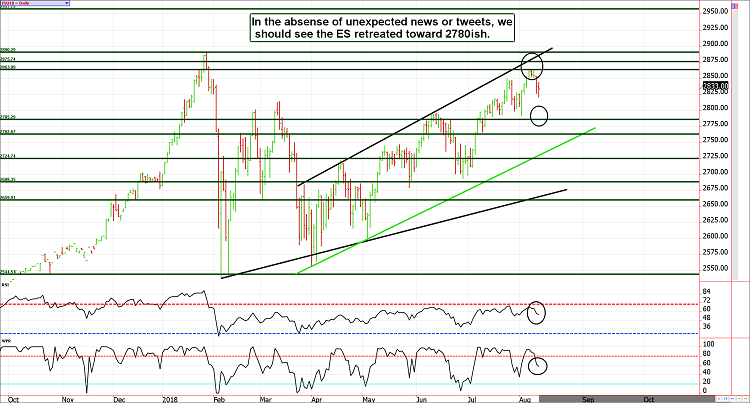
The meaningful economic reports and the bulk of corporate earnings are behind us. From here, the market will have to find a way to stand on its own two feet. In our opinion, the legs of the bull are a little shaky. Assuming we don't receive any surprise tweets or trade tariff resolutions, the ES should creep into the 2780ish area and Treasuries should begin to make their way higher.
Treasury Futures Market
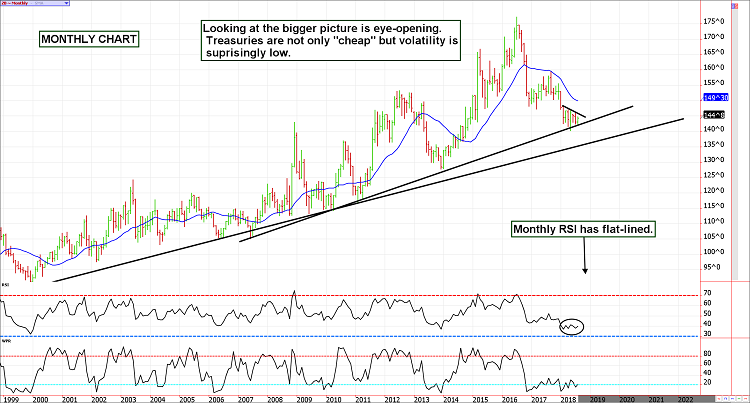
Take a look at the big picture in Treasuries (monthly chart above).
As we outlined last week in the DeCarley Perspective, Treasuries are relatively cheap in regard to global value (yield vs. risk) as well as intermediate-term pricing (high yield). If you missed the report, you can access the archive here:
https://madmimi.com/s/395bac
The weekly ZB (30-year bond) chart is telling. Although this chart suggests prices could go lower, it seems to put a higher probability on some sort of rebound. Technical oscillators are relatively low (near 20 in the William's %R and 40 in the RSI) and have flat-lined. This suggests the upside potential could be large if sentiment turns; furthermore, downward momentum has dried up. It also depicts an environment in which volatility is very low; Treasury volatility (unlike stocks) tends to favor the upside.
We prefer playing the upside in this complex; if you disagree and opt to play the downside please do so with limited risk. If the shorts are given a reason to cover positions, the rally could be stunning.
Treasury futures market consensus:
Seasonals are bullish and there are too many short traders in the market. The volatility risk is to the upside. We are looking for a return to the early-July highs in bonds and notes (for starters).
**Technical Support:** ZB : 142'04, 139'15, and 138'28 ZN: 119'01, 117'31, and 117'21
**Technical Resistance:** ZB: 143'20, 144'22, 145'28 and 146'12 ZN: 120'21, and 121'03
Stock Index Futures Market
The ES has avoided disaster two sessions in a row, but three times could be the charm for the bears.
The S&P 500 has experienced two consecutive trading sessions in which bulls stepped in to stave off the bleeding. However, one has to wonder if the bulls will continue to step up to the plate. We have a feeling that any weakness in tomorrow's session could be met with more selling.
According to the chart, the September S&P should be headed toward the high-2700s. Yet, as we all know the market moves at any trade tariff whim, so always trade with a hedge.
Stock Index Futures Market Ideas
**E-mini S&P Futures Market Consensus:**
The ES correction is underway but it is underwhelming. We continue to think 2775ish is in the cards, but it is important to be prepared for unexpected announcements.
**Technical Support:** 2785, 2762, 2724, 2688, and 2659
**Technical Resistance:** 2862, 2875 and 2890
E-mini S&P Futures Day Trading Ideas
**These are counter-trend entry ideas, the more distant the level the more reliable but the less likely to get filled**
ES Day Trade Sell Levels: 2864, 2875, and 2890
ES Day Trade Buy Levels: 2853 (minor), 2834, 2821, 2793, and 2784
In other commodity futures and options markets...
May 21 - Sell December cotton 100 call and buy the July cotton 100 call as a hedge. The net credit is about $500 before transaction costs.
May 22 - Go long December eurodollar 97.375 calls for about 8 points, or $200.
June 4 - Offset remaining leg of the corn trade (sell the $3.80 put).
June 6 - Buy the September E-mini Russell 2000 1650/1600 put spreads for about 14.00 points or $700 for a maximum risk exposure of $700 before transaction costs and a maximum profit potential of $1800 before transaction costs.
June 7 - Buy a December corn future near $4.01, sell a $4.00 call and then purchase a $3.70 put.
June 11 - Buy November soybean $12.00 call option near 6 cents.
June 15 - Sell December corn $3.70 put to lock in profit, replace it with a long $3.40 put (this is to adjust a currently open position).
June 15 - Go long October soybean meal near $350, sell a $350 call against it and then purchase a $320 put for insurance (net credit should be somewhere around $1200...which is the max potential profit), the max risk is roughly $1,700 depending on fill prices. (All figures before transaction costs).
June 19 - Exit cotton to take a moderate loss.
June 20 - Go long March sugar near 13.00 and then sell a March 13.00 call option against it, with a long September 11.00 put for insurance.
June 21 - Go long the Bloomberg Commodity Index futures contract near 87.00.
June 29 - Sell September 79.00 crude oil call option and buy the August 83.00 call for insurance.
July 11 - Buy back $4.00 corn call option to lock in $1,000 gain per contract before commissions. However, we are largely underwater on the long futures associated with this trade (we recommend holding for now).
July 11 - Exit September crude oil $79.00 call option to lock in a gain of about $420 (but closer to $300 per contract if our insurance expires worthless).
July 13 - Lock in profits on the long October Soybean meal 320 put and the short 350 put, then sell the December 350 put and buy the October 310 put. We are still holding the long futures contract which is sharply underwater.
July 19 - Sell the December gold 1150 put and purchase a September gold 1150 put for a net credit of about $600.
July 26 - Go long the December 10-year note future, sell a November 119 call, and then buy a September 118 put for insurance.
August 1 - Sell a December wheat $6.80 call and purchase a September $6.80 call for insurance. The net credit is about $550.
August 13 - Buy back the December wheat $6.80 call to lock in a quick gain of about 7 cents per contract prior to transaction costs.
(Our clients receive short option trading ideas in other markets such as gold, crude oil, corn, soybeans, euro, yen, and more. Email us for more information)
Carley Garner
DeCarley Trading (a division of Zaner)
Twitter:@carleygarner
info@decarleytrading.com
1-866-790-TRADE(8723)
www.DeCarleyTrading.com
www.HigherProbabilityCommodityTradingBook.com
**There is a substantial risk of loss in trading futures and options.** These recommendations are a solicitation for entering into derivatives transactions. All known news and events have already been factored into the price of the underlying derivatives discussed. From time to time persons affiliated with Zaner, or its associated companies, may have positions in recommended and other derivatives. Past performance is not indicative of future results. The information and data in this report were obtained from sources considered reliable. Their accuracy or completeness is not guaranteed. Any decision to purchase or sell as a result of the opinions expressed in this report will be the full responsibility of the person authorizing such transaction. Seasonal tendencies are a composite of some of the more consistent commodity futures seasonals that have occurred over the past 15 or more years. There are usually underlying, fundamental circumstances that occur annually that tend to cause the futures markets to react in a similar directional manner during a certain calendar year. While seasonal trends may potentially impact supply and demand in certain commodities, seasonal aspects of supply and demand have been factored into futures & options market pricing. Even if a seasonal tendency occurs in the future, it may not result in a profitable transaction as fees and the timing of the entry and liquidation may impact on the results. No representation is being made that any account has in the past, or will in the future, achieve profits using these recommendations. No representation is being made that price patterns will recur in the future.