Fierce indeed and nearly with success, which we think ought swiftly to be in the balance as Gold this past week traded to as high as 1796, leaving just four final points to finally taking The Northern Front (1750-1800), price settling out the week on Friday at 1785. Swiftly to be sure, given Gold's expected daily trading range is at present 28 points, let alone the weekly being 83 points.
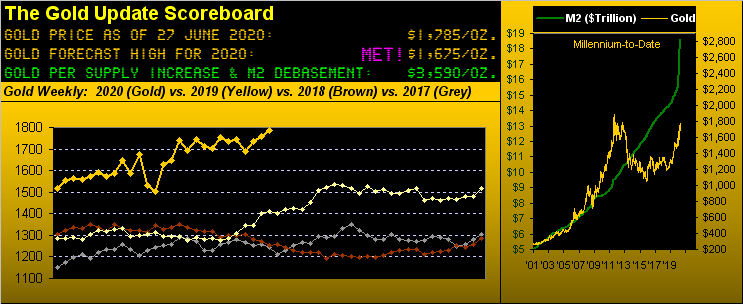
As you regular readers know, in 2020 this is Gold's sixth foray to cross up The Northern Front, the prior five failures dating back to 09 April, the resistance forces within having fought price back down every time. But not this time, so 'twould seem. In the 55 trading days from 09 April through this week's close, Gold has spent 23 (42%) of them engaged in fighting for The Northern Front: and therein, never for more than five days per stint until having just achieved a sixth day in this sixth foray: Hooray! Now upon the ensuing week's open, (barring a gap down sub-1750), 'twill be a seventh day, and come 1800, The Final Frontier (1800-1900) entrée.
Thus let's go straight away to Gold's weekly bars from one-year ago-to-date. And yes, we've at long last blown open the top of the graphic to reveal those defined strata (normally reserved for our month-end missives) along price's long-sought route to 2000:
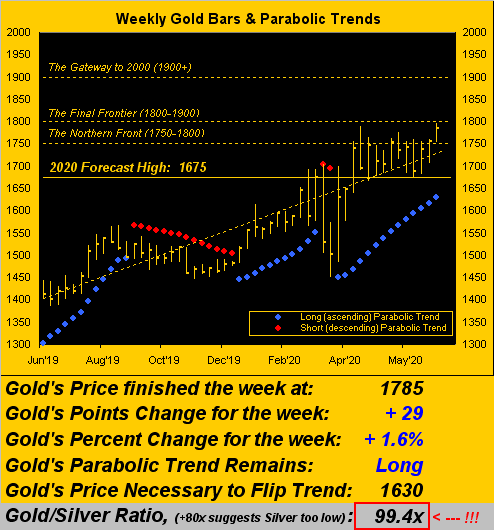
"But don't you think that now you're jinxing it from getting there, mmb?"
Not a superstitious wit, Squire. 'Tis merely (as usual) all about "The When". Moreover, considering by StateSide currency debasement alone that Gold right now (as portrayed in the opening Scoreboard) is valued as 3590, 'twill in the future make the 2000 level (other than being a Big Round Number) having appeared as mere noise.
But in part to Squire's point: assuming Gold shall get to 1800 doesn't mean we're then done with The Northern Front: the resistance forces therein quelled, 1750-1800 merely morphs technically into support (i.e. flip it 'round to 1800-1750). Further, fundamentally Gold has more allies than for which it could ever wish, considerably comprised of the 3Ds: Debasement, Debt and Derivatives. Throw all three of those into yer Osterizer, add in a generous serving of fortified COVID powder, press "purée", et voilà: Gold!
As for The Final Frontier -- and yes Gold has not quite yet breached the 1800 threshold, but clearly can quickly well do -- the resistance from 1800-1900 is far less onerous than we (and our sense is that only we) rightly envisioned made up The Northern Front. To be sure, the latter's range is just 50 points -- indeed 50 very hard-fought points -- whereas that for The Final Frontier is a full 100 points, (1900 being Gold's All-Time Closing High on 22 August, 2011). But after having achieved its All-Time Intra-Day High on 06 September, 2011, so frenetic was Gold's cascade that it spent just four of five days completely contained within the 1900-1800 range, after which the careening and revisiting 'round what would be later dubbed The Northern Front mathematically created seven times as much resistance as we see for The Final Frontier. Thus a less turbulent flight without as much fight awaits us. Still at this writing, The Northern Front has not quite yet been fully won.
But continuing its own winning ways these days is the Economic Barometer, with another large gain in Payrolls expected for June in the new week's big batch of 16 incoming metrics. On balance, the data look to be celebratory for the Independence Day holiday, our markets StateSide being closed next Friday. Here's the Baro:
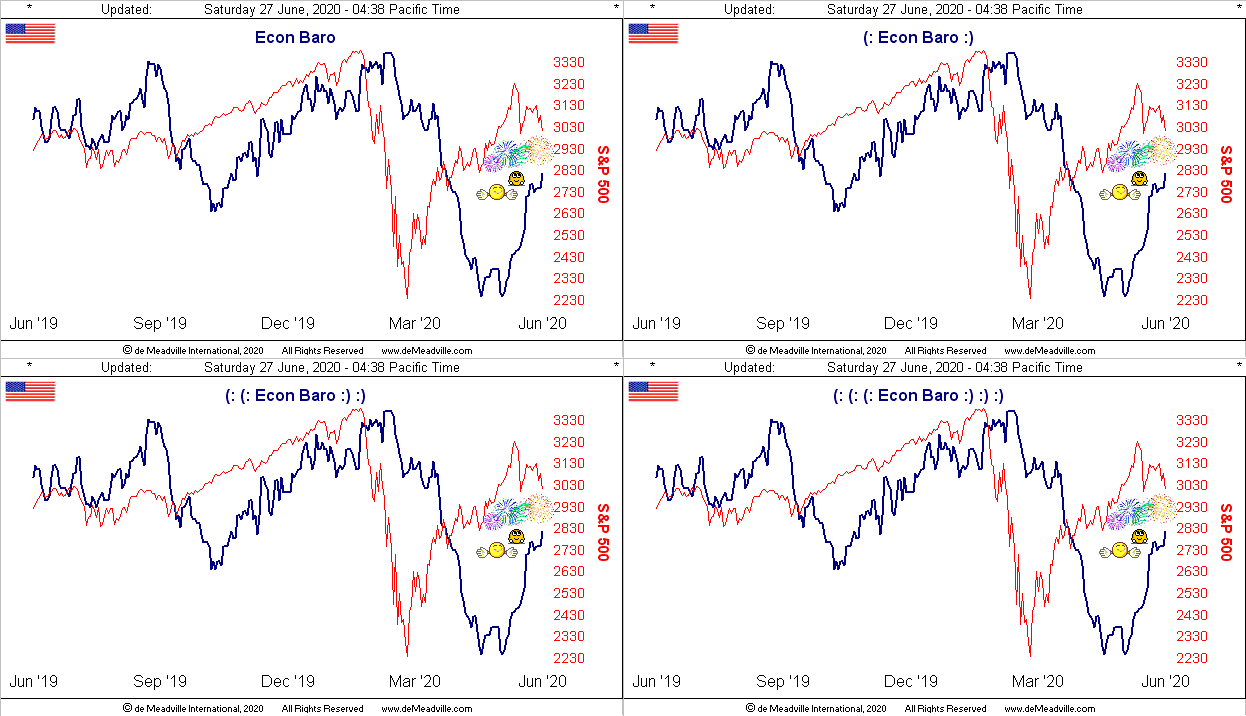
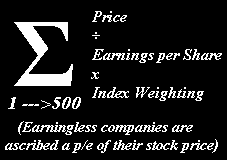
As for the notion of "Who's Leading Whom?", now in its 23rd calendar year, the Econ Baro has comprehensively led the stock market as measured by the S&P 500. However: in the above view from just one a year ago-to-date, the two entities have swapped roles, the S&P clearly charting its major trend changes ahead of those by the Baro. 'Tis a curious thing, albeit the same can be said that neither do earnings justify the current level of the S&P, our "live" price/earnings ratio for the Index at 37.6x. That compiled by Bob Shiller (with whose we're oft near) is not so at 28.2x; Laszlo Birinyi's is at 27.2x; all-knowing Google (NASDAQ:GOOGL) finds it at 23.2x by one source and at 21.6x by another. Regardless, all measures are "high" by B-school standards. And if you're scoring at home by our method, the simple calculation remains:
Meanwhile, in economically furthering the cause for still a higher Gold price, be it by the BOE or the ECB, the BOJ or the PBoC, the central banks' cash pumps remain on, baby! As well, July may see another round of Congressionally-passed stimulus. And why not, as Chicago Federal Reserve Bank President Charles Evans sees a good two years to go before the U.S. economy regains its robust pre-COVID stance. Aptly-named St. Louis FedHead James Bullard is thinking sooner whereas his Cleveland counterpart "Jump Back" Loretta Mester thinks the economic drag shall further pester. Still never shy in taking a more accelerative view, David Solomon (CEO, Goldman Sachs sees a "V" right into 2021, (always fishing for fees in the economic seas). Then from the "Last to Figure It All Out Dept." we've the International Monetary Fund's looking for further Q2 U.S. economic contraction, even as the balance of the Econ Baro's monthly metrics for April, May and June reports have bettered consensus and/or prior period readings. Either way, our humble suggestion to one and all: mind the Baro.
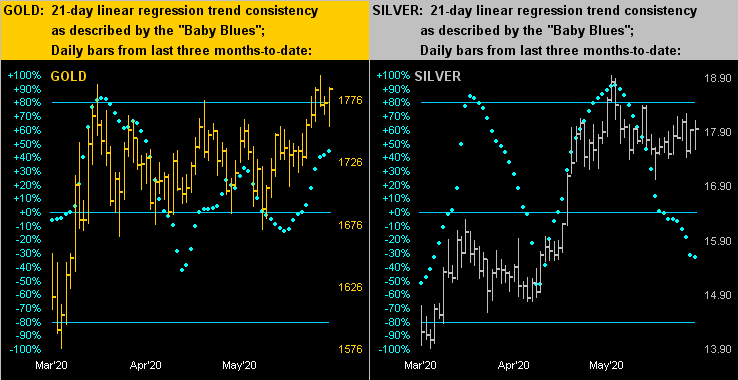
Mind, too, what is going on with the "Baby Blues" as we turn to the two-panel display of the precious metals' daily bars from three months ago-to-date. Clearly, Gold on the left vis-à-vis its rising blues dots of trend consistency shows as more positive than does that for Silver on the right as her blue dots continue their tumble, albeit her price -- which actually appears quite buoyant -- has (yet) to follow. But Sister Silver has been sporting her industrial metal jacket of late, her recent month's track more in sync with the S&P than with Gold.
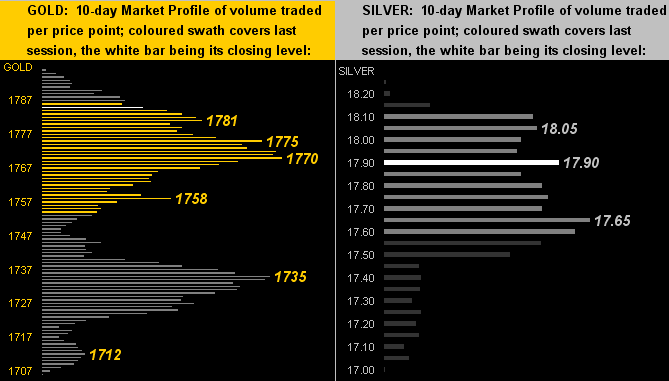
That noted, upon viewing their respective 10-day Market Profiles, both Gold (at left) and Silver (at right) look well-supported per those apices as denoted:
So to wrap it with Gold nearing its taking of The Northern Front toward the threshold of The Final Frontier, it all at present stacks up here:
The Gold Stack
Gold's Value per Dollar Debasement, (from our opening "Scoreboard"): 3590
Gold’s All-Time Intra-Day High: 1923 (06 September 2011)
The Gateway to 2000: 1900+
Gold’s All-Time Closing High: 1900 (22 August 2011)
The Final Frontier: 1800-1900
2020's High: 1796 (24 June)
10-Session directional range: up to 1796 (from 1706) = +90 points or +5.3%
Trading Resistance: (none per the Profile)
Gold Currently: 1785, (expected daily trading range ["EDTR"]: 28 points)
Trading Support: 1781 / 1775 / 1770 / 1758 / 1735 / 1712
10-Session “volume-weighted” average price magnet: 1755
The Northern Front: 1750-1800
The Weekly Parabolic Price to flip Short: 1630
On Maneuvers: 1579-1750
The 300-Day Moving Average: 1526 and rising
The Floor: 1466-1579
Le Sous-sol: Sub-1466
The Support Shelf : 1454-1434
2020's Low: 1451 (16 March)
Base Camp: 1377
The 1360s Double-Top: 1369 in Apr '18 preceded by 1362 in Sep '17
Neverland: The Whiny 1290s
The Box: 1280-1240
Zooming in on the aforementioned Payrolls report due this coming Thursday (02 Jul), on top of the 2.5 million net gain for May is expected an additional 3.5 million for June. As well, ADP's Employment Change is expected to swing from a May loss of 2.8 million to a June gain of 3.8 million. All in the midst of which nonetheless is a weekly first time Jobless Claims estimation for another 1.4 million filings. Quite the state of musical job chairs, 'twould appear! Nevertheless, having fiercely fought, let's look forward to Gold standing upon the 1800 threshold of The Final Frontier!