Front month (Dec) Gold topped 2000 for the 1st time ever. Gold settled out the week below 2000, but not before having made another All-Time High at 2005.
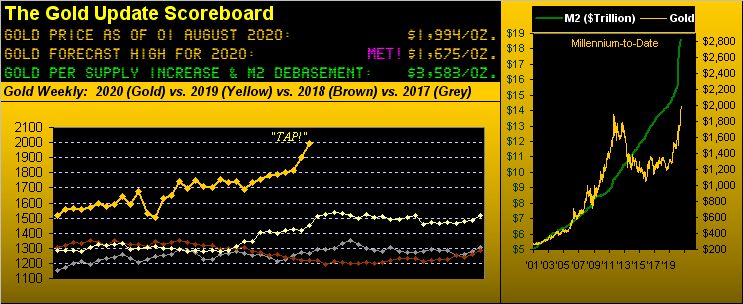
Gold's having tapped Two Thousand is price's most major milestone in history. 'Tis as well a major milestone for The Gold Update. Recall this brief commitment from our 200th Edition as penned a-way back on 14 September 2013:
"... after writing the 100th Edition in 2011, a month following Gold's having peaked at 1923, I gave some thought as to how long I'd keep producing these Saturday missives. I decided 'twould be until Gold reached a price of 2000 or until this 200th Edition, whichever came first. However: The warm, gracious and encouraging testimonials that so many of you have sent my way have only compelled me to now change that to whichever comes second. So: given that Gold will reach 2000 -- let's keep going. Allons-y!..."
Et voilà, now some seven years (and 359 missives) hence, Gold indeed has ~finally~ reached Two Thousand. We can now wipe our hands and say "Our job is done here."
However: Gold has not as yet actually settled out a week above Two Thousand; rather its having only temporarily tapped that milestone seems rather unofficial, non? Thus we shall stay the course ... and upon Gold finally finishing a week above Two Thousand, we shall then have a Big Announcement.
But enough about us. Moreover, let's get into this month-end edition with a tip of the cap to one Kit Jukes (from our old haunt at SocGen, albeit yours truly was long-gone from there prior to KJ's coming on board). Year-to-date, Gold has had a long overdue but nonetheless substantive up run be it measured by days, weeks and/or months. And as is typical, Gold has had very little leading mention in the FinMedia until having broken above 1800 just five weeks ago. Since then, every doggone radio analyst (at least to whom we've listened) has suddenly become a Gold expert in explaining "The Why": none of whom have nailed it, save for KJ, who in Thursday's wee hours (Pacific Time) via Bloomy radio pointed to the Federal Reserve Bank's having issued (in his two words) a "bumper crop" of money. Spot on perfect.
That is the core reason -- indeed "The Why" -- for Gold having so risen. Period. Not because of COVID. Not because of "tomorrow's Fed meeting". Not because of news-dominant China concerns one day that magically vanish the next day. Not because Q2 Earnings Season is horrible (even through the giddiness produced by 81% of the S&P 500's constituents having thus far beaten dumbed-down "estimates"). And in toto, not because of whatever the worry is of the moment. Gold has risen for the one core reason it ought so do: there are more dollars in the system thus meaning they are worth less, (some might say "worthless"). And KJ nailed it in those two words "bumper crop". Period. Moreover, 'tis the very foundation of these missives' opening Gold Scoreboard.
So as dollar debasement abounds, let's go to the year-to-date standings of the BEGOS Markets, led by its two entities that are real money: Silver +37.6% and Gold +31.2%. To say their up runs are "long overdue" is an understatement. And specific to Silver -- which from its 18 March low of 11.640 more than doubled (+125.7%) to its recent 28 July high of 26.275 -- she has been working down the Gold/Silver ratio: now at 81x, 'twas for a time this past week even below 80x, the average since 2001 being 66x. More importantly, with Gold at essentially its All-Time High, Silver still can double (from Friday's 24.630 to 49.260) and yet not quite meet its All-Time High of 49.820 established back in 2011. Do not lose sight of that. Meanwhile, here are the Standings:
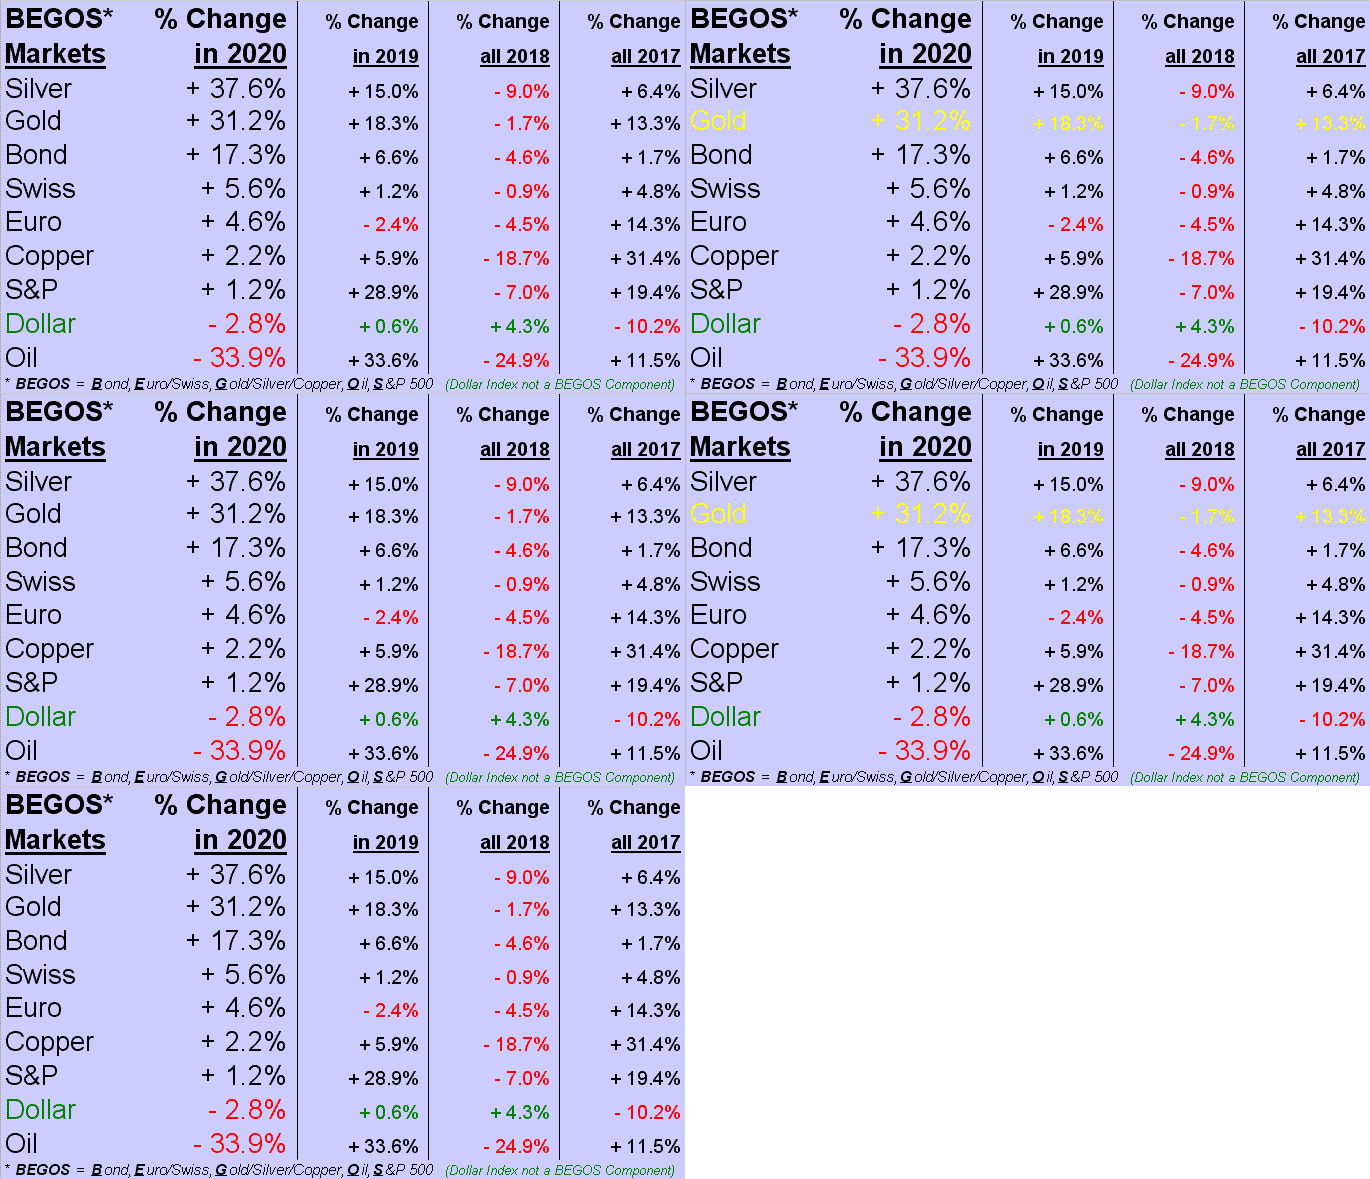
Dollar-wise, or otherwise, whilst 'tis not part of the BEGOS Markets spectrum, we are minding ever so closely the Dollar Index, (-2.8% as listed). 'Tis at present 93.420, this past week having reached its lowest level since May 2018. The 91-to-88 range appears structurally safe for the Buck; but were that to let go, we're thinkin' the run'll be down to 81 ... and whither Gold and Silver given that (!)
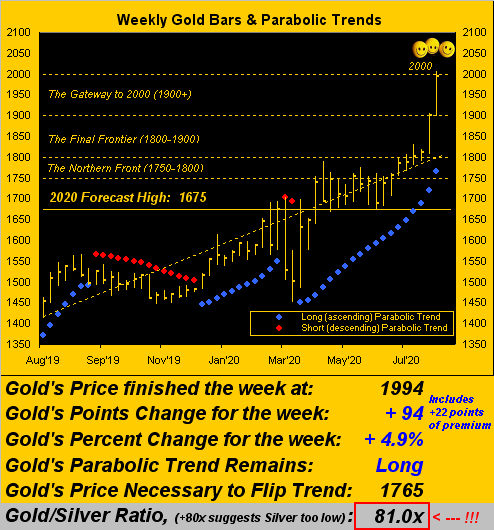
As to Gold's weekly bars from one year ago-to-date, what can we say other than "WOW!" There 'tis, the tapping of Two Thousand. And admittedly, because we chart by the "continuous contract" and given that the trading volume moved this past week from the August contract into that for December (the five-month leap being an annual occurrence at this time), the week's gain of 94 points includes 22 points of fresh premium. As to the accelerating ascent of the blue parabolic Long trend dots, watch for them in completing their 20th week to have crossed above 1800 on this chart in a week's time:
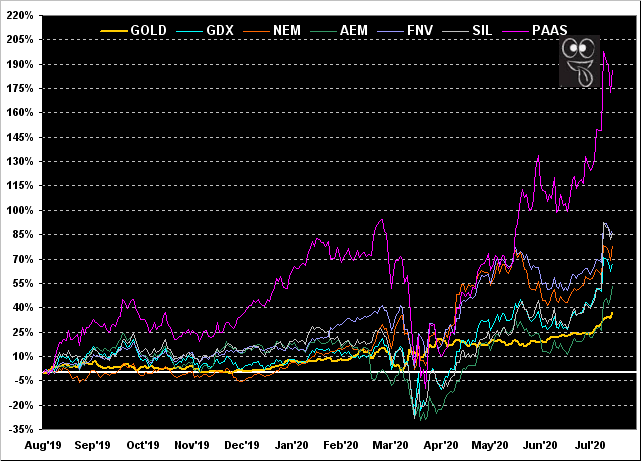
It being month-end (and you precious-metals-leverage-lovin'-equities-elites have been salivatingly waitin' for this one) here, too, from a year ago-to-date are the percentage tracks (in ascending order) of Gold itself +37%, Agnico Eagle Mines (NYSE:AEM) +54%, the VanEck Vectors Gold Miners exchange-traded fund (NYSE:GDX) +67%, Newmont (NYSE:NEM) +79%, the Global X Silver Miners exchange-traded fund (NYSE:SIL) +86%, Franco-Nevada (NYSE:FNV) +88%, and Pan American Silver (NASDAQ:PAAS) ... wait for it ... +187%. Again, "WOW!"
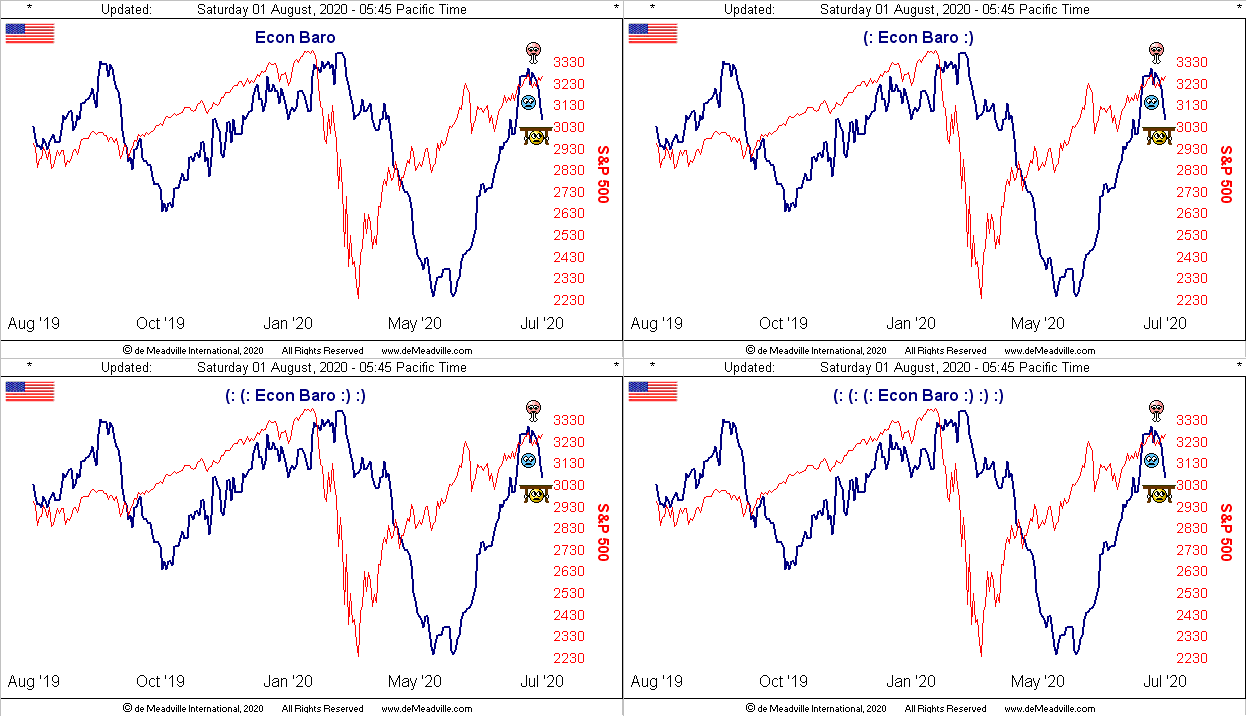
Next we swing over to the Economic Barometer which in getting boffed about during the week -- whilst combined with dovish FedSpeak and Congressional StimuSpeak -- can be construed as Gold-positive. Q2's Gross Domestic Product annualized dump of -32.9% was the lowlight, along with June's declining Personal Income being in no way supported by increasing Personal Spending (Hello Mr. Credit Card). July's Consumer Confidence eroded and first-time Jobless Claims remained well above the weekly one million mark. One bright leading light: the Chicago Purchasing Managers' Index turned expansionary for the first time since August 2019. We'll see in a week's time how the ensuing batch of 15 incoming metrics affect the Baro:
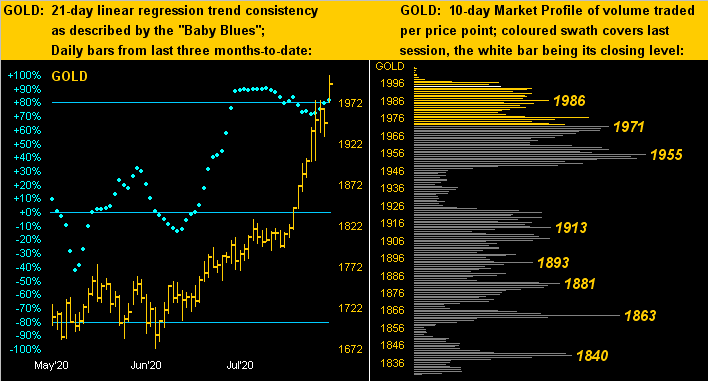
Affecting the increased scaling within our next two-panel graphic for Gold is its soaring price. Per usual on the left we've Gold's daily bars from three months ago-to-date, the baby blue dots of regression trend consistency staving off (for now) falling further below their +80% axis. Meanwhile on the right throughout the 10-day Market Profile continues the vast array of apices:
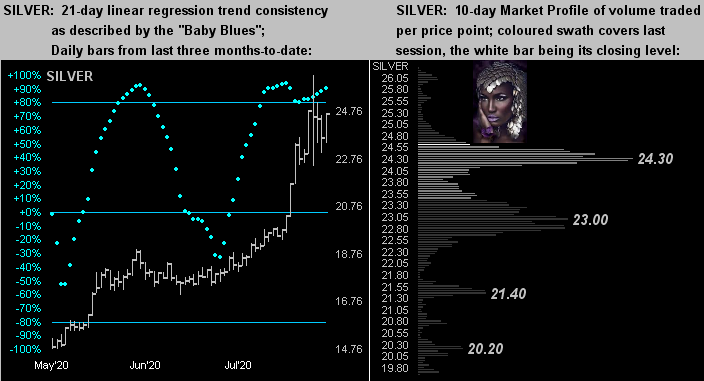
The same setup for Silver finds her price (at left) having at least taken pause following her superb ascent, whilst per the Profile (at right) she sports a two-week range of better than six points: that is more than 2019's entire trading range of five points! From the bottom up, coming to life across her Profile's precious metal pinstripes is our Sister Silver!
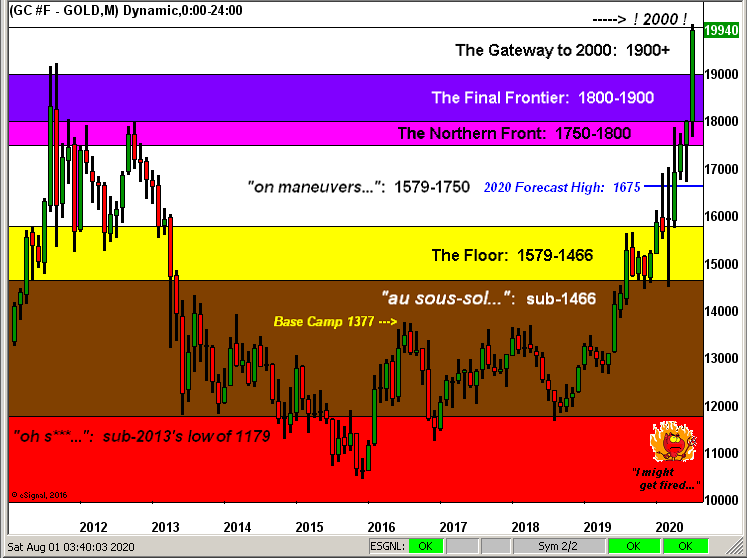
Toward this week's wrap, again it being month-end, here is Gold's Structure with its defined strata. Oh how so many wondered if the prior All-Time High at left would ever again be reached, not to mention having to endure the nastiness from all those nattering nabobs of Gold negativism. (Where are they now? Nursing their bits**t? Who cares.) And as for the wee wanker at lower right, looks like he'll soon be out of job. Print this; frame this, show this!
"Here's to Gold, mmb!" And to you as well, Sir Squire, as faithful a backup and moreover a friend as one could have throughout these 559 weekly missives en route to Gold's having tapped Two Thousand!
Until next week (and our Big Announcement should Gold be settled at 2000+) ...