Or if you prefer: "Abidin' Biden: Buy Gold"
Short-lived as it may become, the Biden era has begun; and regardless of Harris waiting in the wings, ought higher be the price Gold brings. For wealth to withstand, indeed endure, the onrush of that which is negative—specifically Bidenomics—one can abide by Gold.
'Course, such is obvious in preaching to this choir. Yet combined with "the market never being wrong", it may be said the Dollar's debasing demise must already be priced into Gold (as herein mused a week ago). Right?
Wrong! Rather, Gold's attractive price reflects there being just a minuscule percentage of the investing world which outright owns it and/or has some exposure to it.
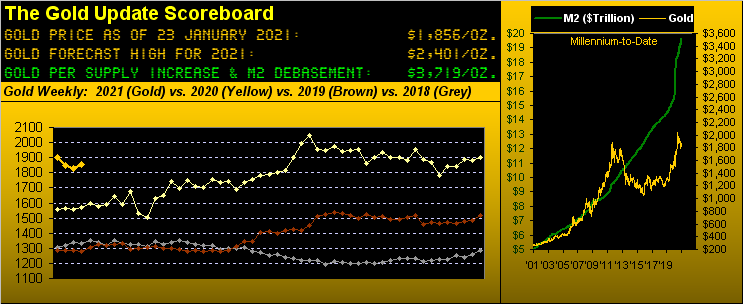
Upon exposure to Gold morphing from minuscule to material, price shall have departed from its present lowly level of 1856, have passed up well through our forecast for this year alone of 2401, to then reach our present Scoreboard valuation of 3719 ... and beyond! (Again, 'tis merely about "the when").
Indeed as a Gold colleague just to the north of us penned this past week, "Biden Will Extinguish The Dollar." Blunt, that. "Got bits**t?" (Just kidding...)
To be sure, the common sense investing world (oxymoron) would expect Gold to at least mitigate the Biden and overall StateSide power-shift by precious metal prices racing upward. After all, certainly so shall taxes and the stagflative cost of living race upward. "Got Oil?" (Not kidding...)
And yet, Gold's remaining severely under-owned simply doesn't find it in play today. Yes, the yellow metal had a fine performance for 2020, +25.1% for the year, and the white metal +48.2%. But 'twould seem those who desire to own Gold already so do, (even with many more yet to own too). The point is: trading in Gold has been at best fair to middlin' even through Washington's transition.
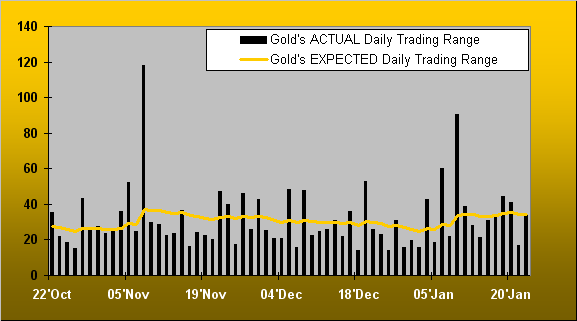
To wit, one of our favourite indicators of interest in a market—be it bullish or bearish—is the extent by which its actual daily trading range (which for you WestPalmBeachers over there is the distance between price's daily high and low) exceeds (or not) that which is expected. Here from three months ago-to-date is Gold's expected daily trading range (line) with each day's actual trading range (bars). And all-in-all it appears average. ('Course for day trader, if you're sufficiently clairvoyant so as to sell the high or buy the low, and you "know" the expected range, you'll be sittin' in the pound seats). Either way, here's the rather benign state of Gold's trading range at present:
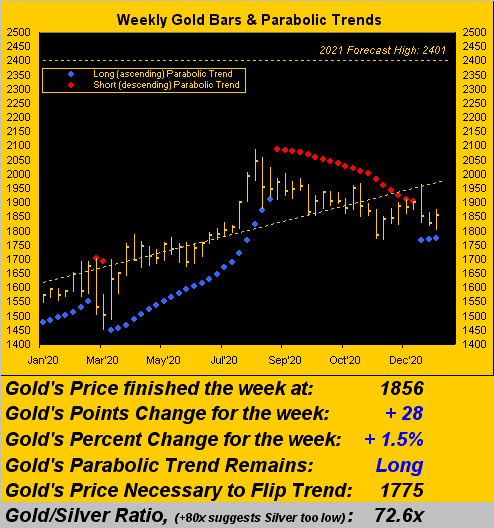
Fortunately, Gold did put in an up week (just its second of the past five) and more importantly strayed away from the underlying parabolic blue dot at 1775, which if eclipsed in the new week would flip the weekly bars trend from Long to Short. (Please perish such thought). Still, 'tis prudent to keep in mind that Gold's weekly expected trading range is 72 points, the rightmost blue dot being 71 points to the south and thus not entirely "out of range". Moreover, the tip of that diagonal trend line is 1976: thus a reversion to that mean from here likely puts price back above 2000 such that the drive to 2401 in 2021 shall rightly be underway:
As for the Economic Barometer, bring on an Inauguration and the Baro gets a bounce. Rainbows and unicorns, baby, or as Grace Slick put it at Woodstock back in '69, "It's the new dawn...":
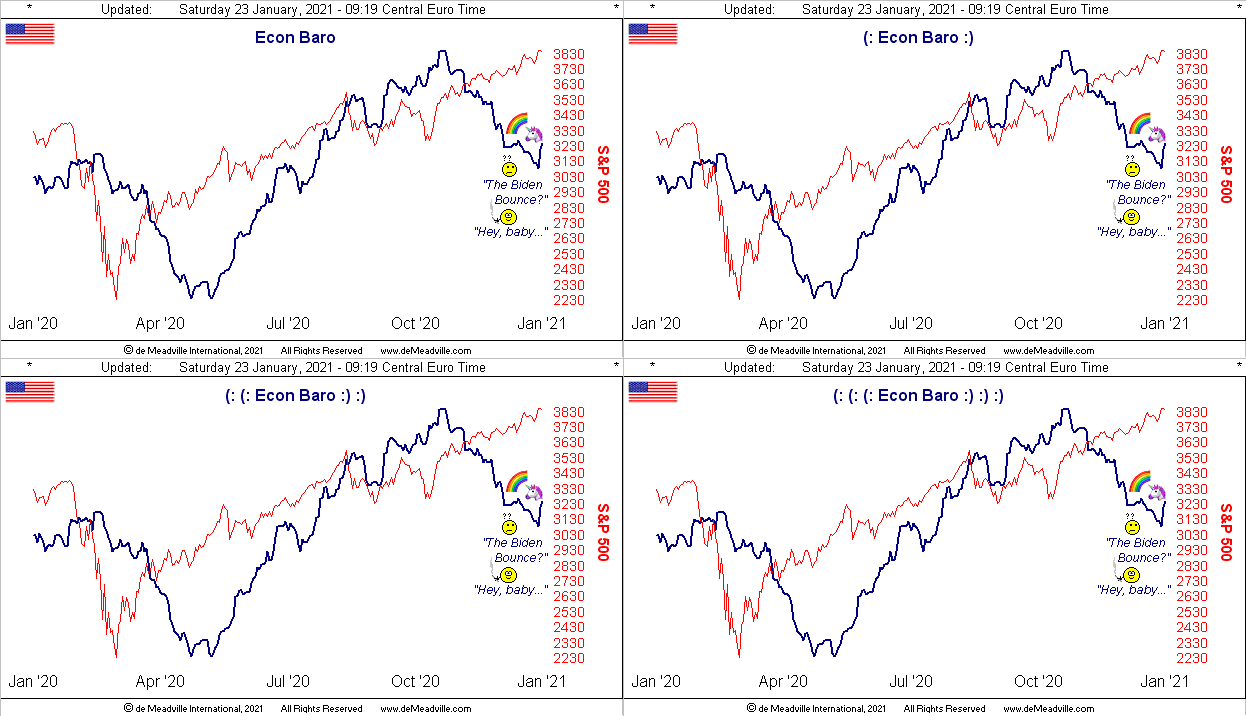
Clearly they're feelin' fine in Philly, the January level of the Philadelphia Fed Index tripling from December's 9.5 to 26.5. Moreover, both Housing Starts and Existing Home Sales worked higher in December, beating consensus along with November's numbers being revised higher still. Lovely how this anticipation of life under "unity" always begins euphorically: Enjoy! Why even the S&P 500 is recording all-time highs, despite our "live" price/earnings ratio being now at 80.9x. But as Q4 Earnings Season kicks into gear, with 47 of the S&P 500 constituents having reported, only 24 of them (just 51%) have improved their bottom lines from Q4 of a year ago...
"So aren't you spoiling the party with that, mmb?"
Squire, you know as well as anyone that across decades of financial writing, never are we prone to unrealistic expectations nor conspiratorial exaggeration. For example, our valuing Gold today per the Scoreboard at 3719 is a merely mathematical exercise that aligns realized money supply growth with that of Gold.
Similar for the stock market as measured by the S&P (notably with respect to the lack of earnings), we repeat that it "is horribly due for a massive crash". 'Tis nothing new. In our lifetime we've witnessed 1987, 1989, 1992, 1998, 1999, 2001, 2009 and now now, (whenever "now" turns out to be). But 'tis nigh.
(Reminder: the overnight limit down on StateSide equity index futures is -7%, which by the S&P is -269 points or -2,170 "Dow" points). "You say it opened far below your stop, Mr. Buckerfaster? Sorry about that. No there's nothing we can do. Please meet your margin call immediately."
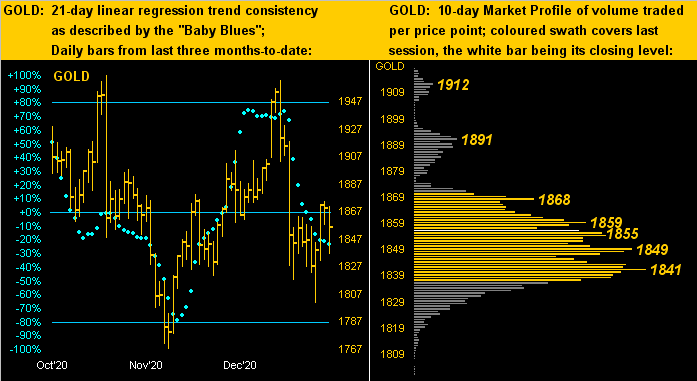
What one can do 'natch is to get Gold, the inevitable reduction of its under-owned nature to well serve the Gold holder. And from the "Buy Low and Hold Dept." we've our two-panel graphic of Gold's daily bars from three months ago-to-date on the left and 10-day Market Profile on the right. The baby blue dots of regression trend consistency are dropping below their 0% axis; however the daily bars are exhibiting some grip. Meanwhile in the Profile, price reveals the supportive trading volume from 1868 down to 1841:
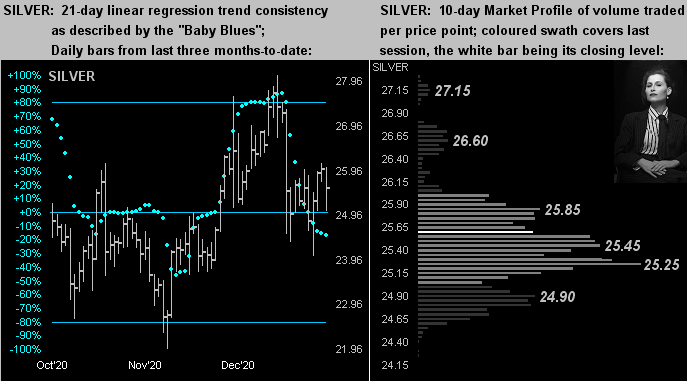
As for Sister Silver, her Daily bars (below left) and Profile (below right) are both similarly shaped to those for Gold. Thus clearly she is adorned in her precious metal pinstripes (rather than in her industrial metal jacket). Lookin' serious there, Sister!
In closing, we've a big week ahead for both incoming Econ Baro metrics and Q4 Earnings, highlighted in the midst of it all by the year's first Federal Open Market Committee Policy Decision. And guess who is back: that's right, our old friend Old Yeller! With Senate passage literally certain, Former Federal Reserve Chair Janet Yellen shall be confirmed as United States Secretary of the Treasury, which means that you can get her autograph right on the Dollar bill, (or what's left of it). And what she said toward receiving unanimous approval by the Senate Finance Committee leads to this Hilarious Headline of the Week (courtesy of Dow Newswires): "The Debt Question Facing Janet Yellen: How Much Is Too Much?"
Are you kidding us? 'Twas already way too much way too long ago!! But sayeth Madame Secretary-to-be: they must "'Act Big' Now to Save Economy, Worry about Debt Later", (thank you Reuters). Thus this appropriate BeaTlesque bit:
"It's only debt and that is all...
...why do I feel the way I do?"
GOT GOLD???
Cheers!