Yesterday it became known that the vote on Brexit in the British Parliament will take place on December 11, on the eve of the next EU Summit. In this way, Theresa May has two weeks to convince parliamentarians of the correctness of her position. Therefore, the focus of the markets moves to the next meeting of the Federal Reserve System, scheduled for December 19. Over the coming weeks, players will regain the expected rate increase, made by the regulator, which could lead to a stronger US dollar. A manifestation of this process is the weakening of a number of developing countries’ currencies, among which can be noted the Brazilian real, recorded as a result of trading on Monday. Following the results of yesterday's trading, the national currency showed the maximum decline over the past year and a half.
On Tuesday morning, the USD/BRL pair is at around 3.9412, which is 0.1200 points higher than the end of last week. The USD/CNY pair quotes again approached 0.9500, which is a consequence of the players' tense in the time of waiting for Summit G 20 results, scheduled for this coming weekend, where will be a meeting of Chinese and US leaders, who are planning to discuss the ways out of the trade confrontation situation.
In the light of the expected strengthening of the US currency, it is important to update the US GDP data for the third quarter. The preliminary value of the indicator is at 3.5%. If the index coincides with the participants' expectations, the American currency may receive an additional impulse for the strengthening.
Today, it is predicted to test the strength of support lines in pairs with the presence of the dollar. The lack of a positive reaction of the British pound to the results of the Sunday Summit of the EU member countries’ leaders, which approved the Draft-Agreement on the British withdrawal from the EU, reflects the awareness of the market-participants about the attending of the document in the national parliament of Britain. As it was repeatedly noted in previous overviews, for a correct conclusion about the end of the US dollar strengthening period, it is necessary to approach the GBP/USD quotes to the area of annual lows located below 1.2700. Today it will be probably possible to observe attempts to implement this scenario. However, in this area there are strong levels of support, which implies a high intensity of struggle between buyers and sellers.
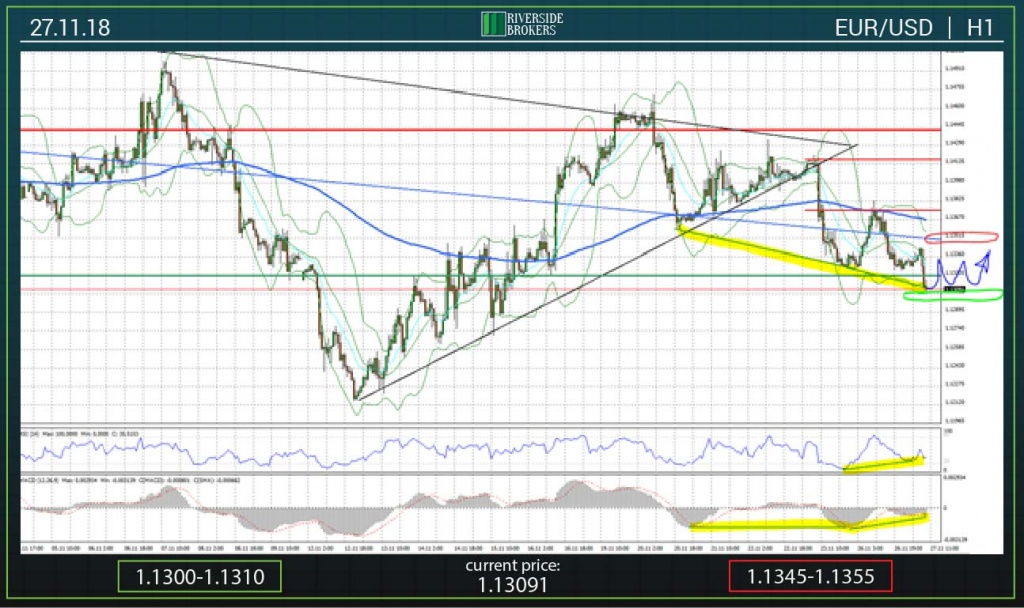
On Monday, the EUR/USD pair pushed down from its 200-period MA on the hourly timeframe around 1.1370-1.1375 and rushed to the support area located just above the 1.1300 mark. The negative dynamics is a consequence of the strengthening of the American currency on world markets in anticipation of the Fed meeting on December 19. However, this movement is accompanied by the formation of a number of corrective signals, namely, the convergence between the local lows of quotations and the corresponding values of the MACD indicator, which suggests a return of prices to the area limited by the above-mentioned moving average and the upper limit of the medium-term channel.
The support zone today is in the area of 1.1300-1.1310 (green oval).
The resistance zone is located in the range of 1.1345-1.1355 (red oval).
GBP/USD
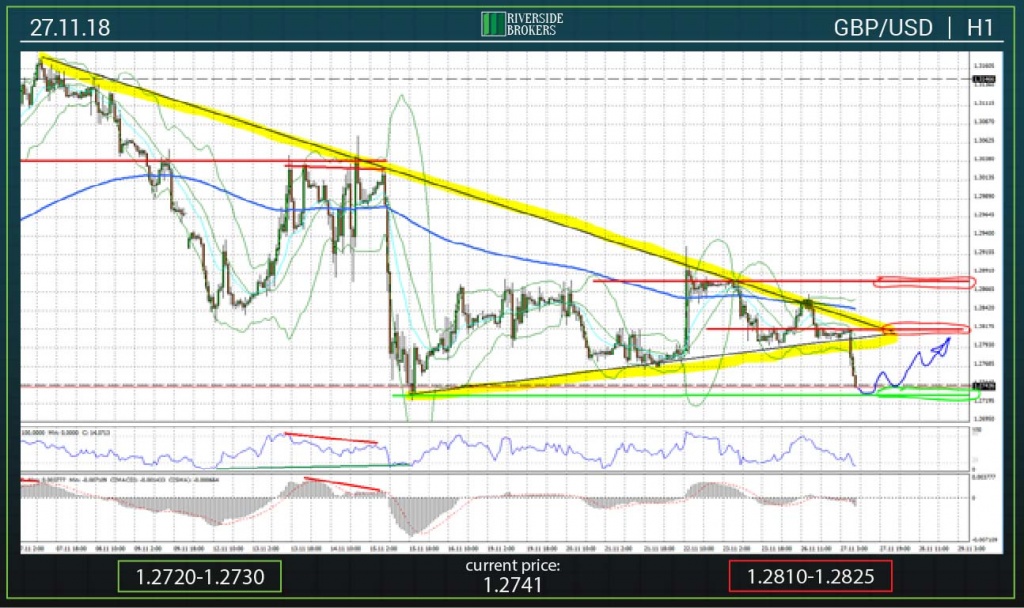
On Monday, the date of voting in the British Parliament about the Draft-Agreement on the withdrawal of Great Britain from the EU was determined - the 11th of December. Under these conditions, the quotes of the GBP/USD pair before the specified date will be sensitive to any information related to the attempts of Prime Minister Theresa May to persuade the non-consenting to their side. At the same time, approaching the date of the last Fed meeting this year reinforces the bulls' attempts on the US dollar to push the quotes of the analyzed pair as low as possible. This morning, prices have broken down the border of the triangle, which was mentioned in yesterday’s overview. Quotes rapidly passed the level of 1.2800 and rushed to the support located in the area of minimum prices on November 15, 1.2735-1.2750. Today, in the absence of important economic statistics and news related to Brexit, it is predicted that quotations will return to the top of the triangle at around 1.2800.
The support zone is in the range of 1.2720-1.2730 (green oval).
The resistance zone is located in the area of 1.2810-1.2825 (red oval).
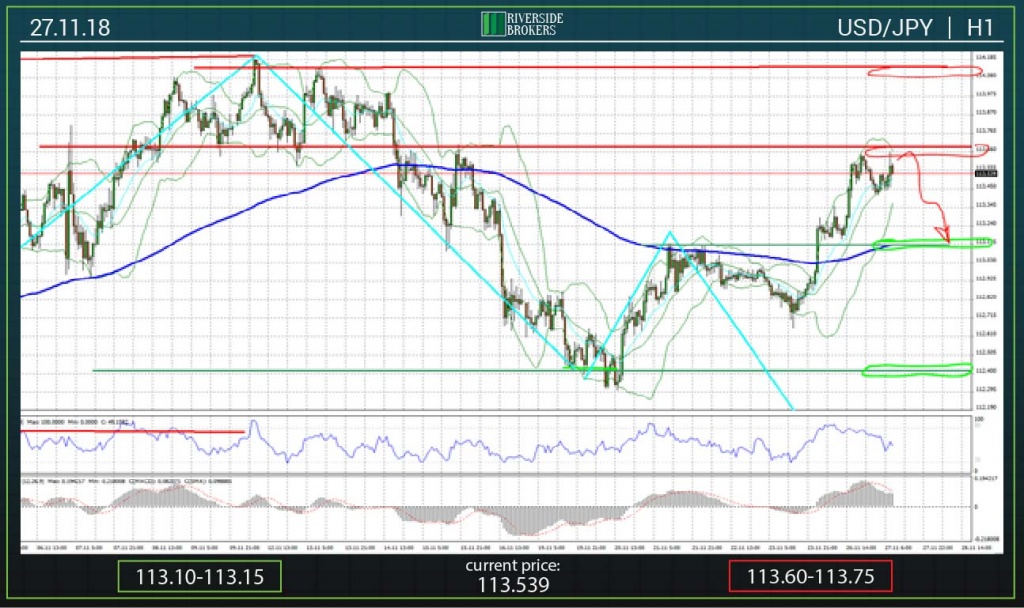
The growth dynamics of the USD/JPY pair quotes led to a breakdown of the “head and shoulders” figure, which was mentioned in previous overviews. Such a scenario was the result of the US currency’ strengthening in the world markets. On Tuesday morning, prices are in the resistance zone in the area of 113.55-113.70. Today is expected the return movement of quotations with the purpose to decrease in the area just above the 113.00 mark, through which passes the 200-periodic MA on the hourly time frame. Besides that, in the specified area there are maximum prices observed on November 21-22, which indicates a certain strength of this support zone.
The support zone is the range 113.10-113.15 (green oval).
The resistance zone is located at 113.60-113.75 (red oval).
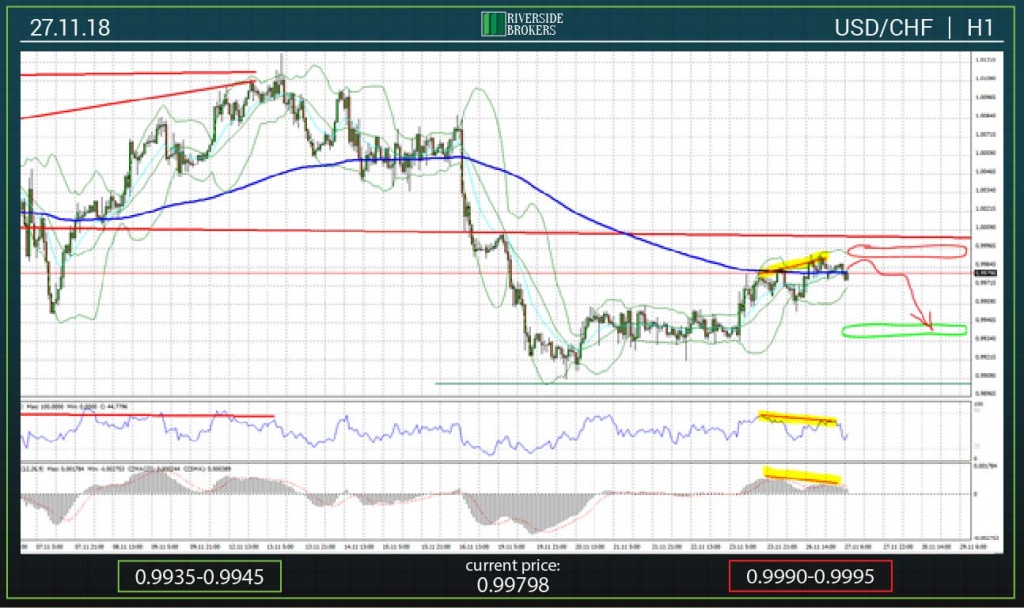
According to the results of yesterday's trading of the USD/CHF pair from a technical point of view, a divergence signal was formed between the local highs of prices and the values of the RSI and MACD indicators (highlighted in the chart with a yellow marker). Based on this, it is predicted a correctional downward price movement. Quotes will push off from the 200-periodic MA, passing through the mark 0.9980 and begin to decline to the support zone, located in the area of 0.9935-0.9945 (green oval).
Resistance is the range 0.9990-0.9995 (red oval).
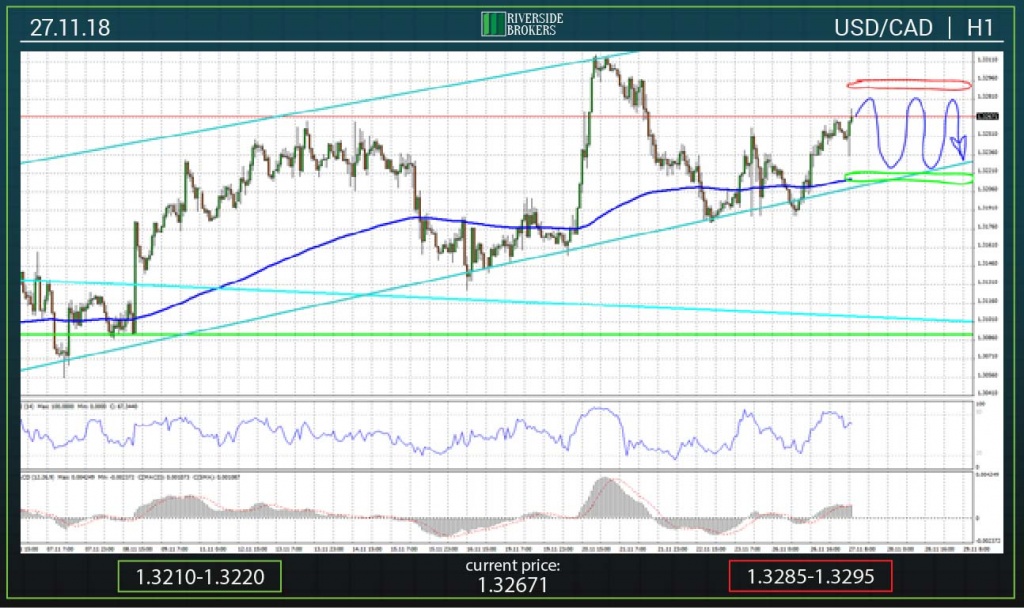
Today, it is expected that the quotes of the USD/CAD pair will maintain the values reached in the morning hours of Tuesday in the area of 1.3250-1.3265. The pair is bounded below by the border of the medium-term channel, located just above the 1.3200 mark. From above, price fluctuations run into a resistance zone in the region of 1.3280-1.3295, in which the pair was trading on November 21.
The support is around 1.3210-1.3220 (green oval).
The resistance is located at 1.3285-1.3295 (red oval).
Gold
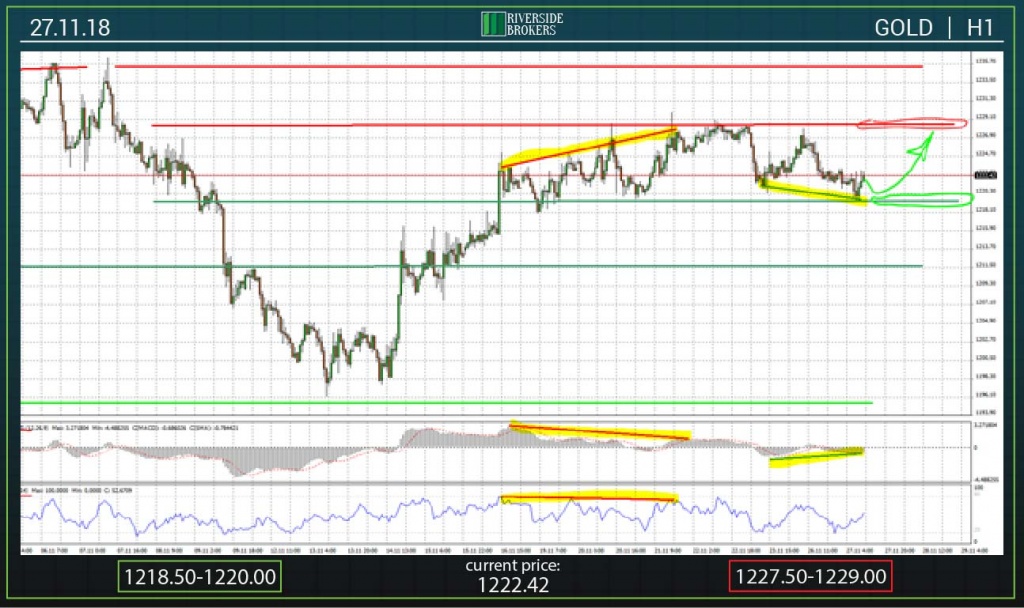
On Tuesday morning, gold prices briefly broke down the mark of 1220.00, which is a consequence of the strengthening of the US dollar and the negative dynamics of commodities in such conditions. However, the decline in prices is accompanied by the formation of convergence between the local lows of prices and the corresponding values of the MACD indicator. Based on this, it is expected the return of the quotes to the resistance zone located in the area of 1227.50-1229.00. It should be noted that in the medium term, in the light of the expected strengthening of the dollar and on the eve of the December Fed meeting, gold quotes are unlikely to start a confident increase, which was predicted by many analysts. The beginning of the growth dynamics can be seen only in the last trading session of December.
Support zone today is located in the area of 1218.50-1220.00 (green oval).
Resistance is still present in the range of 1227.50-1229.00 (red oval).
