
US equity futures rallied after the closing bell as Trump staged a decent comeback in the race to win a second term as a US President. The reaction in the US dollar was an overnight rally, although the currency was found overall lower against most of the other G10s. The final outcome is unlikely to be known today, and thus, we expect investors to keep their gaze locked on headlines and news surrounding the election.
Markets To Stay Linked To A Too-Close-To- Call Election
The dollar traded lower against the majority of the other G10 currencies on Tuesday and during the Asian morning Wednesday. It underperformed the most against AUD, NOK, GBP, and NZD, while it gained some ground versus JPY. The greenback was found virtually unchanged against CAD.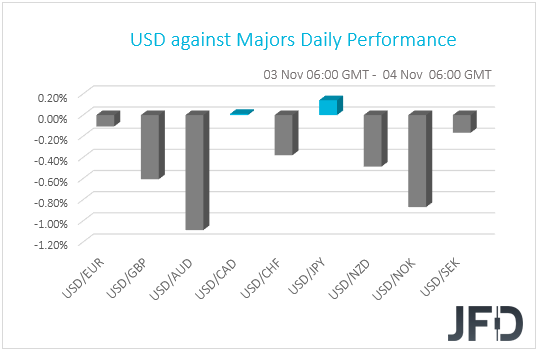
The weakening of the US dollar and the yen, combined with the strengthening of the Aussie and the Kiwi, suggests that markets traded in a risk-on manner. EU stocks were a sea of green, with major indices gaining more than 2% each as investors anticipated a clear win for Democrat Joe Biden in the US election, something that could lead to a better trade relationship between the EU and the US.
Wall Street also closed higher, with futures rallying in afterhours due to Trump staging a comeback. The reaction in the US dollar was a rally, while in Asia, although Japan’s Nikkei 225 and South Korea’s KOSPI were decently up, China’s Shanghai Composite and Hong Kong’s Hang Seng gained only 0.19% each.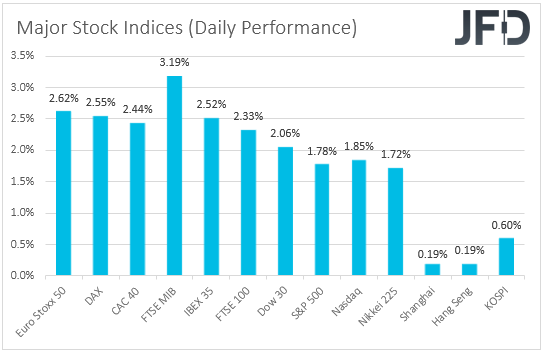
Remember that, ahead of the election, we noted that a Trump victory could prove positive for US indices, but not for stocks elsewhere. We also said that due to the fact that Biden’s fiscal agenda is looser than Trump’s, the dollar could strengthen if Trump gets re-elected. Indeed, when Trump staged a comeback, the dollar rallied, while the Mexican peso and the Chinese yuan slid. The Aussie and the Kiwi, although they were found higher this morning, were hit from Trump covering lost ground, perhaps due to speculation that the tensions between the US and China may continue in case he keeps his throne. Remember that Australia and New Zealand have very close trade ties with China.
Having said all that though, the final outcome is unlikely to be known today, with several key states, like Wisconsin, Michigan and Pennsylvania saying that they will announce results later in the week. At the moment, Joe Biden leads Trump by 224 to 213 electoral votes in a race to win 270. With a tight contest, we believe that markets will stay focused and linked to headlines surrounding the US election for the rest of the week. If Biden wins more states, equities around the world may gain on expectations of a better handling of international trade, but due to his pledge to increase corporate taxes in the US, Wall Street may not react in a similar fashion. His extra-loose fiscal agenda may result in a slide in the dollar, while his handling on trade may help risk-linked currencies like the Aussie and the Kiwi. As we already noted, the opposite may be true in case Trump is seen victorious.
NASDAQ 100 Technical Outlook
The cash index of NASDAQ 100 popped higher overnight and made its way above a short-term downside resistance line taken from the high of October 13. Now we are seeing the price correcting a bit lower, however, if it continues to float above the 200 EMA, which is near the 11468 hurdle, marked by the high of October 29, that could attract the bulls back into the game again. That said, given that there are no final US election results available at the time of writing, we will take a very cautiously bullish approach, at least for now.
If the index does drift a bit more to the downside, but struggles to get below that 200 EMA on our 4-hour chart, the buyers might step in again and drag NASDAQ 100 higher. If so, the price may rise to the 11706 hurdle, which is the high of October 26, or to the 11800 hurdle. That hurdle marks the low of October 16 and the high of October 20. If the buying doesn’t end there, the next potential resistance area to consider could be at 11962, marked by the high of October 19th.
In order to shift our attention to lower areas, we would prefer to wait for a move back below the aforementioned downside line and also a price-drop below the 11225 zone, marked by the high of November 2 and an intraday swing low of November 3. This way we may start looking at a possible test of the 11138 obstacle, a break of which could clear the path to the lowest point of October and the current lowest point November, at 10955.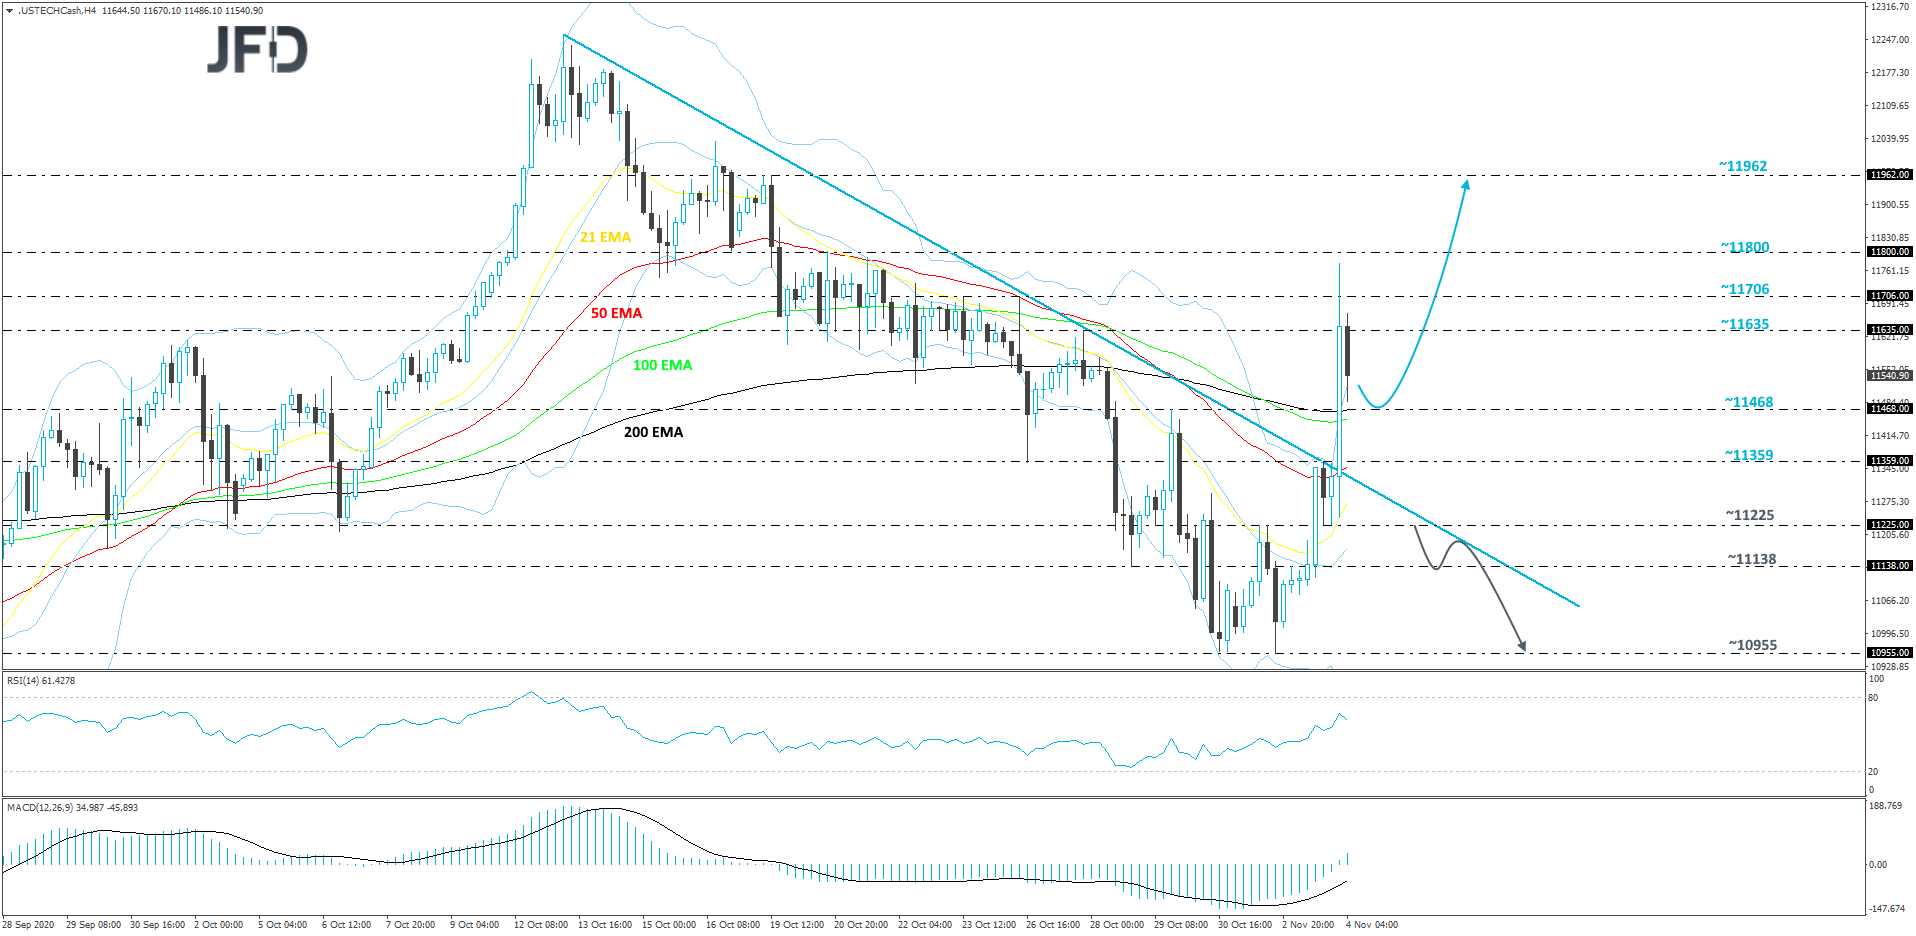
USD/CHF Technical Outlook
USD/CHFcontinues to trade this morning in an undecisive manner. Yesterday, the pair broke below its short-term upside support line drawn from the low of October 20th and today the rate is back above it. Most likely traders are waiting for some clarity in the US election results. Until then, USD/CHF could continue moving sideways, hence our neutral stance for now.
If the pair pops above the current high of November high, at 0.9208, that would confirm a forthcoming higher high, potentially opening the door towards higher areas. USD/CHF could then travel to the 0.92180 obstacle, or even to the 0.9245 territory, which is the peak of September 30. The rate might stall there for a bit, but if the bulls are still active, they may push the pair slightly higher, towards the 0.9255 level. That level marks the intraday swing lows of September 25 and 29.
On the downside, if the rate slides below the 0.9089 hurdle, marked by the current low of today, this may open the door for a further decline. More bears might join in and send the pair towards the low of October 27, at 0.9061. If that area is not able to withstand the bear pressure, the next possible support level might be at 0.9030, which is the lowest point of October.
As For Today's Economic Release
We have the final services and composite Markit PMIs from the Eurozone, the UK and the US, but as it is the case most of the times, they are expected to confirm their initial prints. The US ISM non-manufacturing index and the ADP employment report, both for October, are also due to be released. The forecast for the ISM index points to a small decline, to 57.5 from 57.8, while the ADP is expected to report a 650k jobs gain, after September’s 749k.
With regards to the energy market, we get the EIA (Energy Information Administration) report on crude oil inventories for last week. Expectations are for a 0.890mn inventory build after a 4.320mn increase the week before. Nonetheless, bearing in mind that the API (American Petroleum Institute) reported an 8.010mn barrels slide, we would consider the risks surrounding the EIA forecast as tilted to the downside.