
Yesterday's Fed statement drove stock lower, but did the overnight slide tick all the boxes so far – that's the question to ask. And why exactly did the market get so disappointed with the FOMC moves? I'll answer these questions in today's analysis, and lay out the prospects for the stocks ahead.
S&P 500 in the Short-Run
Let’s start with the daily chart perspective of the S&P 500 (charts courtesy of http://stockcharts.com ):
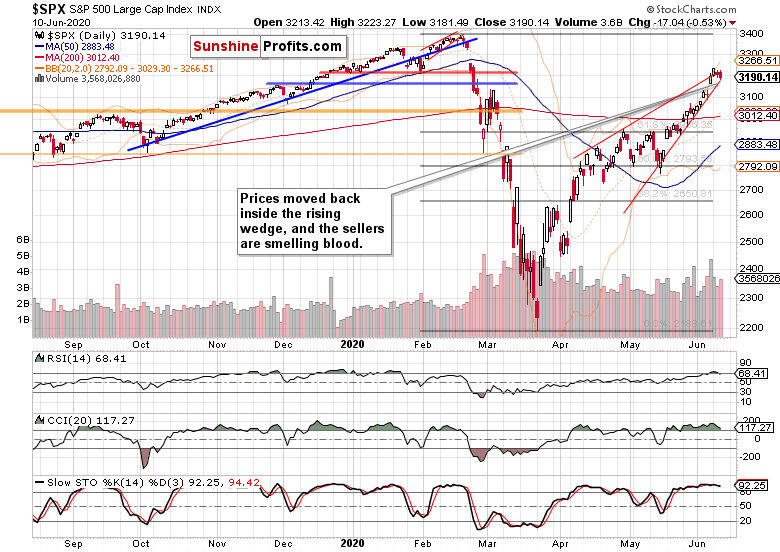
Well before going into the Fed policy statement, signs were there that the bulls aren't at their strongest, and I took profits from the open long position off the table. Since then, the S&P 500 went largely sideways until the Fed moment came. The following spike higher attracted the bears' interest, and stocks gave up all of their momentary gains. What exactly did the Fed say that it drove stocks that much lower in the overnight trading?
I expected them to not rock the boat – so, did they do it actually? Offering a sober assessment of the economy, they aren't looking to raise rates any time soon, and will keep the wheels greased. No surprise here.
But there are two things hanging in the air, one of which depends on the Fed, while the other doesn't.
I've written quite a few times lately about the rising Treasury yields. Rising yields translate into falling Treasury prices, and it raises the prospects of yield-curve control arriving. Yield caps could indeed be coming. Quite logical if you consider that the Treasury needs to finance ever larger deficits.
When the economy expands, or is expected to regain footing as is the case currently, and money flows from bonds into stocks, the S&P 500 is rising, while Treasuries see rising yields that translate into declining bond prices. That's what we have seen in the run-up to yesterday's Fed.
Rising yields are a sign of belief in the recovery story, but when Powell reiterates fears of stubborn corona consequences and that he stands ready to expand the balance sheet to infinity should they rise too much, that certainly dampens the bullish spirits in stocks. And yesterday's action in both shorter- and longer-dated Treasuries (IEI, TLT, respectively) have shown ]the market isn't willing to bet against the Fed right now.
Against this background, paring some of the recent gains in stocks is understandable, especially when we consider the second factor that is outside of the Fed's control.
As the riots proceed, coronavirus made a comeback into the headlines. The fears of the second wave in the U.S. are here. This is likewise working to keep the risk appetite at bay.
Are the stock bulls panicking, with prices getting ahead of themselves in their downside move?
Before answering, one more thought about low yields and stocks. Once a recessionary shock is over (not getting worse) and inflationary pressures of the moment are still low (forget about the forward-looking inflationary expectation – they're not manifest in the real economy just yet), stock prices and bond prices tend to move hand in hand. The real economy is far from its potential output, and isn't overheating just yet.
Tick, that's what we're facing right now. That's why low yields are a good companion of a stock bull market. Remember, bonds top first, stocks next, and finally commodities. As we haven't seen a top in Treasuries just yet, the stock bull market peak is even farther off.
As promised, let's check now whether the stock bulls are panicking or not.
The Credit Markets’ Point of View

High yield corporate bonds (HYG) refused to move any lower yesterday, but by the same token, they didn't rise either. The daily indicators are almost in unison on sell signals, so caution is warranted before calling the bonds stabilized. Needless to say, I continue to think we have still a bit more to go before seeing corporate bond prices above Friday's highs.
This is the shape of both the above-mentioned leading credit market ratios.

The more risk-on one (HYG:SHY) is still leading the downswing, and unless it edges higher, it's a red flag. As I wrote yesterday:
"(…) The animal spirits are thus likely to get tested relatively soon, with perhaps today's Fed monetary policy statement and conference being the catalyst. Or Friday's inflation expectation figures could play that role."
Either way, unless credit markets recover, stocks are in the short-term danger zone.
Next, I showed you the following chart with overlaid S&P 500 prices.

Stocks are still vulnerable in the short run, as I mentioned yesterday:
"(…) Stocks are kind of hanging out there in the short run, and the degree of relative extension makes me think that the stock upswing isn't likely to proceed with its previous momentum before taking a pause first."
What about the S&P 500 sectoral moves?
Key S&P 500 Sectors in Focus
Technology (XLK) closed at new 2020 highs but gave up half of its intraday gains, while healthcare (XLV) finished not too far from its Tuesday's closing values. Financials (XLF) certainly led the downswing in the S&P 500 heavyweights.
Energy (XLE), materials (XLB) and industrials (XLI) moved sharply lower yesterday, which is not a good short-term omen for the bull run.
As pointed out in yesterday's analysis:
(…) unless the credit markets get their act together, the short-term risks for stocks are getting skewed to the downside. That could be amplified by the USDX taking a breather after the recent sea of red.
The DXY breather is underway, as the greenback is finally making a move from its short-term lows. How vigorous that turns out to be, would put to test the stock market bull run. Remember, since WWII ended, we've seen only one market rally above the 61.8% Fibonacci retracement that was followed by a plunge below the prior bear market low.
And I fully expect that the March 23 lows won't be challenged, let alone broken.
Summing up
The Fed provided the catalyst for stocks to move down, and neither the credit markets, nor the sectoral analysis show signs that this correction is already over. Small caps in the Russell 2000 (IWM) are leading the downside move, which coupled with the earlier DXY move, raises short-term risks for stocks. Even accounting for today's premarket action, I still say short-term – the narrative of reopening optimism is only now being challenged by yet another down-to-earth Fed real economy assessment and returning coronavirus fears. The credit markets will show us how far the bulls are really willing to retreat.