Winners across the board
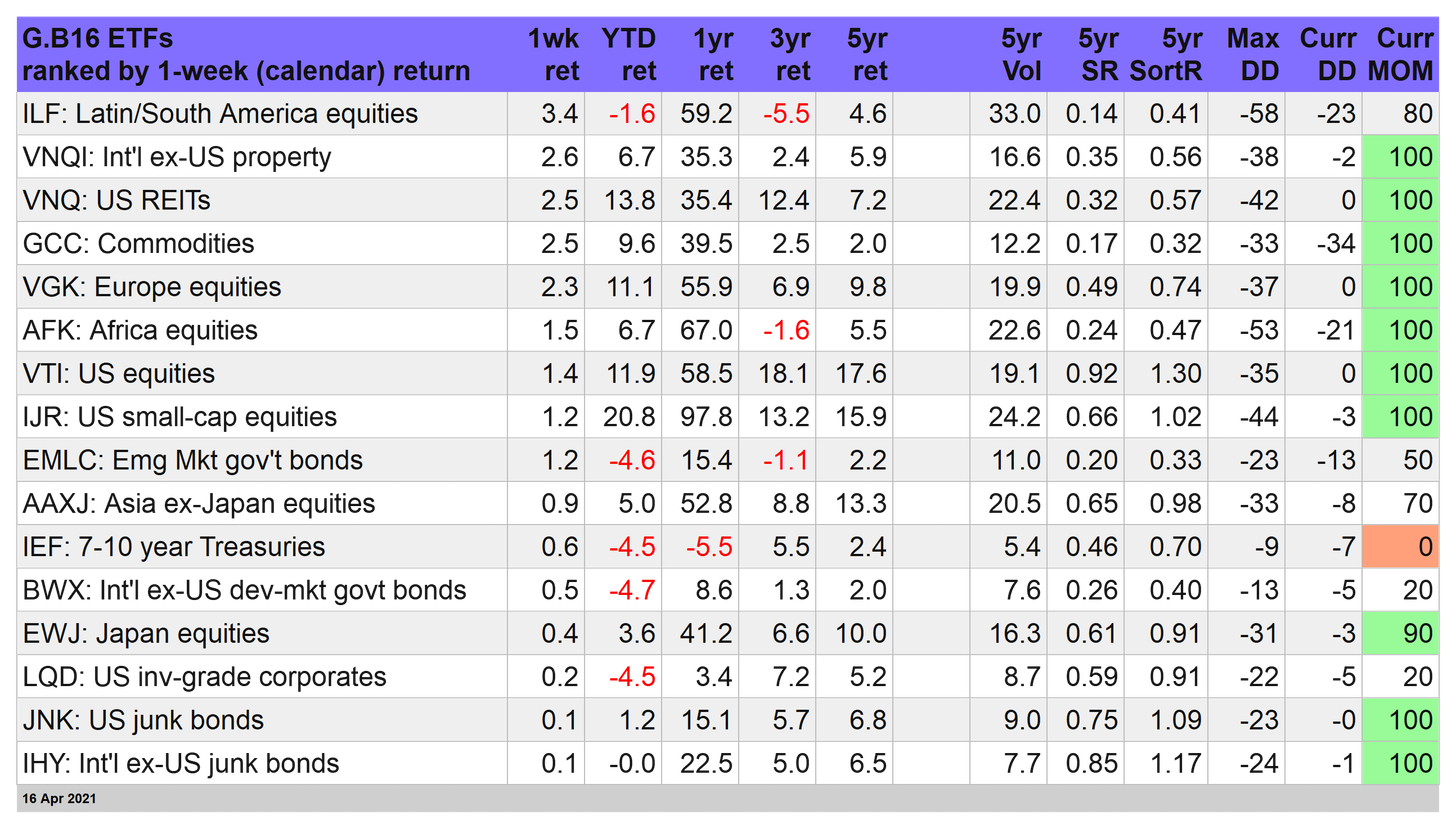
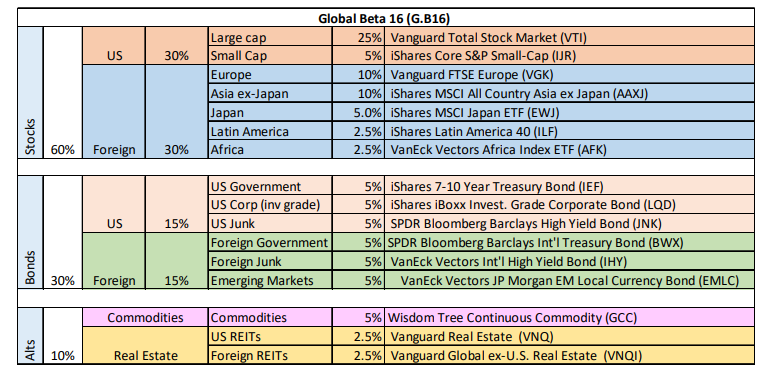
Red ink was banished for weekly returns through Apr. 16 in our 16-fund global opportunity set that represents the major asset classes. Leading the rally: shares in Latin America.
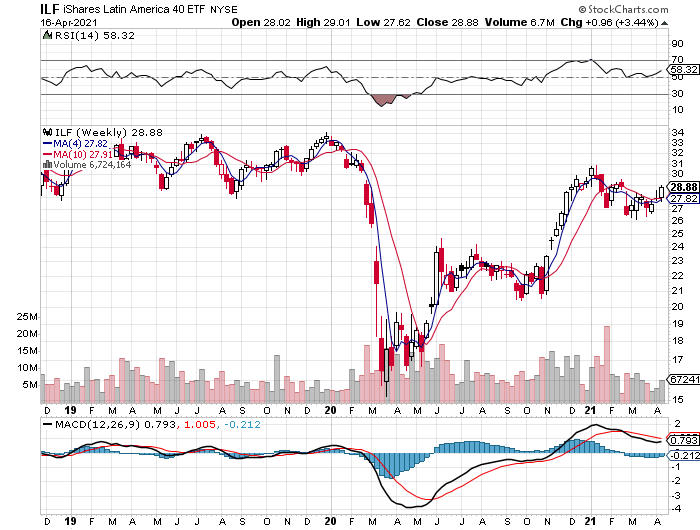
The iShares Latin America 40 ETF (NYSE:ILF) popped 3.4%. Impressive, but the fund still looked like it was caught in a trading range and so we’ll need to see more upside action to argue there’s more than noise here.
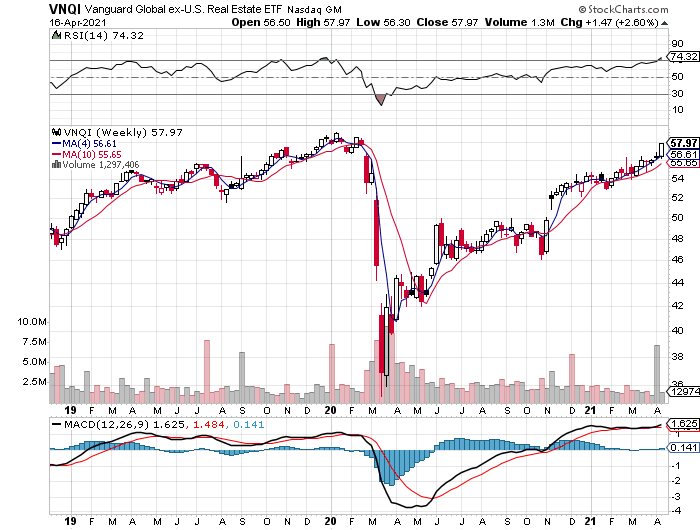
More impressively: foreign real estate shares posted the second-strongest weekly gain. Vanguard Global ex-U.S. Real Estate Index Fund ETF Shares (NASDAQ:VNQI) rallied sharply, rising 2.6%. The gain looked like a breakout move as the fund moved closer to its pre-pandemic high.
Since November, VNQI has been quietly but persistent trending higher. The only difference last week: the upside bias is no longer quiet.
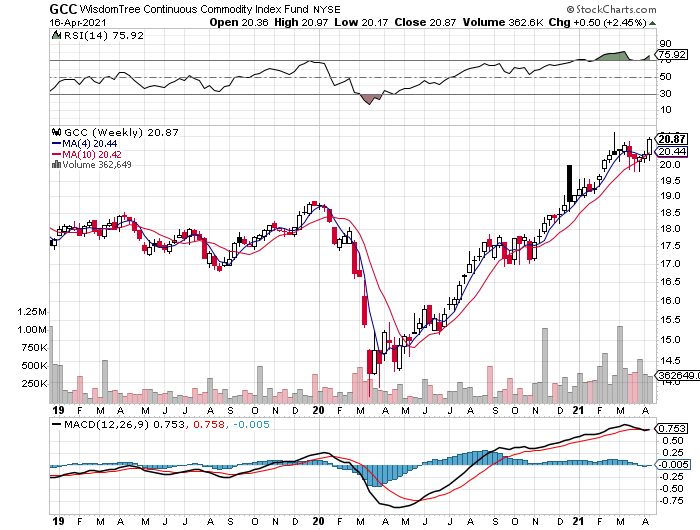
Speaking of breakouts, commodities appeared to be dancing this jig too. WisdomTree Continuous Commodity Index Fund (NYSE:GCC), a broad, equal-weighted mix, jumped 2.5%. That put the fund near its previous high in February. If GCC takes out that peak, the ETF will trade at a six-year high.
Another notable development in markets last week: Treasuries were no longer sliding… again.
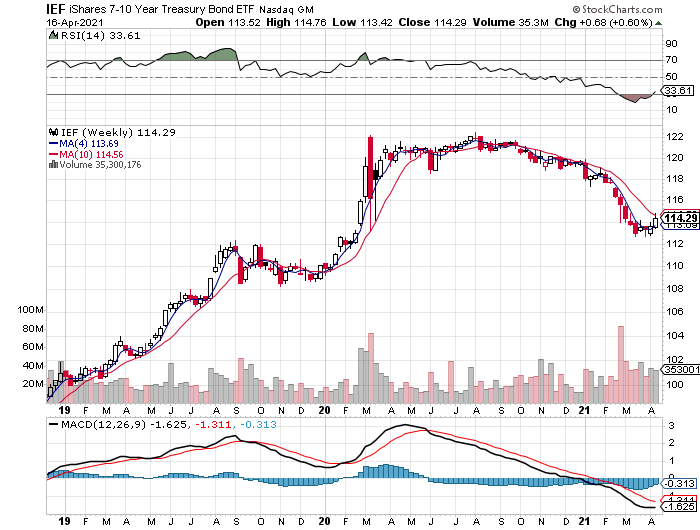
The iShares 7-10 Year Treasury Bond ETF (NASDAQ:IEF) posted its second straight weekly gain. Thanks to another week of falling interest rates, bonds generally rebounded after months of trending down.
It’s unclear if rates will continue to slide, but bond bulls can argue that it’s encouraging to see fixed income rally during a week that delivered news of sharply stronger inflation and sizzling retail spending for March.
Is this a clue that the reflation trade has run its course and that a secular rise in inflation is still a low probability? It’s a bit easier to answer in the affirmative given last week’s bond-market action.
Nonetheless, our proprietary momentum profile for IEF (via the MOM ranking in table above) remains deep in the hole—scoring a zero (still), the deepest bearish print for the entire 16-fund opportunity set. In short, there’s still a long way to go to convincingly reverse the bearish tide that's dominated bonds in recent history. For details on all the strategy rules and risk metrics, see this summary.
US stocks joined the party; actually, US shares never left the revelry. In any case, Vanguard Total Stock Market Index Fund ETF Shares (NYSE:VTI) rose 1.4%, pushing further into record terrain—and driving the bears deeper into depression and frustration as cries of bubble and over valued echo throughout the land.
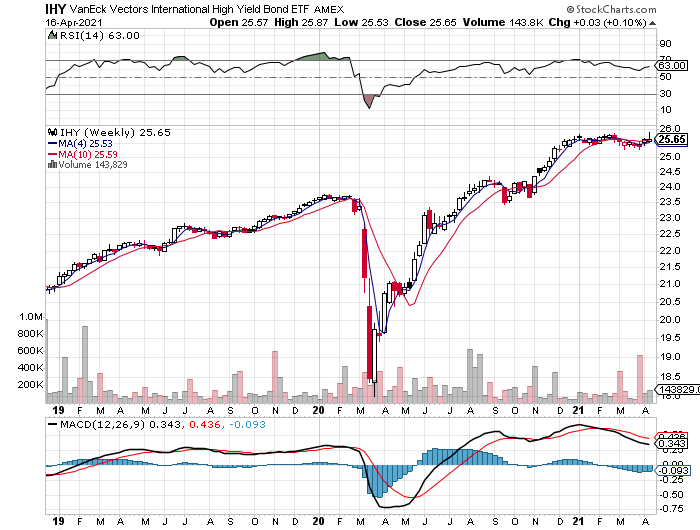
The weakest performer last week: foreign junk bonds. VanEck Vectors International High Yield Bond ETF (NYSE:IHY) squeaked out a 0.1% gain, but don’t let that fool you: the fund continued to show signs of going nowhere fast. Then again, the fund enjoyed a near-4.7% trailing yield—all the more attractive if the rate rise has run its course for the foreseeable future.
Asset allocation wins again
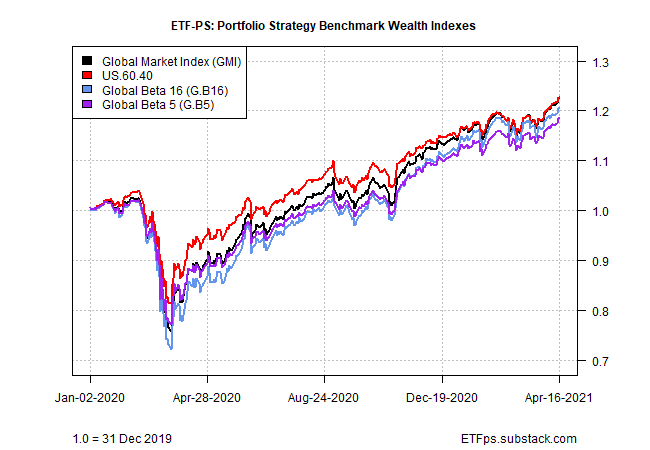
With a bullish tailwind blowing in markets around the world last week, our suite of strategy benchmarks followed suit. For a fourth straight week, all four yardsticks of asset allocation rallied.
The strongest performer: Global Beta 16 (G.B16), which holds all 16 funds in the table above in the weights noted below (a 60% equities/30% bonds/10% alts mix). G.B16 rose 1.3%, lifting its year-to-date gain to an impressive 7.4% -- the best of the bunch.
In a sign of what may be a turning tide, the US 60/40 stock/bond mix (US.60.40) was in last place last week. Ditto for year-to-date results. The old, reliable US-focused portfolio benchmark continued to churn out profits. But foreign assets were showing signs of life. Is global diversification on the cusp of reviving its reputation after a long spell of subpar performance? Watch this space.

