Trade tariff talk is just that, we've yet to get anything concrete. Yet, the market is emotional.
This is nothing new, if there is anything we've learned from the first year (+) of the Trump presidency, it is the conversation always starts with drama, but then settles down to something more reasonable. Unfortunately, the markets haven't quite figured that out yet. Those that believe markets are efficient will have a hard time explaining what we've seen in the previous three or four trading sessions.
Tariff discussions, without any concrete decisions, can't explain such big swings in asset prices. The only rational explanation for this type of volatility is (ironically) irrationality. Markets are emotional, and we are being reminded of that. The low volatility slumber of 2016 and 2017 were anomalies and are probably behind us.
The buy-and-holders might not be happy with the market environment before us, but the reality is the expanded volatility will eventually provide opportunities for traders (particularly option sellers). Further, it might not feel like it but this is a healthier market than what we saw in late 2017 and January 2018.
Treasury Futures Markets
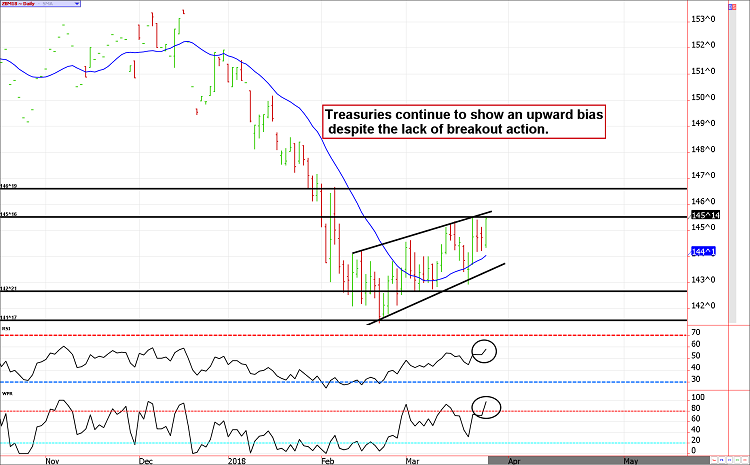
The 30-year will need to poke over 146 to confirm a trend change.
Anybody who has been following this newsletter knows we have seen perpetually bullish Treasurys since early February. It has been a long and boring ride, but the bond market is finally starting to react to its surroundings. Although stock market volatility has ticked up in recent months, Treasury (and even currency) volatility is still extremely low relative to historic norms. As complacent stock index traders learned in January, low volatility can last for extended periods of time but it never lasts forever.
Given the mass number of short market participants in the 10 Year T-Note Futures contract, there could be a surprisingly sharp short squeeze on the horizon.
Treasury futures market consensus:
The ZB needs to print above 146'0 to confirm a trend change.
**Technical Support:** ZB : 143.23, 142.21, 141.17 and 140.19 ZN: 120.04, 119.26, 119.16 and 119.08
**Technical Resistance:** ZB: 146.03, and 146.24 ZN: 121.01, 121.15, and 122.01
Stock Index Futures
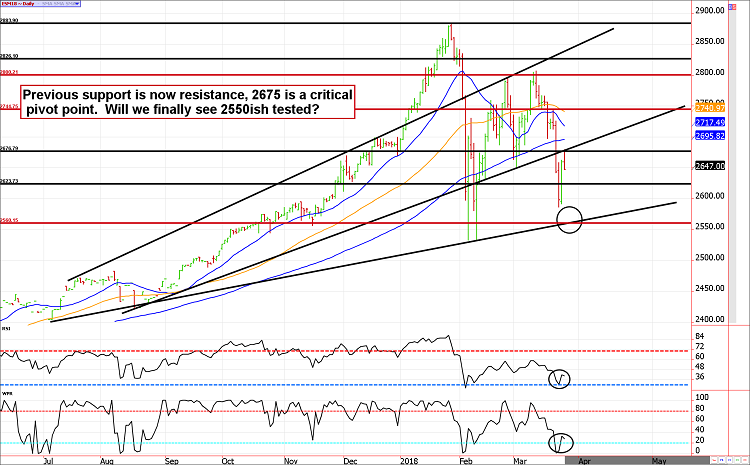
We can't rule out a quick test of 2550, but most of the selling has likely already been seen
Seasonal tendencies are leaning higher in the coming weeks and support should be seen near 2550ish. Things are going to be messy in the short-run, but trend line support should continue to hold for now. If you are a bull, well-hedged positions (or even limited-risk long call options) are probably worth a shot somewhere between 2560 and 2550 but traders will need to be quick-triggered; those prices might not last long.
That said, it is time to consider the possibility that the bull market we've all grown to love over the last 9 years could be slowly dying.
Stock Index Futures Market Ideas
**E-mini S&P Futures Market Consensus:**
2675 resistance held and the market quickly fell apart. We will likely see a full test of the trend line near 2550/2560.
**Technical Support:** 2560 and 2530
**Technical Resistance:** 2675, 2744, 2799, 2830, and 2882
E-mini S&P Futures Day Trading Ideas
**These are counter-trend entry ideas, the more distant the level, the more reliable, but the less likely to get filled**
ES Day Trade Sell Levels: 2664, 2697, and 2744
ES Day Trade Buy Levels: 2580, 2560, and 2544
In other commodity futures and options markets....
January 30 - Buy June ZN near 121'09, sell an April 121 call and buy a March 120 put as catastrophic insurance.
February 15 - Sell May ZN 121 call to refresh bullish ZN position hedge.
February 20 - Buy back April 121 ZN call to lock in gain, sell March ZN put near breakeven.
February 21 - Sell long June ED 98 put to lock in a profit of anywhere from $550 to $600. This leaves our long futures contract underwater and "naked."
March 2 - Sell May soybean meal futures near 3.95, sell a May 3.95 put then buy an April 4.30 call for insurance.
March 8 - Sell a June 121 10-year note call against the long futures position (hold short May 121 call).
March 15 - Exit covered put in May soybean meal to lock in a gain of about $850 prior to transaction costs.
March 20 - Go long June soybean meal futures near 363 and sell a June 360 call against it. Purchase a May 340 put for catastrophic insurance.
March 20 - Buy back May ZN 121 call to lock in the profit (roughly $250 per lot before transaction costs) and sell the June 121 call for about 30 ticks to freshen up the hedge going into the Fed meeting (this leaves the position with a long June 10-year note futures contract and 2 short 121 calls).
March 21 - Sell the June live cattle 102 put and purchase the April cattle 113 put for insurance (the April cattle is trading much higher than June).
March 23 - Go long July corn future, buy a July 3.80 put and sell a July 4.10 call. The net out of pocket expense and risk is roughly 7.5 cents or $375, max profit potential is about $1,050 before commissions and fees.
March 27 - Go long July sugar 13.50 calls near 27 ticks or roughly $300.
