
This week has been a real roller-coaster ride for the equity markets. Although we saw a bit of weakness in the markets, positive economic data and company earnings could help keep the “risk-on” environment for a while. The ECB delivered its monetary policy report, together with the interest rate decision. Preliminary PMIs are in focus.
A Jumpy Week For Equities
This week has been a real roller-coaster ride for the equity markets. Yesterday, although “risk-on” trading has been dominating through most of the day, starting from the Asian session, then throughout the whole of the European session and till late US session, it all when downhill when reports started coming out that Joe Biden is planning to propose a much higher capital gains tax (CGT) for the rich.
The proposal is to raise the CGT to 39.6% and then to use that money to fund education and childcare. Investors did not welcome the news very well, sending the US indices back into negative waters. European and Asian cash equities indices followed suit and slid below their closing levels. If Biden’s proposal was to become a law next year, investors may start locking in profits some time this year, forcing indices to slide.
However, until any real action could be taken, equity markets might stay under buying interest, as we are currently in the earnings season. Next week we have big companies like Tesla (NASDAQ:TSLA), Microsoft (NASDAQ:MSFT), Alphabet (NASDAQ:GOOGL), UPS (NYSE:UPS), Apple (NASDAQ:AAPL), Facebook (NASDAQ:FB), Amazon (NASDAQ:AMZN), Exxon Mobil (NYSE:XOM) and Chevron (NYSE:CVX), all delivering their 2021 Q1 results. Of course, there are various expectations on those earnings, but if most of them come out better than their initial forecasts, this could help indices to rally again.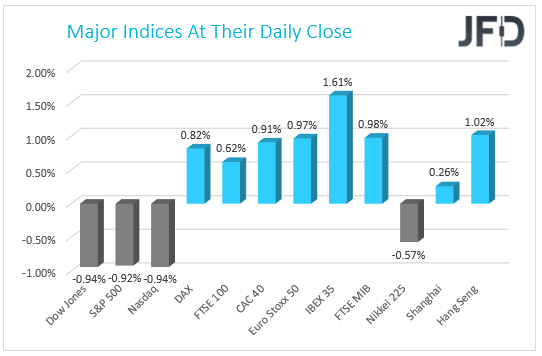
Economic data may also help markets to stay in “risk-on” mode. For example, yesterday we received a lower number for the weekly initial jobless claims. The number came out at 547k, beating the forecast of 617k and also the previous reading of 586k (adjusted). Unfortunately, continuing claims were not as good. The number came out at 3674k, which is slightly above the initial expectation, but still below the previous 3708k (adjusted).
S&P 500 Technical Outlook
Looking at the S&P 500 cash index on our 4-hour chart, after yesterday’s sharp decline, the price is now moving sideways and struggling to get back above the 4146 barrier. At the same time, the index is trading below the 21-day EMA and around the 50-day EMA. In the very short run, this does not paint a very positive picture, which may result in a continuation move lower. But even if that happens, let’s not forget that overall, the price is still balancing above a short-term tentative upside support line taken from the low of Mar. 4. For now, we may class this move lower as a temporary correction.
A further slide might bring the index closer to the current low of this week, at 4118, which could provide a temporary hold-up. The price may rebound back up a bit, however, if it continues to trade below the 4146 zone, another drop could be possible. The S&P 500 might once again test the 4118 obstacle, a break of which would confirm a forthcoming lower low, possibly clearing the way towards the 4090 level, marked by the low of Apr. 9.
On the upside, if the price is able to climb back above the 4157 barrier, marked by yesterday’s intraday swing low, this would also place the index back above the 21-day EMA, which may be seen as positive sign. The S&P 500 might then travel to yesterday’s high, at 4180, or to the current all-time high, at 4191. If the buying continues, a break of the 4191 barrier would place the index into the uncharted territory.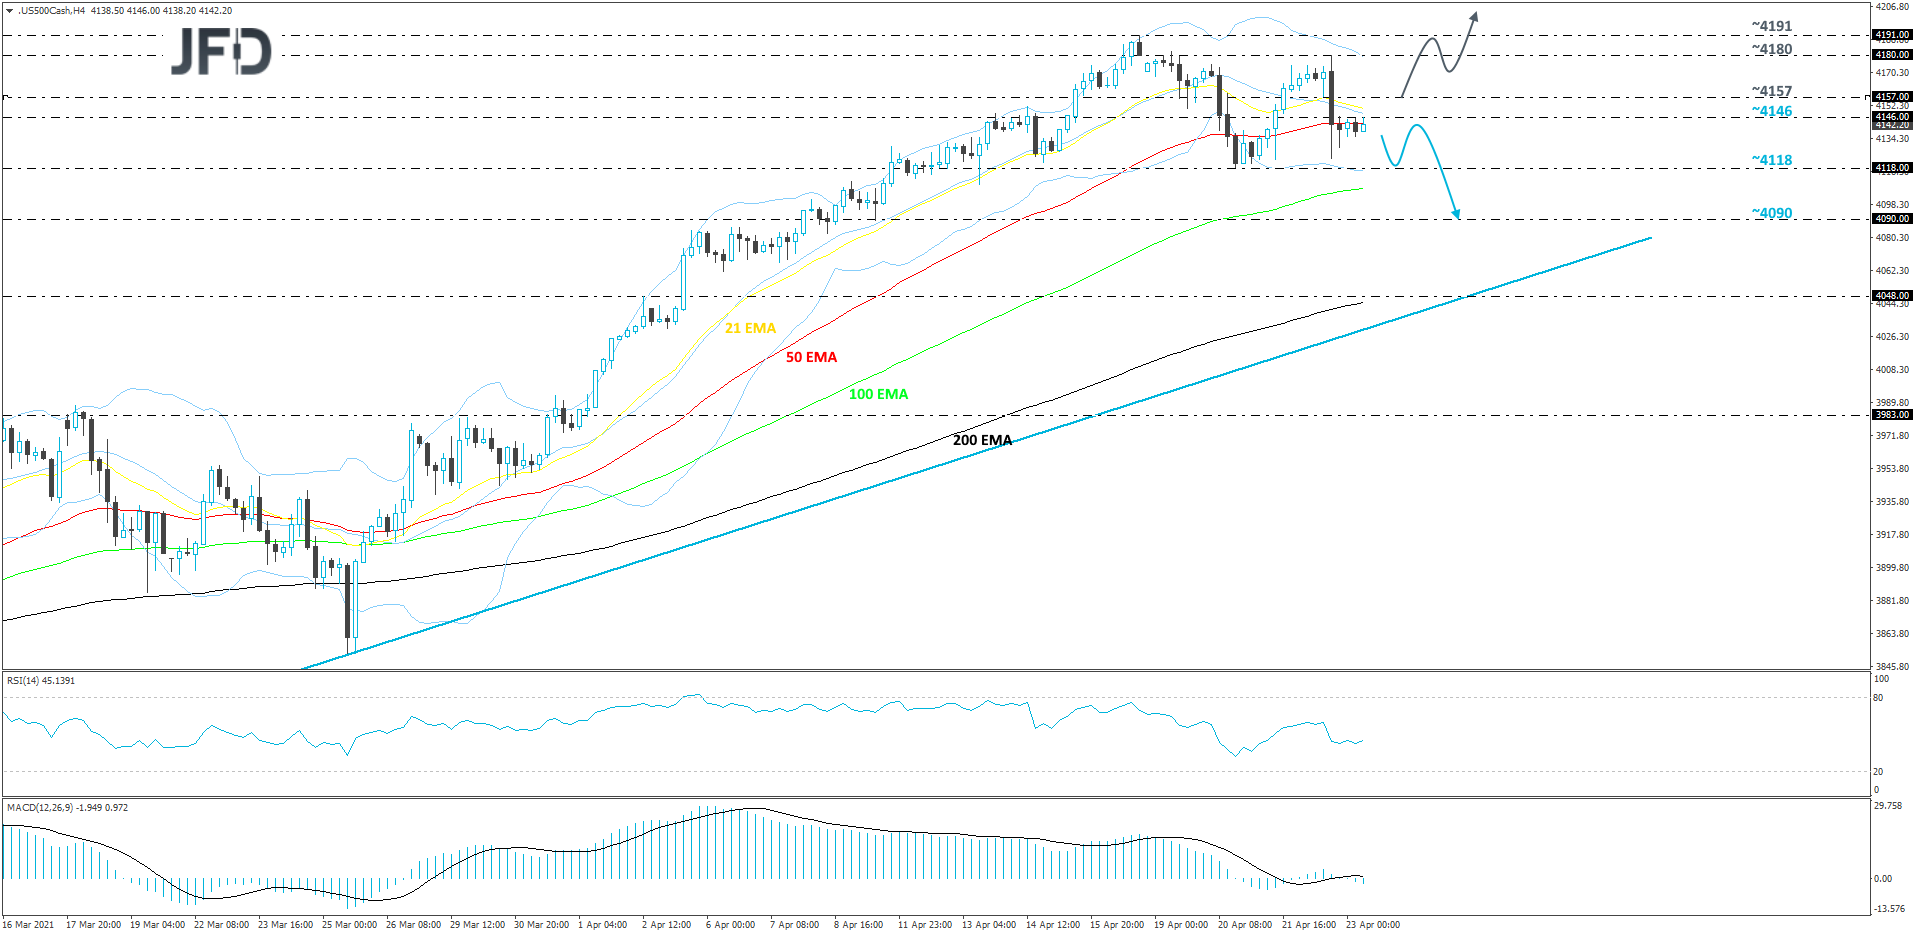
ECB Is Still Feeling Headwinds
In regards to other big news from yesterday, the spotlight fell on the ECB, as it delivered its monetary policy report, together with the interest rate decision. As it was expected, the Bank kept the rates at their previous levels. The Governing Council also stated in the press release that they will continue the net asset purchases under the PEPP until at least March 2022. In addition to that, it was also stated that:
“If favourable financing conditions can be maintained with asset purchase flows that do not exhaust the envelope over the net purchase horizon of the PEPP, the envelope need not be used in full. Equally, the envelope can be recalibrated if required to maintain favourable financing conditions to help counter the negative pandemic shock to the path of inflation”.
During the press conference, President Lagarde mentioned that, despite inflation picking up over the past few months, demand is still weak and the near-term economic outlook is uncertain.
EUR/GBP Technical Outlook
On Monday, after finding good support near the 0.8588 hurdle, EUR/GBP reversed north again and is now seen trading above a short-term upside support line taken from the low of Apr. 5. If that upside line remains intact, we will continue aiming higher, at least in the near term.
Even if we see another small slide, but the fall gets halted somewhere near the aforementioned upside line, the bulls may join in again, potentially pushing the rate higher. EUR/GBP might then drift to yesterday’s high, at 0.8702, a break of which may open the door for further advances. We will then target the current highest point of April, at 0.8719, a break of which might set the stage for a move to the 0.8731 level, marked by the high of Feb. 26.
Alternatively, if the pair breaks the previously discussed upside line and falls below the 0.8644 hurdle, marked by the high of Apr. 21, that could spook the buyers from the field for a while. More sellers could join in and drag EUR/GBP towards the 0.8612 obstacle, a break of which may lead the rate to the current lowest point of this week, at 0.8588.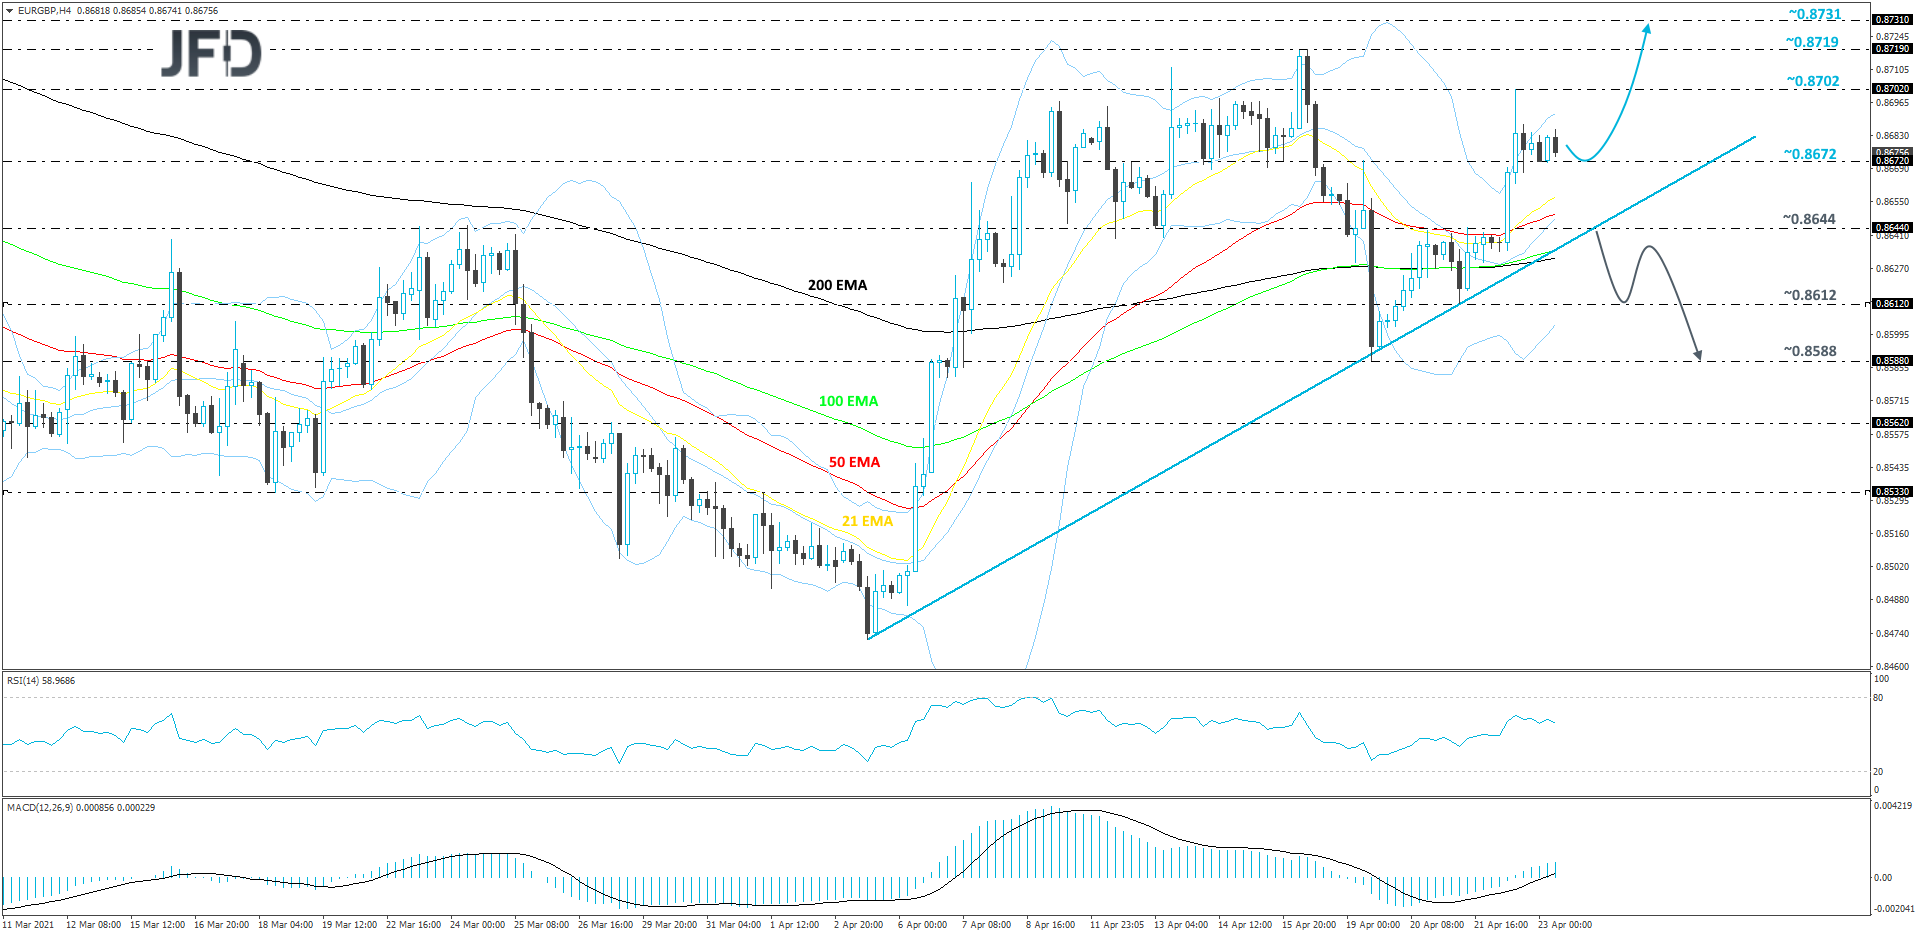
As For The Rest Of Today's Events
This morning UK delivered its retail sales numbers for the month of March. The figures are both core and headline, on a MoM and YoY basis. All actual readings were on the higher side, coming out significantly higher than their initial forecasts. The best result was seen in relation to the headline MoM retail sales number, which managed to beat the initial forecast of +1.5% by showing up at +5.4%.
UK will also release its set of the same data, but currently, there are no forecasts. Then it will be the US turn to show us their preliminary PMI figures for April. There is no forecast for the composite one, but both the manufacturing and the services numbers are believed to have improved slightly. The manufacturing one is forecasted to go from 59.1 to 60.5 and the services reading is expected to go from 60.4 to 61.9.